
Sum-of-the-Parts (SOTP) Financial Model Template
A Sum-of-the-Parts (SOTP) valuation model is the standard way to value a conglomerate, a holding company or any multi-segment business whose divisions deserve different multiples. This professional SOTP valuation Excel template values each business segment on its own merits. It blends discounted cash flow (DCF), trading comparables and precedent transactions. It then deducts the holding company (HoldCo) discount and walks from enterprise value to equity value and an implied share price. It is built for equity research analysts, investment bankers, private equity teams, corporate development professionals and finance students who need a robust, fully linked sum-of-the-parts analysis in Excel.
5-Year Some Of The Parts (SOTP) Financial Model
The model combines 3 years of monthly historical actuals with a 5-year monthly forecast and an annual FY roll-up after every 12 months, all reported in USD. Four operating segments are forecast from price and volume drivers through gross profit, EBITDA, EBIT and free cash flow. Non-core businesses and corporate centre costs are modelled separately, and everything consolidates into a group view. Every date in the workbook is driven by a single Forecast Start Date. Change one cell and all 13 tabs re-date automatically, including the fiscal year-end, labels and discount periods.
Inside you’ll find a complete SOTP equity value bridge, WACC calculation, terminal value options and DCF sensitivity tables. Trading comps run on both forward and LTM/NTM bases, and a precedent transactions analysis applies control premium adjustments. There is also an itemised net debt schedule with a revolver and interest forecast. Scenario analysis (Bear, Base and Bull), methodology selectors and 11 automated model checks make this SOTP model fast to adapt, easy to audit and ready to present to investment committees, clients or lenders.
What’s Inside – Tab by Tab
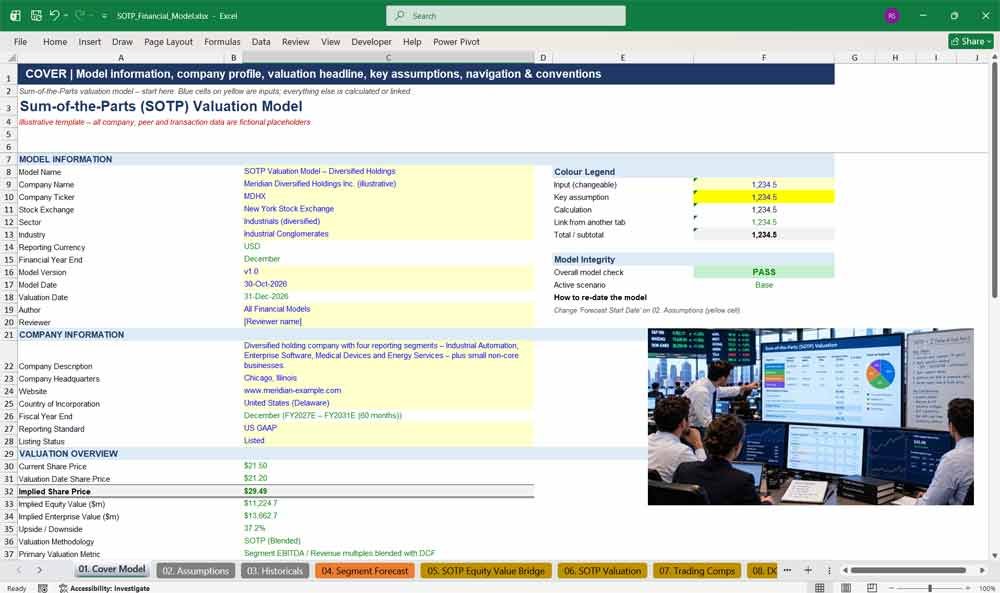
01. Cover Model
The Cover Model tab is the front page of this SOTP valuation Excel template. It summarises model information, company profile, implied share price, upside, key assumptions and conventions, with clickable navigation to every tab and a live PASS/REVIEW model-integrity check.
- Model and company information panels ready for your branding
- Headline valuation: implied share price, equity value, enterprise value and upside
- Key assumptions snapshot: WACC, terminal growth, exit multiple and tax rate
- One-click hyperlink navigation to all 13 tabs
- Colour legend and an overall model check status
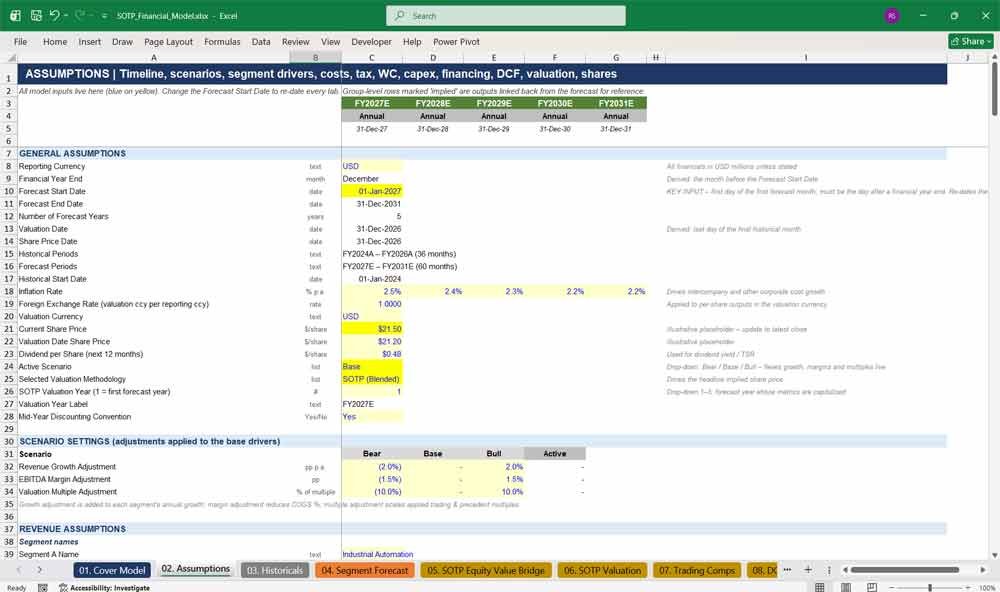
02. Assumptions
The Assumptions tab is the control centre of the sum-of-the-parts model. One Forecast Start Date re-dates the whole workbook, while segment revenue drivers, cost ratios, tax, working capital, capex, financing, DCF inputs, valuation weights and share count are all editable inputs.
- A single start date drives every date, label and fiscal year-end
- Bear, Base and Bull scenario switch flexing growth, margins and multiples
- Segment-level price, volume, market share and M&A growth drivers
- Valuation metric selector per segment (Revenue, EBITDA or EBIT)
- Treasury stock method dilution for options and warrants
- Drop-down selectors for methodology, terminal value method and benchmark statistic
Sum-of-the-Parts (SOTP) Valuations & Forecasting
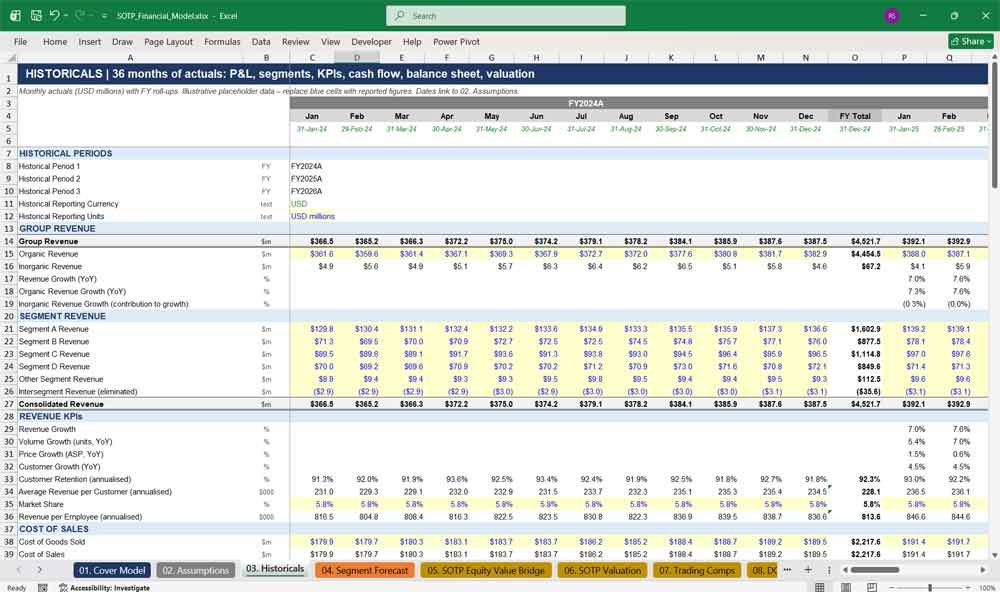
03. Historicals
The Historicals tab holds 36 months of actuals with fiscal-year totals. It covers group and segment revenue, P&L, EBITDA by segment, cash flow, a balancing balance sheet, operating KPIs and historical valuation multiples, providing the base for the five-year forecast.
- Monthly income statement, cash flow and balance sheet
- Segment revenue and EBITDA with intersegment eliminations
- Revenue KPIs: volume, price, customer growth, retention and revenue per employee
- Historical EV/Revenue, EV/EBITDA, EV/EBIT, P/E and FCF yield
- Built-in balance sheet check (assets = liabilities + equity)
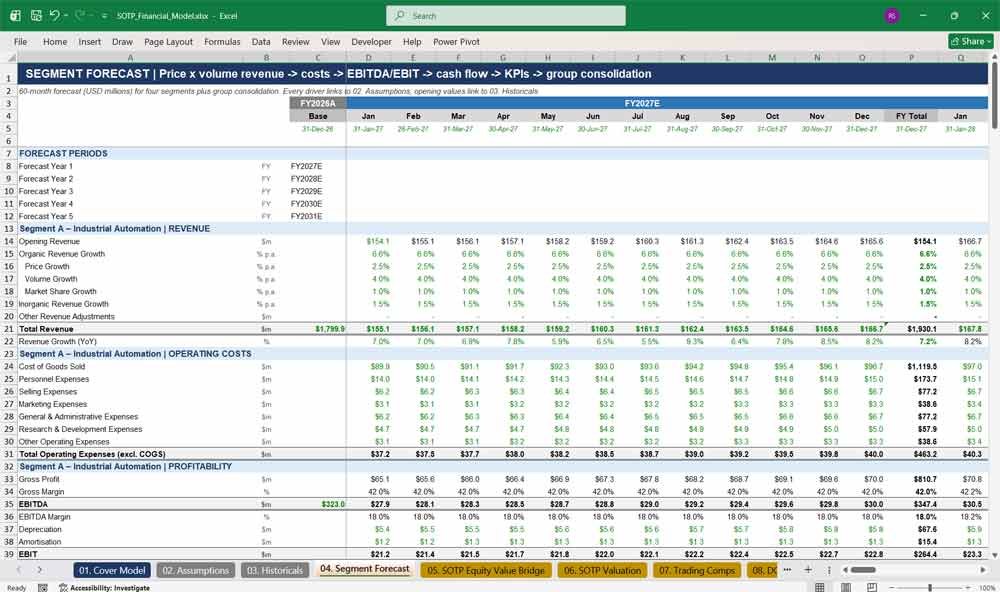
04. Segment Forecast
The Segment Forecast tab builds a 60-month projection for four business segments using price × volume revenue drivers. Each segment flows through operating costs, EBITDA, EBIT, cash taxes, working capital, capex, free cash flow and KPIs before consolidating into the group.
- Monthly revenue compounding from the last actual month
- Full cost build: COGS, personnel, selling, marketing, G&A, R&D and other opex
- Segment free cash flow with maintenance and growth capex
- Operating KPIs: customers, units, ASP, market share, headcount and revenue per employee
- Group consolidation with an EBITDA reconciliation check
05. SOTP Equity Value Bridge
The SOTP Equity Value Bridge tab walks line by line from segment enterprise values to implied equity value. It deducts each debt and debt-like item, adds cash and investments, builds the fully diluted share count and calculates the implied share price and upside.
- Segment EVs plus Other business, HoldCo adjustment and non-operating assets
- Itemised deductions: short-term debt, long-term debt, revolver, leases, pension and minority interest
- Additions for cash, investments, associates and joint ventures
- Fully diluted share count including options, RSUs, convertibles and warrants
- Absolute and percentage upside versus the current share price
06. SOTP Valuation
The SOTP Valuation tab is the heart of the model. Each segment is valued on its selected metric and forecast year by blending DCF, trading comps and precedent multiples. The tab then applies the HoldCo discount, valuation adjustments and the equity bridge to reach a weighted share price.
- Segment-by-segment revenue, growth, EBITDA, margin and EBIT
- Applied EV/Revenue, EV/EBITDA and EV/EBIT multiples
- Adjustable DCF, comps and precedents weighting
- Other business valuation and corporate cost discount
- Enterprise value bridge, equity value bridge and implied share price
07. Trading Comps
The Trading Comps tab benchmarks twelve peers, three per segment. It covers market data, enterprise value build, historical and forward financials, growth, profitability and trading multiples, and produces peer statistics and adjusted segment multiples that drive comparable company valuations.
- Full EV build from market capitalisation through debt, leases and cash
- Historical and forward EV/Revenue, EV/EBITDA, EV/EBIT and P/E
- Mean, median, quartile, minimum and maximum peer statistics
- Peer adjustments for growth, margin, mix, size, leverage and cyclicality
- Implied enterprise value per segment and a trading comps share price
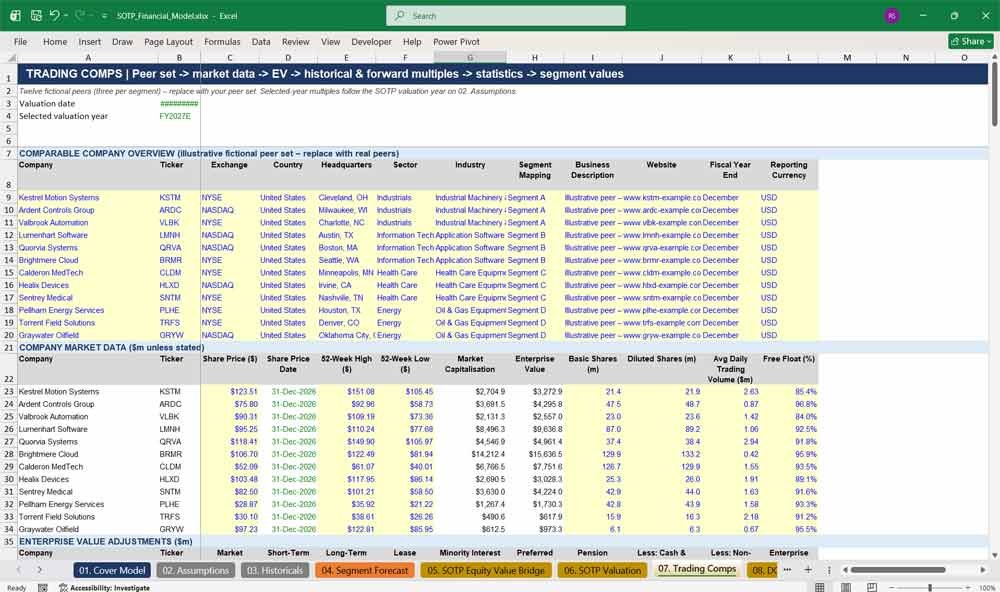
Sum-of-the-Parts (SOTP) Trading Comps
08. DCF
The DCF tab calculates unlevered free cash flow, WACC, terminal value and enterprise value for the group or any individual segment. It also includes tax-loss carryforward utilisation, mid-year discounting and full sensitivity grids for WACC, terminal growth and exit multiples.
- Drop-down to run the DCF for the Group or Segment A–D
- WACC built from risk-free rate, equity risk premium and relevered beta
- Perpetuity growth, exit multiple or average terminal value
- Sensitivity tables for enterprise value, equity value and share price
- Compact DCF by business that feeds the SOTP valuation
09. Trading Comps LTM-NTM
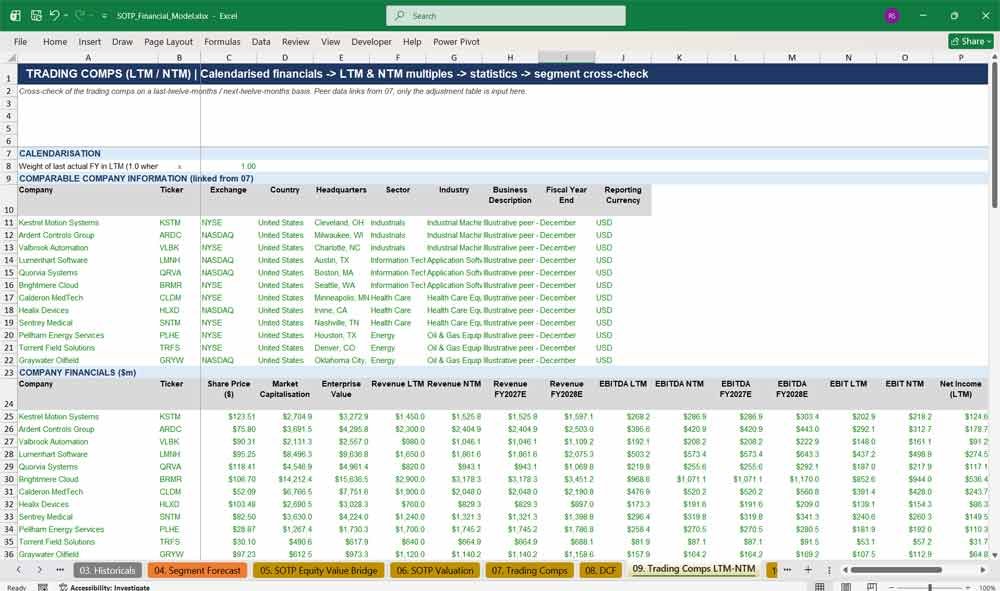
The Trading Comps LTM-NTM tab cross-checks peer valuations on a calendarised last-twelve-months and next-twelve-months basis. It calculates LTM and NTM multiples, P/FCF and FCF yield, applies segment adjustments and produces an independent comps-based share price for validation.
- Automatic calendarisation for non-December valuation dates
- EV/Revenue, EV/EBITDA and EV/EBIT on LTM and NTM bases
- P/E LTM, P/E NTM, P/FCF and FCF yield
- Comparable company statistics and adjustment table
- Segment-level implied EV and valuation summary
10. Precedents
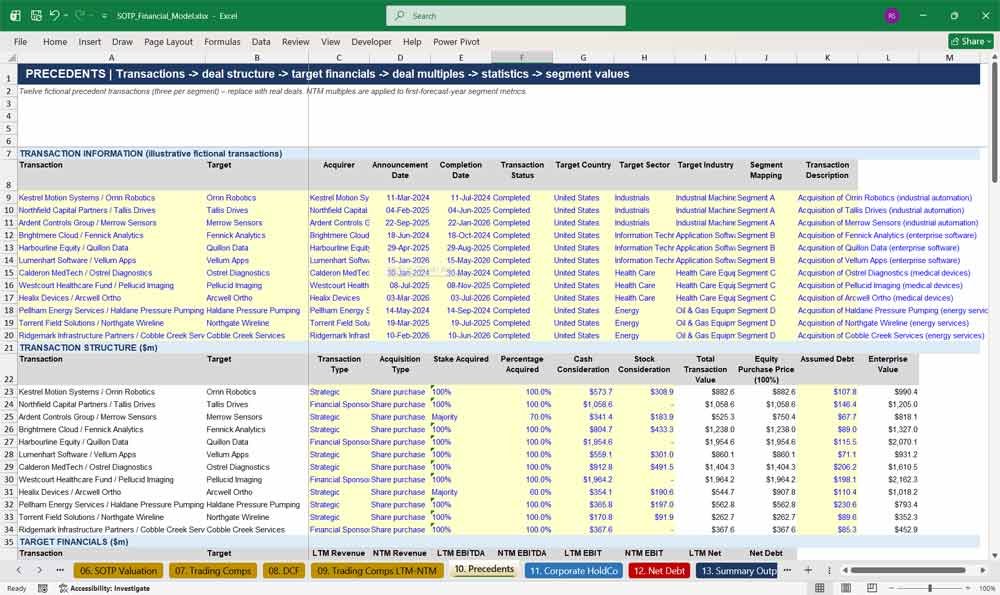
The Precedents tab analyses twelve M&A transactions across the four segments. It captures deal structure, consideration, target financials and transaction multiples, adjusts for control premiums and synergies, and values each segment on precedent transaction multiples.
- Transaction details: acquirer, dates, status and consideration mix
- Equity purchase price grossed up to 100% and enterprise value
- LTM and NTM EV/Revenue, EV/EBITDA and EV/EBIT multiples
- Control premium, synergy and distressed sale adjustments
- Precedent-based segment values and implied share price
11. Corporate HoldCo
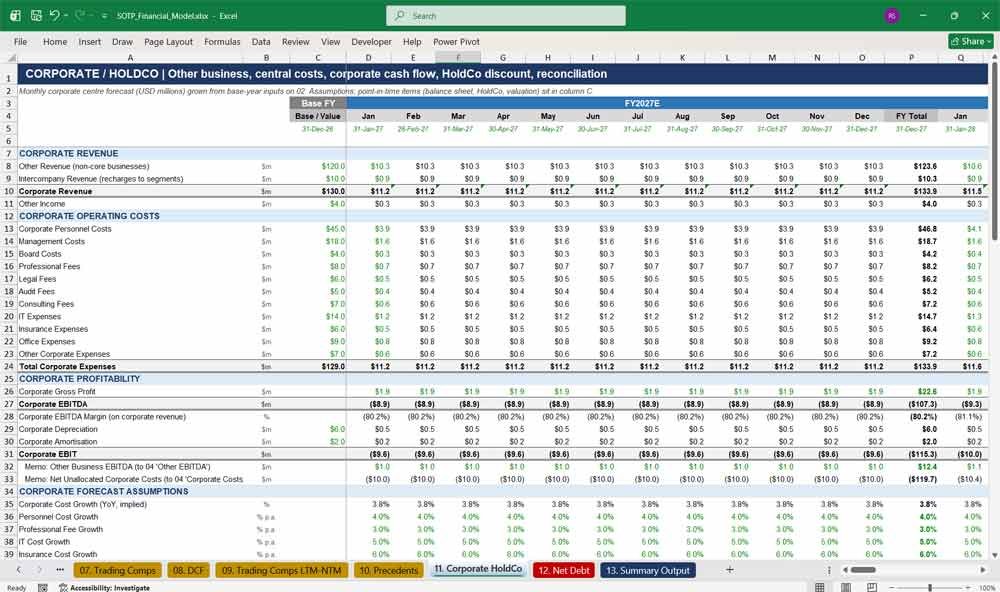
The Corporate HoldCo tab forecasts non-core business revenue, intercompany recharges and eleven central cost lines monthly. It calculates corporate EBITDA and cash flow, values the HoldCo discount by capitalisation multiple or perpetuity, and reconciles segment and group EBITDA.
- Corporate costs grown by category-specific inflation rates
- Other business EBITDA separated from unallocated corporate costs
- HoldCo discount via capitalisation multiple or after-tax perpetuity PV
- Other corporate items: investments, pensions, provisions and liabilities
- Group EBITDA and EBIT reconciliation checks
12. Net Debt
The Net Debt tab itemises cash, financial investments, short- and long-term debt, leases and debt-like items at the valuation date. It forecasts term debt, an automatic revolving credit facility, cash and interest monthly, and calculates leverage and coverage ratios.
- Detailed breakdown that reconciles to the historical balance sheet
- Headline, financial and adjusted net debt definitions
- Mandatory and voluntary debt repayments with new issuance
- Automatic revolver draw to maintain a minimum cash balance
- Net debt/EBITDA, interest cover and debt/equity ratios
13. Summary Output
The Summary Output tab presents the full valuation on one page. It covers operating performance with a revenue and EBITDA chart, a methodology comparison, EV and equity bridges, investment returns, sensitivities, Bear/Base/Bull scenarios, key investment metrics and eleven automated model checks.
- Side-by-side SOTP, DCF, trading comps and precedents valuations
- Selected methodology drives the headline implied share price
- EV/EBITDA, EV/Revenue, WACC, growth, exit multiple and net debt sensitivities
- Scenario share prices for Bear, Base and Bull cases
- PASS/REVIEW model checks covering every key reconciliation
Why Buy This Model
Building a credible sum-of-the-parts valuation from scratch can take days, and one broken link can quietly undermine the answer. This SOTP Excel model gives you a complete, fully linked framework from day one. It has 13 structured tabs, more than 23,000 live formulas, zero hardcoded results and 11 automated checks that confirm everything ties out. It values each segment the way professionals do, blending DCF, trading comps and precedent transactions and applying a proper HoldCo discount. A single start date keeps the whole model current. The colour-coded inputs, clear section headers and a one-page summary make it quick to adapt to any conglomerate, and easy for reviewers, clients and investment committees to trust. Simply replace the illustrative data with your company’s figures and you have a presentation-ready SOTP valuation.
Sum-of-the-Parts (SOTP) Frequently Asked Questions
What is a Sum-of-the-Parts (SOTP) valuation and when should I use it?
An SOTP valuation values each business segment separately and adds the values together. You then deduct corporate costs and net debt to reach equity value. It is ideal for conglomerates, holding companies and multi-division businesses where segments have different growth rates, margins and peer multiples.
Which valuation methods does the model use?
The model uses all three core methods: discounted cash flow (DCF), trading comparables and precedent transactions. Each segment’s value is a weighted blend of the three, and you set the weights. You can also choose which method drives the headline share price.
Can I change the dates, the forecast period or the financial year-end?
Yes. Change the Forecast Start Date on the Assumptions tab and the entire model re-dates automatically. This includes every month, fiscal-year label, discount period and the financial year-end. A July start date, for example, converts the model to a June year-end.
What time periods does the model cover?
It includes 3 years of monthly historical data and a 5-year monthly forecast. An annual FY Total column follows every 12 months, and the valuation tabs work from those annual roll-ups.
How many business segments does it support?
It includes four fully modelled operating segments. It also covers an “Other” business line for non-core activities and a corporate centre. Segment names are editable inputs, and they flow through every tab automatically.
Does it include a HoldCo or conglomerate discount?
Yes. Unallocated corporate costs are valued and deducted as a HoldCo discount. You can choose either a capitalisation multiple or an after-tax perpetuity present value. The discount appears clearly in the enterprise value bridge.
Can I run different scenarios?
Yes. A Bear/Base/Bull scenario switch flexes revenue growth, EBITDA margins and valuation multiples live across the whole model. The Summary Output also shows the implied share price under each scenario side by side.
How does the model handle net debt and debt-like items?
The Net Debt tab itemises cash, investments, short- and long-term debt, leases, pensions and ten categories of debt-like items. It then provides headline, financial and adjusted net debt definitions. It also forecasts debt repayments, an automatic revolving credit facility and interest.
How is the diluted share count calculated?
The fully diluted share count adds RSUs, other dilutive securities and in-the-money convertibles to basic shares, then deducts treasury shares. Options and warrants are included using the treasury stock method at the current share price, which avoids circular references.
What sensitivity analysis is included?
The DCF tab includes grids for WACC versus terminal growth and WACC versus exit multiple, covering enterprise value, equity value and share price. The Summary adds EV/EBITDA, EV/Revenue and net debt sensitivities.
Is the data real? Can I use it for my company?
All company, peer and transaction data are illustrative placeholders. Blue input cells on a yellow background show exactly where to enter your own historicals, peers, transactions and assumptions. Every calculation then updates automatically.
How do I know the model is working correctly?
Eleven automated checks run on the Summary Output tab and are mirrored on the Cover. They cover segment and group reconciliations, enterprise and equity value bridges, net debt, share count, valuation weights, sensitivity grids and the historical balance sheet. Each one shows PASS or REVIEW.
Do I need macros or add-ins?
No. The model is built entirely with standard Excel formulas. It needs no macros, VBA, add-ins or circular references, so it works in any modern version of Microsoft Excel.
Who is this model designed for?
It is designed for equity research analysts, investment bankers, private equity and corporate development teams, CFOs, investors and finance students. It suits anyone who needs a professional, auditable sum-of-the-parts valuation in Excel.
Can I customise the formatting and structure?
Yes. The model is fully unlocked and follows a consistent, colour-coded design system. Inputs, calculations, links and totals are each formatted differently, which makes it straightforward to extend, rebrand or adapt to your own reporting style.
Value Your Some Of The Parts Model (SOTP) With A DCF
The discounted cash flow engine, run twice: once as a consolidated cross-check on the whole business, and once for each individual segment. Each version builds unlevered free cash flow from EBIT, discounts it at the WACC, and calculates a terminal value using the Gordon Growth method — capturing the present value of every cash flow expected beyond FY2030E. The per-segment enterprise values calculated here feed directly into the SOTP Valuation tab.
Further Reading
Merger & Acquisitions Model: Download a professional M&A financial model. Dynamic valuation, accretion/dilution analysis, synergies, and debt schedules.
- LBO Model: Ready to master corporate finance? Download our proven, step-by-step LBO financial model template to analyze leveraged buyouts, project debt paydown, and forecast returns like a seasoned private equity professional.
- IPO Model: A fully-linked, formula-driven financial model built to take a company from
historical actuals through an IPO and out to a five-year forward plan.