
IPO Financial Model Template
Planning an initial public offering takes more than a spreadsheet of guesses — it takes a fully integrated financial model that connects historical performance, operating projections, and IPO mechanics into one defensible story. This eight-year IPO financial model template gives founders, CFOs, investment bankers, and equity research analysts a complete, formula-driven Excel model spanning three years of historical financials and five years of forward projections, with the critical first two years broken out quarterly. Built across 30 fully linked tabs, this IPO model template eliminates the weeks of build time normally required to prepare a company for a public offering, letting you focus on the story instead of the spreadsheet mechanics.
Further Reading
Interactive Dashboard & Webapp: This financial model still lives in a 30-tab Excel file, you already know the problem: the numbers are right, but nobody outside of finance can actually use them. This interactive dashboards and webapp solves this by turning a static, formula-heavy workbook into a living tool that anyone can use.
8-Year financial model for an Initial Public Offering (IPO)
Unlike generic financial projection templates, this model is purpose-built for the IPO process from the ground up. It includes a dedicated IPO Assumptions tab, IPO share count and proceeds waterfall, a pre- and post-IPO capitalization table, dilution analysis, use-of-proceeds allocation, and a pro forma balance sheet — all wired directly into the underlying three-statement model so that every assumption change flows through to valuation automatically. A trailing-twelve-month (LTM) column captures your company’s financial profile at the exact moment of pricing, giving bankers and investors the clean, audit-ready metrics they expect to see in an IPO valuation model.
Whether you’re preparing a board presentation, building an S-1 supporting schedule, or pressure-testing valuation ahead of a roadshow, this Excel IPO model delivers DCF valuation, trading comparables, precedent transactions, scenario analysis, and sensitivity tables in a single downloadable workbook. Every historical figure is hardcoded and traceable; every projected figure is a live formula tied back to one central assumptions tab, so the entire model — three-statement projections, IPO mechanics, and valuation output — updates instantly when you change a single input. It’s the fastest way to go from historical financials to a fully priced IPO valuation model.
IPO Model Tab-by-Tab Description
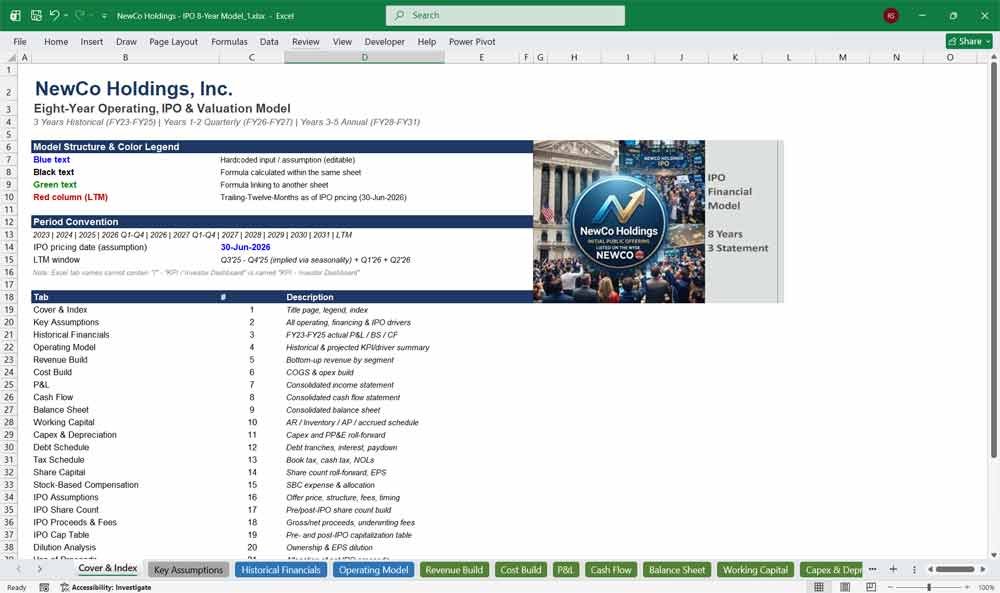
Cover & Index
The homepage of this IPO financial model template, giving new users an instant orientation to the workbook’s structure, color-coding convention, and 30-tab index — making this Excel IPO model easy to navigate for finance teams, bankers, and first-time buyers alike.
- Full clickable index of all 30 tabs with descriptions
- Color-coded legend (inputs, formulas, cross-sheet links)
- States the IPO pricing date and LTM window convention
- Ideal first stop for onboarding a new model user
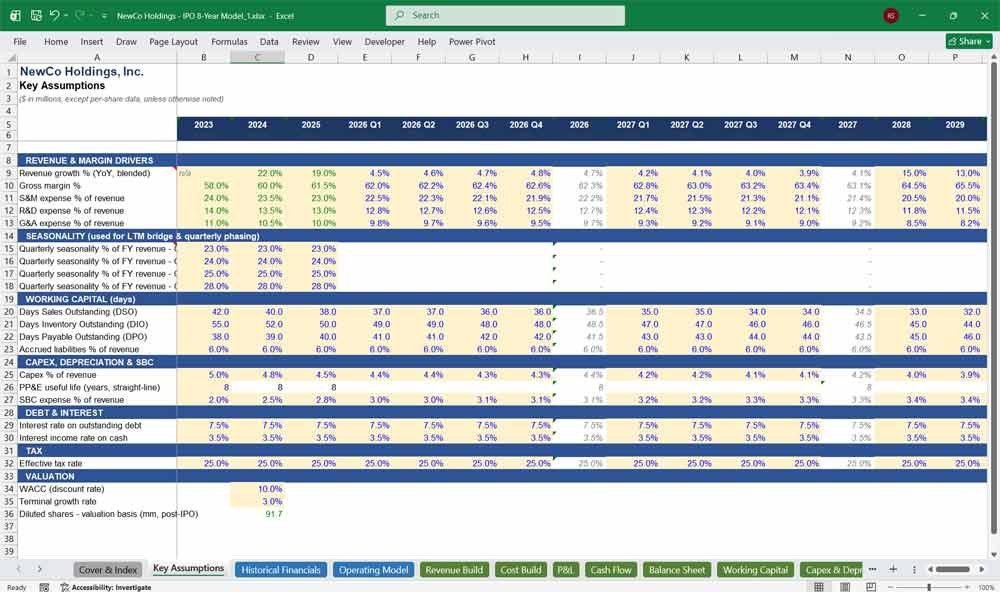
Key Assumptions
The single driver tab behind this entire IPO valuation model — every revenue growth rate, margin, working capital day, capex ratio, tax rate, and WACC input lives here, letting users flex the whole eight-year financial model from one central, fully linked location.
- One central tab drives all 30 linked tabs
- Covers growth, margin, working capital, capex, tax, and WACC
- Historical inputs auto-tie to reported actuals
- Editable blue cells for every forward-looking assumption
Historical Financials
A fully articulated three-year historical financial statement package — income statement, balance sheet, and cash flow — providing the audited-style historical foundation every credible IPO model and pre-IPO valuation analysis needs before projecting forward.
- Three years of historical P&L, balance sheet, and cash flow
- Balances exactly, period over period, like a real filing
- Feeds ratios directly into the Key Assumptions tab
- Built as hardcoded source data for auditability
IPO Model Three-Statement Engine
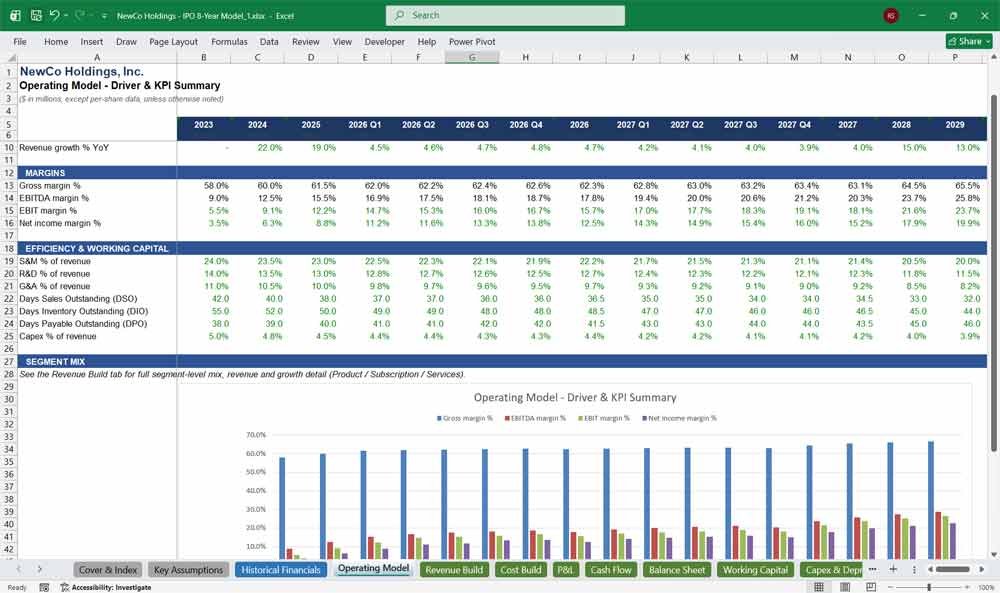
Operating Model
A single-page KPI and driver summary that condenses the entire eight-year operating plan — growth, margins, expense ratios, and working capital metrics — into one dashboard-style view, ideal for management reviews and board-level financial model presentations.
- One-page summary of every key operating driver
- Spans all 18 periods across the model
- Designed for management and board-level review
- No digging through build tabs required
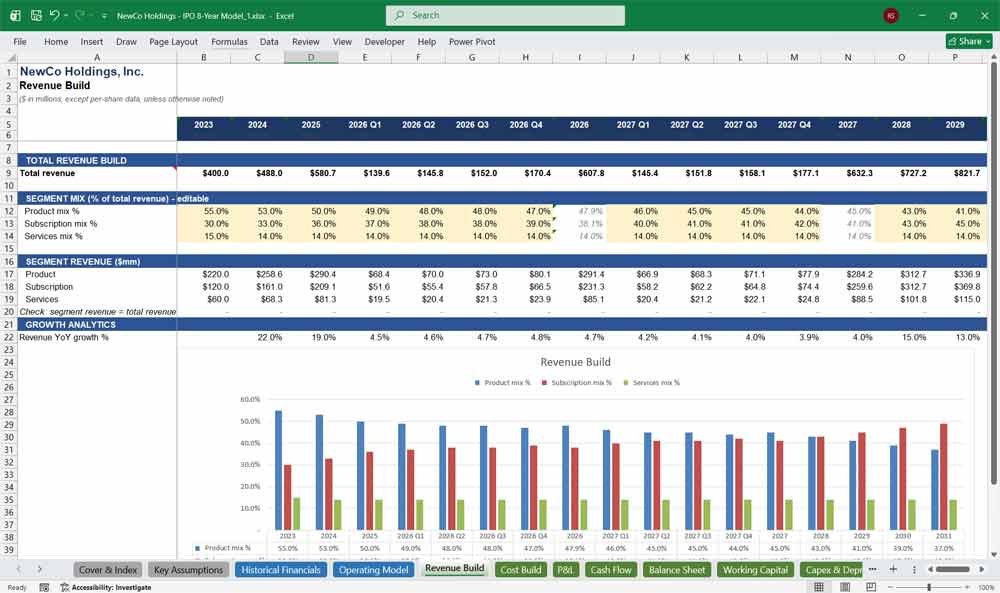
Revenue Build
A bottom-up revenue model with segment-level detail, seasonality-adjusted quarterly phasing, and editable growth assumptions — the engine behind every downstream number in this IPO financial model, from EBITDA to enterprise value.
- Bottom-up build across three illustrative revenue segments
- Seasonality-based quarterly phasing for 2026-2027
- Fully editable segment mix percentages
- Feeds every downstream P&L and valuation calculation
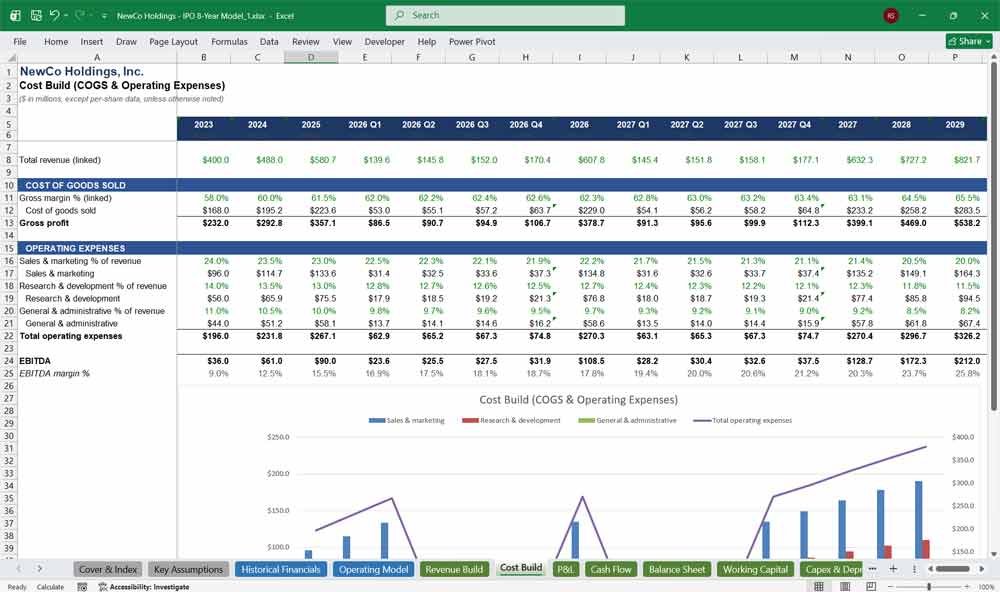
Cost Build
Converts margin and opex assumptions into dollar-based cost of goods sold and operating expenses, translating simple percentage inputs into a fully built cost structure that powers EBITDA and profitability across this financial modeling template.
- COGS, S&M, R&D, and G&A built from % of revenue
- Produces EBITDA and EBITDA margin every period
- Directly tied to Key Assumptions ratios
- Transparent, auditable cost-structure logic
P&L
A clean, presentation-ready consolidated income statement showing revenue through diluted EPS across all eight years — the summary output every investor, banker, and board member will look at first in this IPO-ready financial model.
- Revenue through diluted EPS in one clean statement
- Margin analytics at every subtotal
- Fully linked to all supporting schedules
- Presentation-ready for board decks and investor materials
Cash Flow
A complete operating, investing, and financing cash flow statement including the one-time IPO proceeds inflow, giving users a realistic view of liquidity and free cash flow generation before and after the public offering.
- Full operating, investing, and financing sections
- Captures the IPO’s one-time net proceeds inflow
- Calculates unlevered free cash flow for the DCF
- Ties directly to the balance sheet cash balance
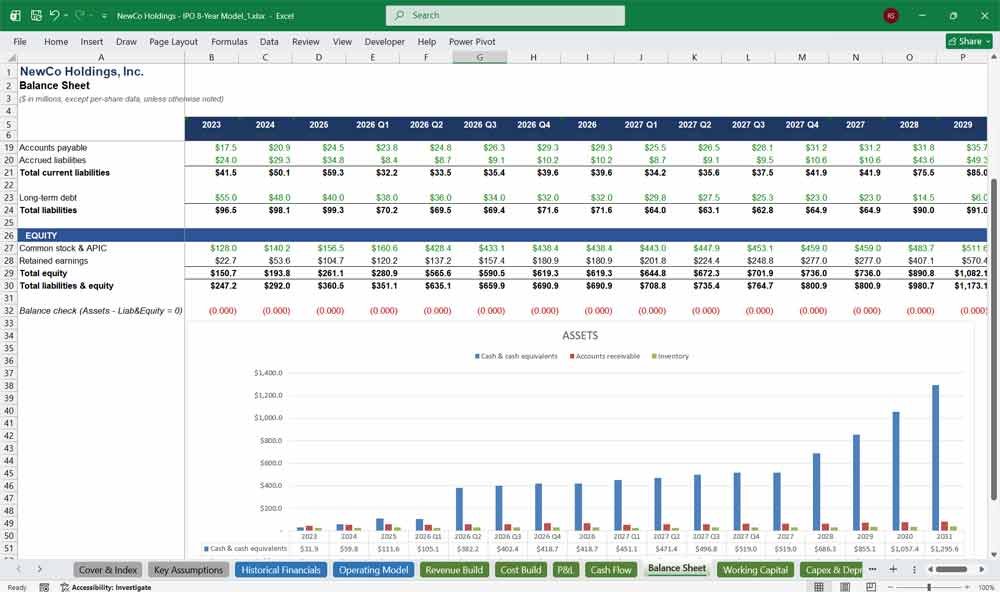
Balance Sheet
A fully balancing consolidated balance sheet built entirely from supporting schedules, proving out this IPO model’s integrity across all 18 periods — essential due-diligence credibility for any pre-IPO financial model shared with investors or auditors.
- Assets, liabilities, and equity fully linked from source schedules
- Balances to zero in every single period
- Includes a built-in balance check row
- Investor and auditor-ready structure
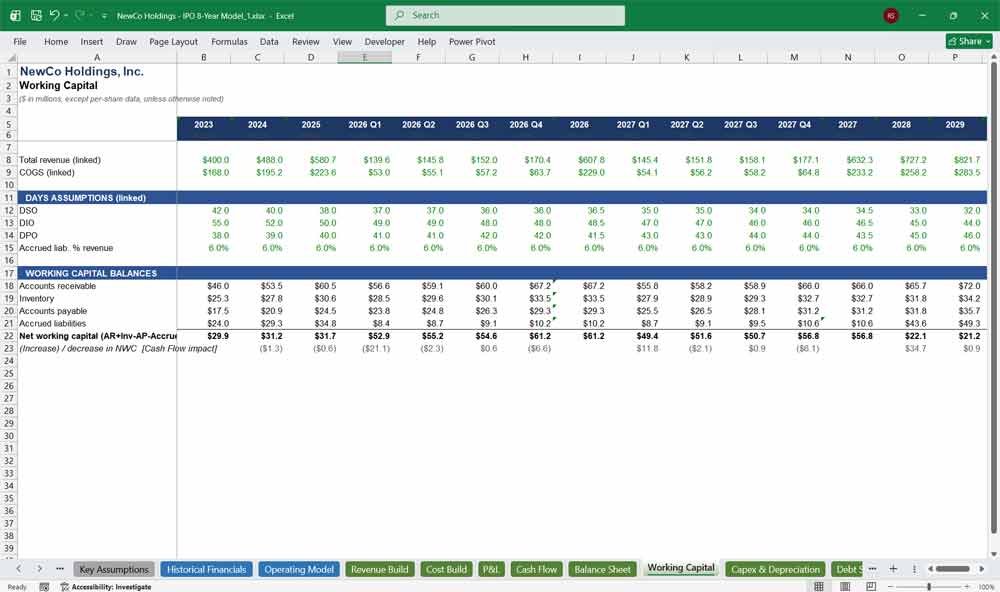
Working Capital
Models receivables, inventory, payables, and accrued liabilities using days-based assumptions, giving this financial model template the operational realism needed to project cash conversion accurately across an eight-year plan.
- DSO, DIO, and DPO-based working capital build
- Calculates net working capital every period
- Drives the cash flow statement’s NWC line
- Fully assumption-driven and editable
Capex & Depreciation
Builds capital expenditure as a percentage of revenue and rolls forward the PP&E balance with straight-line depreciation, giving this Excel financial model a clean, non-circular fixed asset schedule investors can trust.
- Capex modeled as % of revenue
- Straight-line PP&E roll-forward
- Avoids complex vintage-by-vintage capex schedules
- Ties exactly to the balance sheet
Debt Schedule
Tracks term loan balances, scheduled amortization, and interest expense using a non-circular, beginning-balance interest calculation — a critical, error-free feature for any IPO financial model shared with lenders or investors.
- Full debt roll-forward with amortization schedule
- Non-circular interest expense calculation
- Produces the net debt figure used in valuation
- Clean, transparent debt mechanics
Tax Schedule
Calculates pre-tax income, tax expense, and net income for every period, linking directly to historical actuals for FY2023-2025 so this IPO model’s tax treatment ties out exactly to what was reported.
- Full pre-tax income to net income build
- Historical periods link to reported actuals
- Interest income/expense fully integrated
- Feeds net income throughout the model
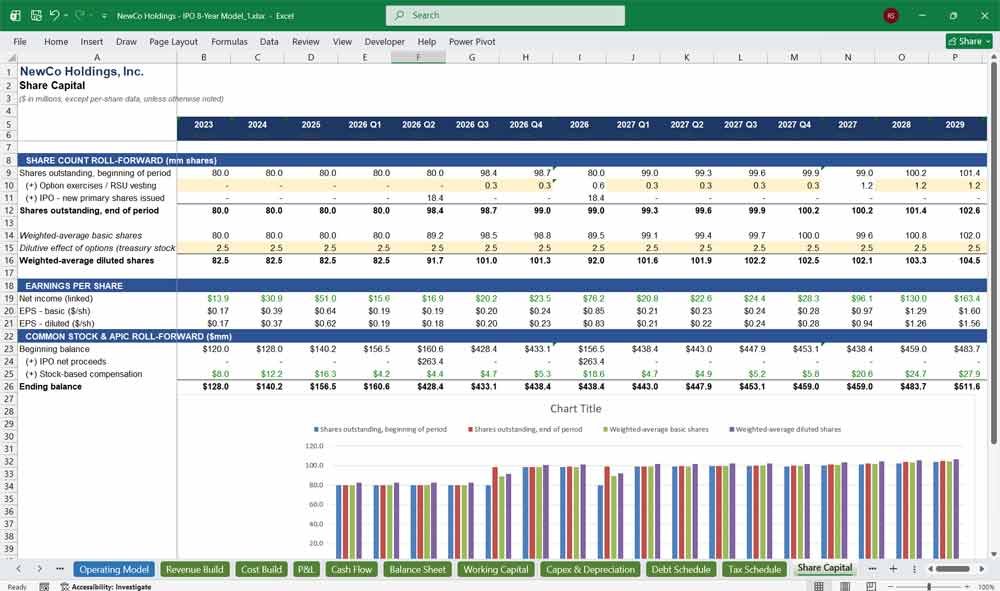
Share Capital
Rolls forward the fully diluted share count through option exercises and the IPO issuance itself, producing basic and diluted EPS — a must-have for any IPO valuation model calculating per-share value.
- Full share count roll-forward including the IPO issuance
- Basic and diluted EPS every period
- APIC roll-forward including SBC and IPO proceeds
- Feeds every per-share valuation metric
Stock-Based Compensation
Calculates SBC expense as a percentage of revenue with a functional allocation across COGS and opex lines, giving this financial modeling template the non-cash expense treatment public company investors expect to see.
- SBC modeled as % of revenue
- Allocated across COGS, S&M, R&D, and G&A
- Added back correctly on the cash flow statement
- Standard public-company SBC treatment
IPO Mechanics
IPO Assumptions
The control panel for the entire transaction — offer price range, share structure, fees, and use-of-proceeds splits — making this the most important tab in the whole IPO financial model template.
- Offer price low/mid/high range
- Pre-IPO shares, options, and greenshoe assumptions
- Underwriting discount and offering expense inputs
- Drives every other IPO-related tab
IPO Share Count
Converts the proceeds target and offer price into an actual post-IPO share count, including the over-allotment option — precise, transparent IPO share mechanics that belong in every credible IPO model.
- Primary share count derived from proceeds target and price
- Over-allotment (greenshoe) shares calculated automatically
- Secondary shares tracked separately as a memo item
- Produces total post-IPO shares outstanding
IPO Proceeds & Fees
Calculates gross proceeds, underwriting discount, and other offering expenses down to net proceeds to the company — the exact figure every finance team needs before modeling use of proceeds in an IPO.
- Gross-to-net proceeds waterfall
- Underwriting discount and offering expenses itemized
- Feeds cash flow, share capital, and use of proceeds
- Fully transparent fee methodology
IPO Cap Table
A clean pre- and post-IPO capitalization table showing founders, investors, option pool, and new public shareholders — essential reading for any investor evaluating dilution in an IPO financial model.
- Pre-IPO and post-IPO shareholder breakdown
- Share counts and ownership percentages calculated automatically
- Shows the option pool top-up impact
- Investor-ready cap table presentation
Dilution Analysis
Quantifies exactly how much existing shareholders are diluted by the offering, including the EPS impact — critical, board-level analysis for any company preparing for a public listing.
- Pre- and post-IPO fully diluted share counts
- Ownership dilution percentage calculated automatically
- EPS dilution impact on LTM net income
- Board-ready dilution summary
Use of Proceeds
Allocates net IPO proceeds across debt paydown, growth investment, and general corporate purposes with a built-in reconciliation check — the exact disclosure schedule investors expect in an IPO prospectus.
- Allocation across debt paydown, growth capex, and GCP
- Built-in check ties allocation to net proceeds
- Debt paydown capped at actual outstanding balance
- Prospectus-style disclosure format
Pro Forma Balance Sheet
Shows the balance sheet before and after the IPO side by side, isolating the transaction’s exact financial impact — a standard, expected exhibit in any professional IPO financial model.
- Pre-IPO, adjustments, and post-IPO columns
- Isolates the pure transaction impact
- Balances exactly with a built-in check
- Standard IPO prospectus-style presentation
IPO Model Valuation
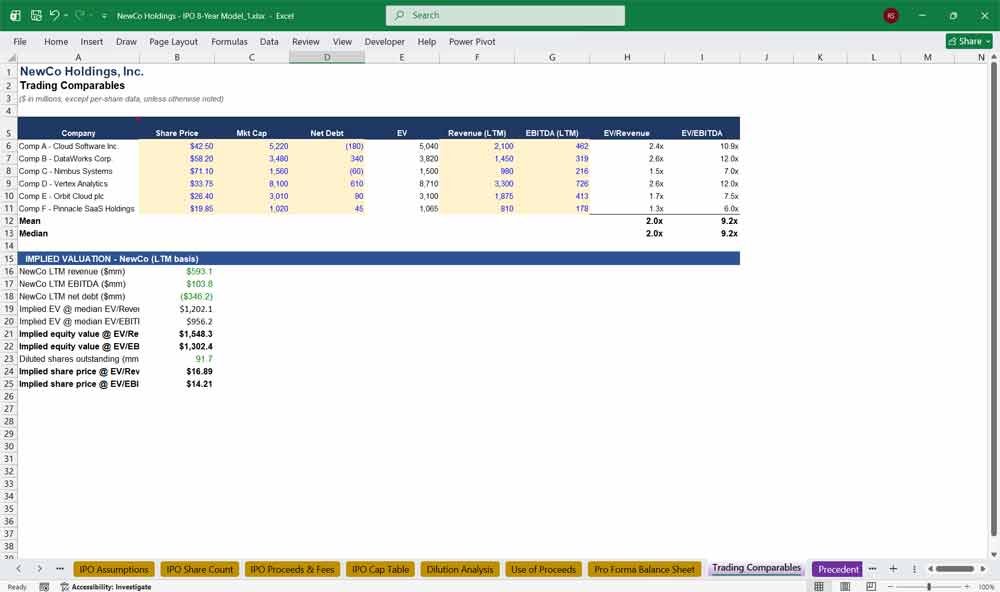
Trading Comparables
Benchmarks the company against public comparables using EV/Revenue and EV/EBITDA multiples, producing an independent, market-based valuation check within this IPO valuation model.
- Illustrative public comparable set with key multiples
- Mean and median multiples calculated automatically
- Implied enterprise and equity value output
- Implied per-share value calculation
Precedent Transactions
Applies historical M&A transaction multiples to the company’s LTM financials, giving this IPO model a control-premium-inclusive valuation cross-check alongside the DCF and trading comps.
- Illustrative precedent M&A transaction multiples
- Mean and median multiple calculations
- Implied enterprise and equity value output
- Complements trading comps with a control-premium lens
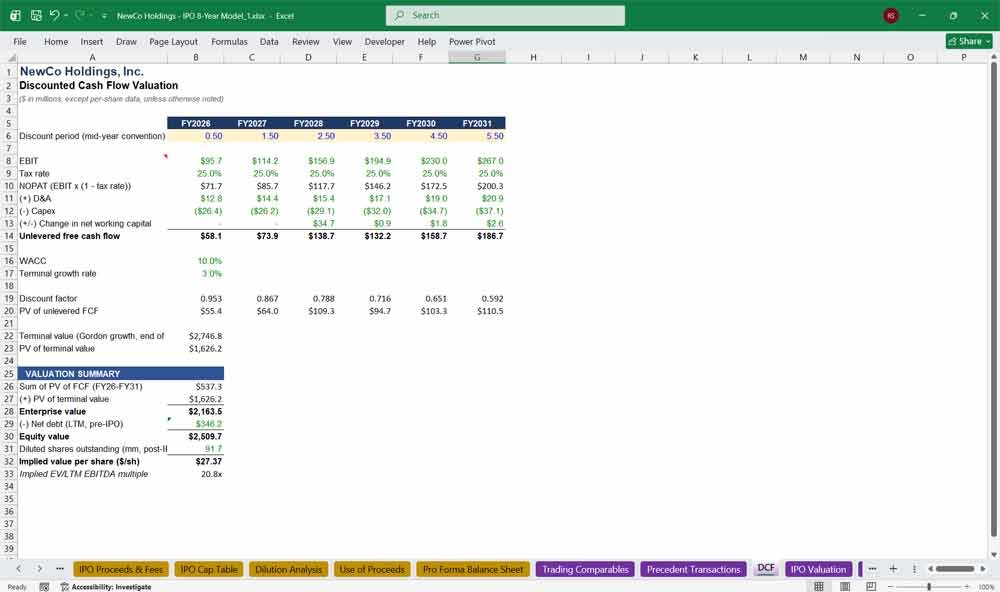
DCF
A full discounted cash flow valuation with mid-year convention and Gordon growth terminal value, giving this IPO financial model a rigorous, intrinsic-value-based share price estimate.
- Full unlevered free cash flow build through FY2031
- Mid-year discounting convention
- Gordon growth terminal value methodology
- Implied enterprise value, equity value, and share price
IPO Valuation
The valuation football field pulling DCF, trading comps, precedent transactions, and the actual offer price together — the single most important output tab for pricing an IPO.
- Football field comparing all valuation methodologies
- Implied multiples at the actual IPO offer price
- EV/Revenue, EV/EBITDA, and P/E all calculated
- Designed for banker and board presentations
Scenario Analysis
A bear/base/bull framework flexing growth and margin assumptions to show a realistic range of outcomes — exactly the kind of scenario planning investors expect before an IPO.
- Bear, base, and bull case comparison
- Flexes FY2031 growth and margin assumptions
- Recalculates implied share price for each case
- Self-contained, no circular scenario switches
Sensitivity Analysis
Two-way sensitivity grids testing valuation against WACC, terminal growth, revenue growth, and margin — giving this IPO model the stress-testing rigor institutional investors demand.
- WACC vs. terminal growth sensitivity grid (DCF)
- Growth vs. margin sensitivity grid (trading comps)
- Every cell independently recalculated
- 100% formula-driven, no macros required
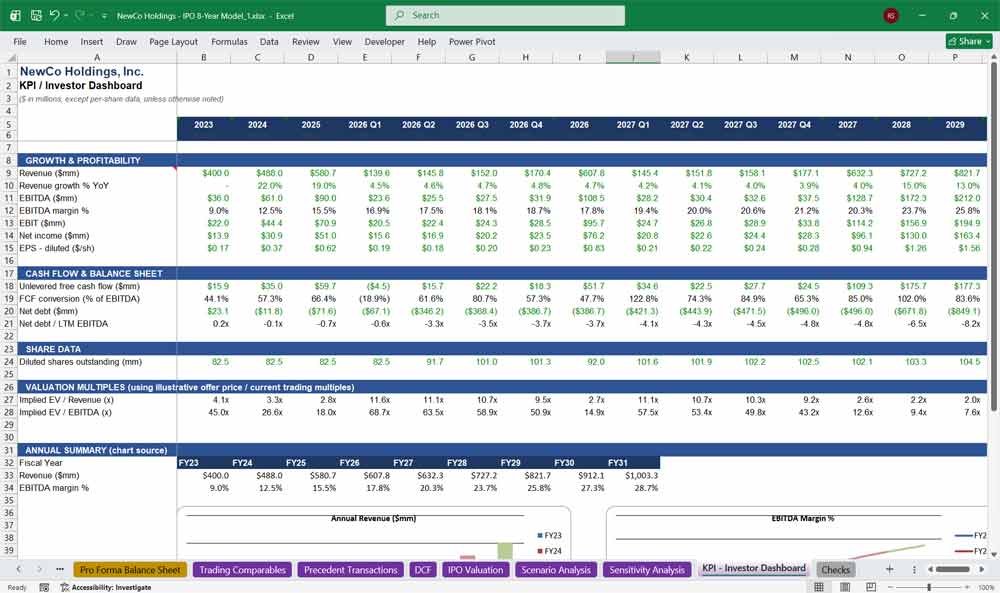
KPI / Investor Dashboard
A one-page investor-style summary of every key metric — growth, margins, FCF, leverage, and valuation multiples — plus charts, making this the most shareable tab in the entire financial model template.
- One-page summary of every critical KPI
- Includes revenue and EBITDA margin charts
- Covers growth, profitability, cash flow, and leverage
- Built for investor and board presentations
Checks
The model’s built-in quality assurance tab, confirming the balance sheet balances, the cap table ties out, and proceeds reconcile — giving buyers total confidence in this IPO financial model’s integrity.
- Balance sheet check across all 18 periods
- Cap table and share count reconciliation
- Use of proceeds and pro forma balance sheet checks
- Single “ALL CLEAR” status flag
Why Buy This Model
Building an IPO-ready financial model from scratch typically takes an experienced analyst several weeks — sourcing historical data, architecting a non-circular three-statement model, layering in IPO mechanics, and building out a defensible valuation section, all while making sure everything ties out perfectly under scrutiny. This template compresses that entire process into a single, ready-to-use Excel workbook: 30 fully linked tabs, three years of historical financials, five years of quarterly-then- annual projections, complete IPO share count and proceeds mechanics, a pre- and post-IPO cap table, dilution analysis, and a full valuation suite spanning DCF, trading comps, precedent transactions, scenario analysis, and sensitivity tables — all built on one central assumptions tab so the entire model updates instantly when you change a single input. Whether you’re a founder preparing for your first roadshow, a banker building a pitch, or an analyst modeling a peer’s upcoming listing, this template gives you a professional, audit-ready starting point instead of a blank spreadsheet — saving weeks of build time while reducing the risk of the formula errors and circular references that plague hand-built IPO models.
Initial Public Offering (IPO) Frequently Asked Questions
Is this model editable, or is it locked/protected?
Every assumption cell is fully editable and clearly color-coded in blue, so you can adjust growth rates, margins, IPO terms, or valuation inputs immediately. Nothing is locked or password-protected — you own the file and can modify it however your deal or business requires.
Does this work for any industry, or is it built for a specific sector?
The model is built with a generic SaaS/technology-style revenue and cost structure (three illustrative revenue segments, subscription-leaning mix shift) but every driver — margins, growth rates, working capital days, capex intensity — is fully assumption-driven, so it can be adapted to most industries by updating the Key Assumptions and Revenue Build tabs.
Can I change the IPO pricing date or offer price assumptions?
Yes. The IPO pricing date, offer price range, primary proceeds target, over-allotment percentage, and fee assumptions are all editable inputs on the IPO Assumptions tab, and every downstream tab — share count, proceeds, cap table, dilution, and valuation — recalculates automatically.
What version of Excel do I need to open this file?
The model is built as a standard .xlsx file compatible with Excel 2016 and later, Excel for Microsoft 365, and most spreadsheet applications that support formulas and charts, including Google Sheets (with minor formatting differences).
Does the model use any macros, add-ins, or third-party plugins?
No. The entire model is 100% native Excel formulas — no VBA macros, no add-ins, and no external plugins required. This means it opens safely in any environment, including locked-down corporate IT setups that block macros.
How do I know the model is actually error-free?
The workbook includes a dedicated Checks tab that independently verifies the balance sheet balances, the cap table reconciles to the share count, and the use of proceeds ties to net proceeds — across all 18 periods — with a single “ALL CLEAR” status flag you can check at any time after making changes.
Can I extend the model beyond eight years or add more historical years?
Yes, though it requires some manual extension work — inserting additional columns following the same formula pattern used across the existing periods. The model’s consistent, formula-driven architecture (rather than hardcoded values) makes this significantly easier than extending a typical hand-built spreadsheet.
Is this suitable for an actual live IPO, or just for internal planning?
This template is designed as a robust starting framework for internal planning, board presentations, and pre-IPO valuation exercises. For an actual live offering, your investment bank and legal counsel will need to adapt it with company-specific data, audited financials, and deal-specific structuring — but this model gives you a professional foundation that dramatically shortens that process.
Does it include a DCF and comparable company analysis, or do I need to build those separately?
Both are fully built in. The DCF tab includes a complete unlevered free cash flow projection with terminal value, and the Trading Comparables and Precedent Transactions tabs are ready to accept your own comp set — all three feed directly into the IPO Valuation football field tab.
Will changing one assumption break the rest of the model?
No. The model is architected around a single Key Assumptions tab that feeds every other tab through live formulas, specifically to avoid the broken links and manual re-entry errors common in hand-built models. Changing one input — a growth rate, an IPO price, a tax rate — flows through automatically to the P&L, balance sheet, cap table, and valuation output.
Value Your initial public offering (IPO) With A DCF
A full discounted cash flow build over the FY2026–FY2031 forecast horizon: unlevered free
cash flow (post-tax EBIT plus D&A, less capex and the change in net working capital),
discounted at the WACC using mid-year convention, with a Gordon growth terminal value
appended at the end of the explicit forecast period. The tab concludes with implied
enterprise value, equity value, and value per share.investment support.
Further Reading
Merger & Acquisitions Model: Download a professional M&A financial model. Dynamic valuation, accretion/dilution analysis, synergies, and debt schedules.
- LBO Model: Ready to master corporate finance? Download our proven, step-by-step LBO financial model template to analyze leveraged buyouts, project debt paydown, and forecast returns like a seasoned private equity professional.