
LBO Financial Model Excel Template
10 Year LBO Financial Model Excel Template covering the Income Statement, Cash Flow Statement, and Balance Sheet. Cost structures, Entry Valuation, Capital Structure, Transaction Fees, Refinancing/Rollover, Revenue Growth & Margins and other financial statements to forecast the health of your Leveraged Buyout (LBO) Financing.
This 10-Year Leveraged Buyout (LBO) financial model
An advanced quantitative framework used by private equity investors to evaluate the long-term viability, cash generation profile, and potential returns of acquiring a company using a significant amount of borrowed money.
Extending the forecast horizon from the traditional 5 years to 10 years requires rigorous long-term strategic assumptions, capturing multiple economic cycles, potential add-on acquisitions, structural deleveraging, and significant operational transformations.
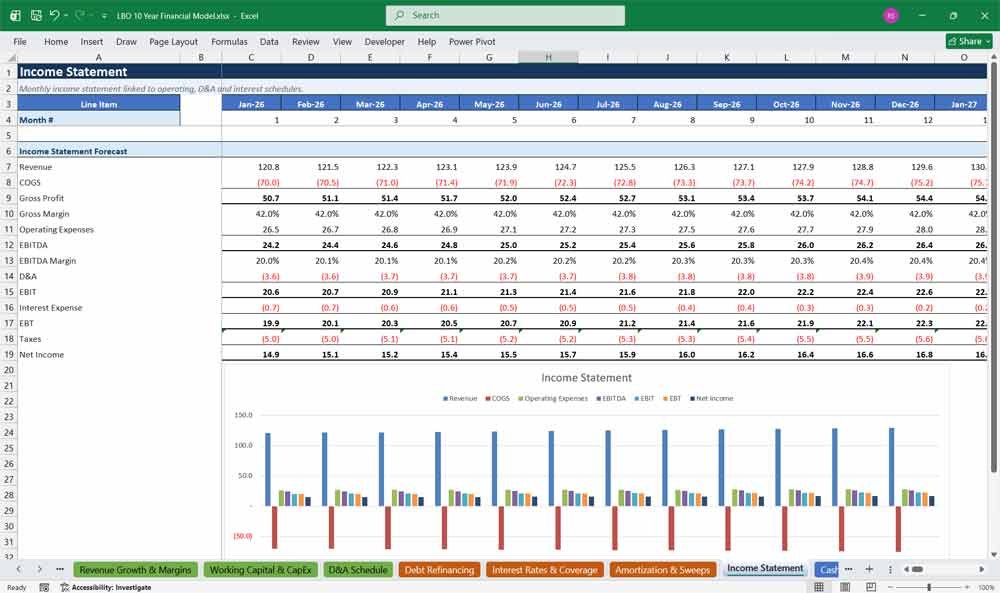
Income Statement (10-Year Structure)
Revenue: Modeled across Years 1 through 10 by multiplying volume and pricing drivers or applying tiered organic/inorganic growth rates.
Cost of Goods Sold (COGS): Direct variable and fixed production costs, scaling proportionally with revenue or benefiting from modeled long-term efficiencies.
Gross Profit: Calculated as Revenue minus COGS, establishing the baseline unit profitability.
Selling, General & Administrative (SG&A): Operating overhead, administrative salaries, and corporate expenses projected with fixed and variable cost components.
EBITDA: Earnings Before Interest, Taxes, Depreciation, and Amortization, representing core operational cash generation before accounting policies and capital structures.
Depreciation & Amortization (D&A): Non-cash charges derived from historical asset bases, annual capital expenditures, and intangible purchase price allocations.
EBIT (Operating Income): Calculated as EBITDA minus D&A.
Interest Expense: Total periodic interest incurred across all debt tranches (Senior Secured, Subordinated, PIK notes), adjusted annually for paydowns and refinancing events.
EBT (Earnings Before Taxes): Calculated as EBIT minus Interest Expense (and factoring in any financing fee amortizations).
Income Tax Expense: Calculated by applying the statutory corporate tax rate to EBT, accounting for non-deductible expenses where applicable.
Net Income: Bottom-line net earnings carried forward to fund retained earnings and influence cash flow adjustments.
Leveraged Buyout (LBO) Cash Flow Statement
Operating Activities:
Starts with Net Income.
Non-Cash Adjustments: Adds back Depreciation & Amortization and deferred financing fee amortization.
Working Capital Changes: Accounts for annual changes in Accounts Receivable, Inventory, Accounts Payable, and Accrued Liabilities (sources and uses of cash).
Net Cash from Operations: Total cash generated from core business operations.
Investing Activities:
Capital Expenditures: Outflows for maintenance and growth CapEx across Years 1 through 10.
M&A / Add-on Acquisitions: Modeled cash outflows for bolt-on acquisitions executed during the hold period.
Net Cash from Investing: Total capital deployed into long-term assets.
Financing Activities:
Debt Issuance / Repayment: Inflows from initial debt raised, minus outflows for mandatory amortization and optional cash sweep prepayments.
Equity Issuance / Dividends: Initial sponsor equity check, subsequent dividend recapitalizations (if modeled), and final exit distributions.
Net Cash from Financing: Total cash flows associated with capital structure adjustments.
Net Change in Cash: Sum of cash flows from Operating, Investing, and Financing activities, reconciling to the ending cash balance on the Balance Sheet.
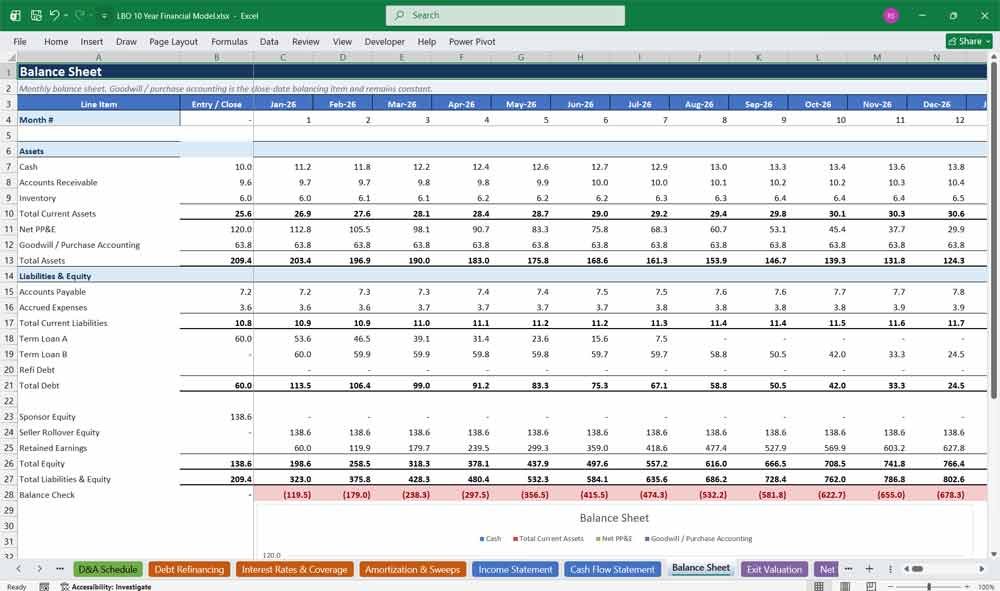
Leveraged Buyout (LBO) Balance Sheet
Current Assets:
Cash & Cash Equivalents: Ending cash balance reconciled from the Cash Flow Statement.
Accounts Receivable & Inventory: Operating current assets projected via working capital metrics (DSO, DIO).
Non-Current Assets:
Property, Plant, and Equipment (PP&E): Opening PP&E plus CapEx minus Depreciation.
Intangible Assets & Goodwill: Initial purchase price allocation items adjusted for ongoing amortization.
Current Liabilities:
Accounts Payable & Accrued Expenses: Operating current liabilities projected via working capital metrics (DPO).
Current Portion of Long-Term Debt: Mandatory annual principal repayments due within the next 12 months.
Non-Current Liabilities:
Long-Term Debt: Outstanding balances across Term Loans, Senior Notes, and other debt tranches net of current maturities and unamortized debt issuance costs.
Deferred Tax Liabilities: Resulting from asset write-ups and depreciation timing differences.
Shareholders’ Equity:
Common Stock / Paid-in Capital: Initial sponsor equity contribution and management rollover value.
Retained Earnings: Cumulative net income generated across the 10-year period, minus any dividends paid.
Total Liabilities and Equity: Balances perfectly with Total Assets in each forecast year to ensure accounting integrity.
Other Tabs Within The LBO Model
1. Entry Valuation
The entry valuation establishes the baseline purchase price for the target company, serving as the anchor for the entire transaction structure.
Valuation Multiples: Typically anchored to Last Twelve Months (LTM) or Forward Enterprise Value to EBITDA ($EV / EBITDA$) multiples, or derived via a standalone Discounted Cash Flow (DCF) analysis.
Purchase Price Calculation: Calculated as Entry Multiple multiplied by LTM EBITDA. Adjustments are made for cash, existing debt, and non-operating assets to bridge Enterprise Value (EV) to Equity Value (Purchase Price for equity).
Control Premium: In public-to-private transactions, a control premium (e.g., 20% to 30% over the undisturbed share price) is factored into the initial equity purchase price.
2. LBO Capital Structure
The capital structure defines how the total uses of funds (purchase price, refinancing of existing debt, transaction fees) are funded by sources (sponsor equity and various tranches of debt).
Debt Tranches: Composed of a mix of senior secured bank debt (Term Loan A / B), unsecured notes (Senior Notes), and sometimes mezzanine debt or shareholder PIK (Payment-in-Kind) notes.
Sponsor Equity Check: Represents the remaining funding gap between total uses and total debt raised, typically comprising 30% to 50% of the total sources.
Leverage Ratios: Expressed as Total Debt-to-EBITDA (e.g., $5.5\times$ to $7.0\times$ total leverage) and Senior Debt-to-EBITDA to assess risk and debt service capacity.
3. Transaction Fees
Transaction fees account for the professional, legal, and financial advisory costs associated with executing the LBO.
Advisory & Legal Fees: Investment banking, M&A legal counsel, and strategic consulting fees, typically expensed immediately on the income statement or capitalized depending on accounting standards.
Financing Fees (Debt Issuance Costs): Upfront fees paid to lenders and underwriting banks for securing debt facilities. These are capitalized on the balance sheet as a contra-liability and amortized over the life of the respective debt tranches using the effective interest method.
Sponsor/Management Fees: Ongoing advisory or monitoring fees paid to the private equity sponsor, often modeled as a fixed annual percentage or dollar amount.
4. LBO Refinancing / Rollover
Refinancing and rollover assumptions dictate how existing capital obligations and stakeholders are treated at the transaction close.
Existing Debt Refinancing: Target company debt existing prior to the acquisition is typically paid off and replaced by the new LBO capital structure, though certain low-cost instruments may occasionally be assumed.
Management Rollover: Existing management often rolls a portion of their vested equity or option proceeds into the new holding company structure to align incentives with the private equity sponsor.
Transaction Accounting: Goodwill and identifiable intangible assets are re-valued based on purchase price allocation (PPA), resetting the target’s balance sheet to fair value.
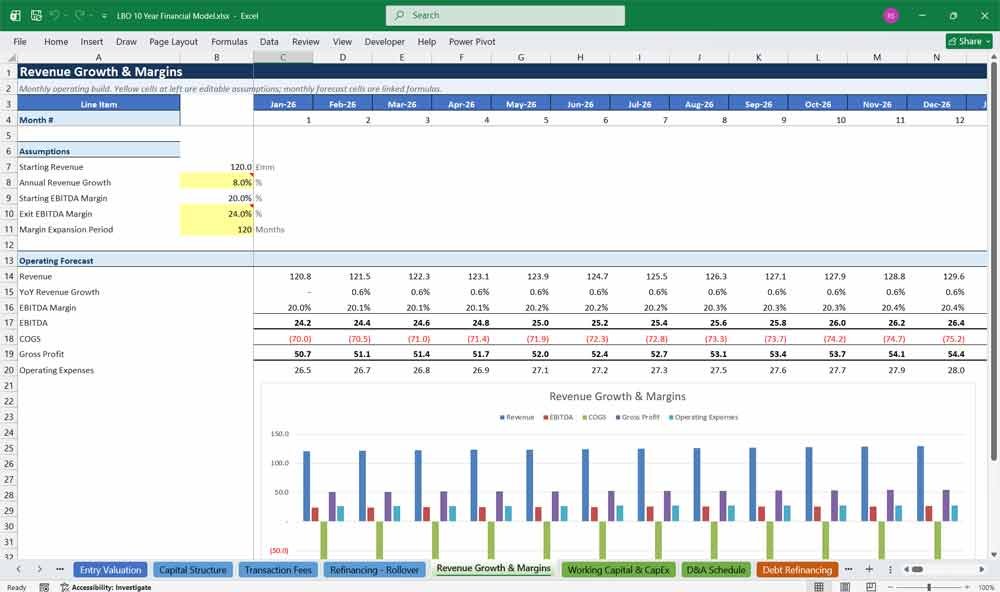
5. Revenue Growth & Margins
The operational engine of the 10-year model, driving the cash flows required to service and pay down high debt loads.
Top-Line Projections: Segmented into volume and price drivers, organic growth rates, and any anticipated add-on acquisitions over the 10-year window.
Cost of Goods Sold (COGS) & Gross Margin: Modeled based on direct material, labor, and overhead efficiencies, accounting for long-term inflation and scale economies.
Operating Expenses (OpEx): SG&A expenses, marketing, and research & development, evaluated for operating leverage as the business scales over the decade.
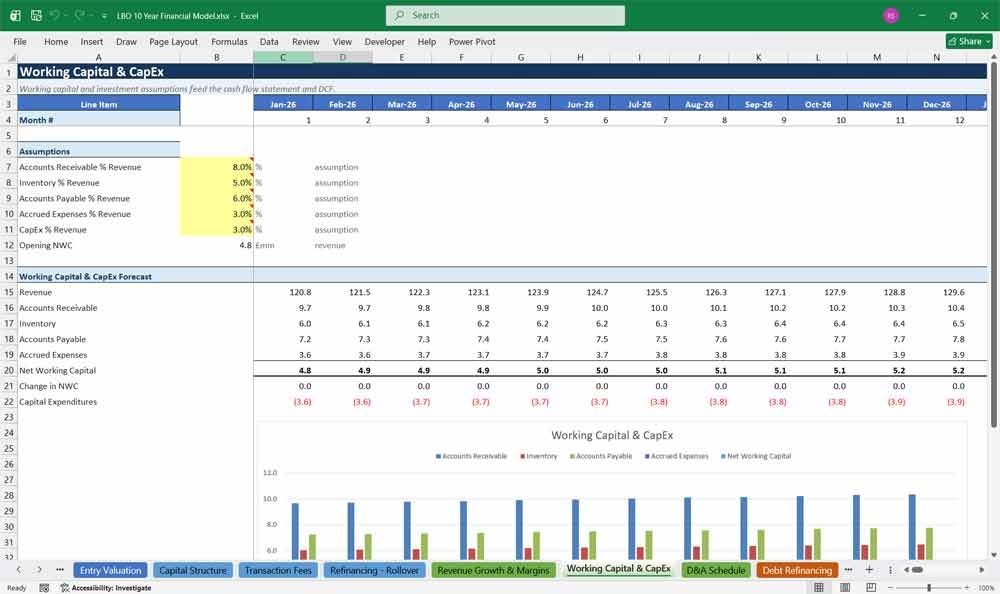
6. LBO Working Capital & CapEx
Working capital and capital expenditures determine the conversion of operating profit into actual cash available for debt service.
Net Working Capital (NWC): Modeled using operational drivers such as Days Sales Outstanding (DSO), Days Inventory Outstanding (DIO), and Days Payable Outstanding (DPO), or as a percentage of revenue/COGS to capture cash locked in operations.
Maintenance CapEx: Essential capital expenditures required to sustain current operations, typically modeled as a percentage of revenue or depreciation-matched.
Growth CapEx: Discretionary investments in new capacity, technology, or facilities designed to fuel the 10-year growth thesis.
7. Depreciation & Amortization (D&A)
Non-cash expenses that reduce taxable income while shielding cash flows.
Property, Plant, and Equipment (PP&E): Depreciated using straight-line or accelerated methods over estimated useful lives, incremented annually by capital expenditures and reduced by asset retirements.
Intangible Assets: Resulting from purchase price allocation (e.g., customer relationships, technology, trademarks) and amortized over their designated useful lives (often 5 to 15 years).
Tax Shield Impact: D&A lowers operating income (EBIT) and taxable income, resulting in cash tax savings that directly boost free cash flow.
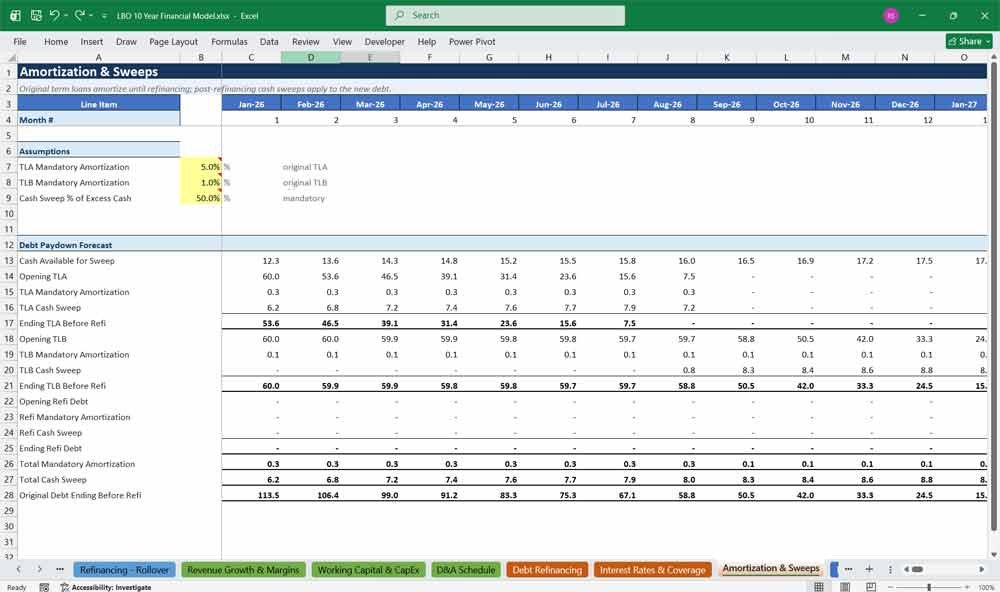
8. Mandatory Amortization & Cash Sweeps
The mechanisms governing how operating cash flow is systematically utilized to pay down debt obligations over the 10-year period.
Mandatory Amortization: Fixed contractual principal repayments required each year (e.g., 1% per annum for Term Loan B, or higher schedules for Term Loan A).
Cash Flow Sweeps: Provisions requiring a specified percentage (e.g., 50% to 75%) of Excess Cash Flow (ECF) to be mandatorily applied toward prepaying senior debt tranches ahead of schedule.
Deleveraging Trajectory: Over a 10-year model, these mechanisms typically result in substantial debt reduction, shifting enterprise value capture from debt holders to equity holders.
9. Leveraged Buyout (LBO) Debt Refinancing
Given the 10-year duration of the model, intermediate debt maturities must be addressed.
Bullet Maturities & Tranche Lifespans: Most institutional term loans and notes have 5- to 7-year maturities. Tranches maturing within the 10-year window (e.g., around Year 5 or 6) must be modeled as refinanced.
Refinancing Assumptions: Modeled with updated market interest rates, potential refinancing fees, and adjusted leverage multiples reflecting the company’s deleveraged financial profile at that future date.
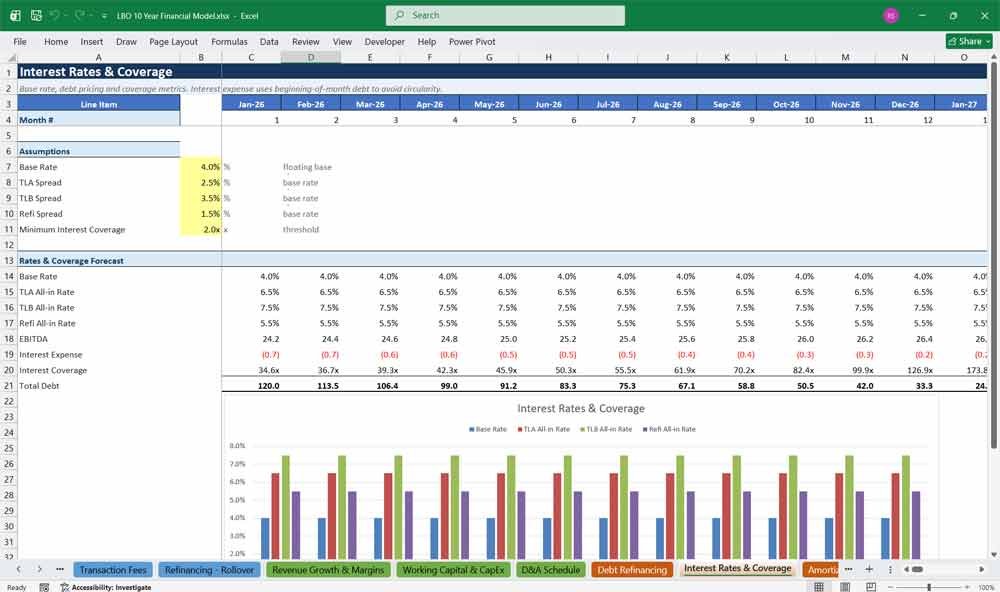
10. Interest Rates & Coverage
Measures the company’s financial risk profile and its capacity to service debt obligations.
Interest Rate Mechanics: Separation of base rates (such as SOFR) and credit spreads, incorporating potential interest rate hedges (caps, swaps) to mitigate macro volatility over the decade.
Coverage Ratios:
Interest Coverage Ratio (EBITDA / Interest Expense): Tracks the buffer between operating earnings and annual interest obligations.
Fixed Charge Coverage Ratio (EBITDA – CapEx – Taxes / Interest + Mandatory Principal): Evaluates total cash commitments relative to operating cash generation.
11. Exit Valuation
Determines the projected value of the company at the end of Year 10 upon monetization.
Exit Multiple Selection: Usually benchmarked against entry multiples, historical industry norms, and long-term sector growth expectations (often adjusted downward or held flat relative to entry for conservatism).
Enterprise Value at Exit: Calculated as Exit Year EBITDA multiplied by the Exit Multiple.
Exit Horizon Impact: A 10-year hold allows the business to cycle through macro downturns and institutionalize major operational improvements, often commanding strong strategic or secondary buyout valuations.
12. Net Debt at Exit
Calculates the residual debt claims remaining against the enterprise value at the end of the 10-year hold period.
Ending Gross Debt: Total outstanding balances across all remaining debt tranches after 10 years of mandatory amortization, cash sweeps, and potential refinancing cycles.
Cash & Cash Equivalents: Projected balance of cash retained on the balance sheet for ongoing operations.
Net Debt Formula: Calculated as Total Gross Debt minus Cash & Cash Equivalents, which is subtracted from Enterprise Value to arrive at ending Equity Value.
13. Return Metrics
Quantifies the financial reward generated for the private equity sponsor and management team over the investment lifecycle.
Internal Rate of Return (IRR): The annualized compound growth rate of the initial equity investment based on cash flows received during the hold and the final equity proceeds at exit.
Multiple on Invested Capital (MOIC / Cash-on-Cash): Total cash returned to the sponsor (including any dividend recapitalizations) divided by the initial equity check.
Sensitivity Analysis: Evaluates IRR and MOIC variations across a matrix of different Exit Multiples and Revenue/EBITDA growth scenarios.
14. Discounted Cash Flow (DCF)
Provides an intrinsic valuation cross-check and alternative methodology to validate the LBO model outputs.
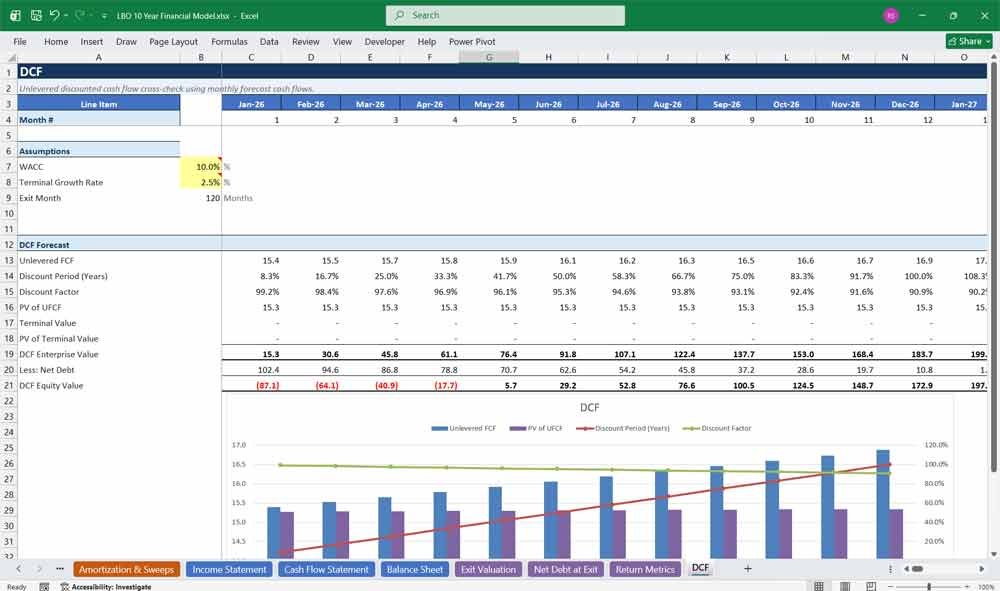
Free Cash Flow to Firm (FCFF): Projected unlevered free cash flows for each of the 10 years, calculated as EBIT adjusted for taxes, plus D&A, less changes in net working capital and capital expenditures.
Weighted Average Cost of Capital (WACC): The discount rate reflecting the blended cost of debt and equity capital weighted by their relative market proportions.
Terminal Value: Calculated using either the Gordon Growth Model (perpetuity growth rate) or Exit Multiple method, discounted back to present value alongside the 10-year explicit forecast period to determine intrinsic enterprise value.
Value Your Leveraged Buyout (LBO) With A DCF
LBO Discounted Cash Flow (DCF): Mapping the “Horizon”
10-year Discounted Cash Flow (DCF) model extends the standard valuation horizon to evaluate a company’s intrinsic value over a full economic cycle, projecting unlevered free cash flows year-by-year before discounting them back to present value. In a leveraged buyout context, this long-term DCF serves as a vital cross-check against the sponsor’s target returns, ensuring that the purchase price paid upfront is justified by the cumulative fundamental cash generation capacity of the business rather than relying solely on financial engineering and leverage.
WACC: The “Blend Of Debt And Equity”
The Weighted Average Cost of Capital (WACC) represents the blended rate of return required by all capital providers—both debt and equity—weighted by their relative proportions in the company’s capital structure. Because LBO capital structures feature exceptionally high debt loads that shift over time as mandatory repayments and cash sweeps deleverage the business, calculating WACC requires dynamic adjustments to account for the shifting tax-shield benefits of debt and changing cost of equity profiles across the 10-year forecast perio
Final Notes on the 10 Year Financial Model Integration
This structured model helps Leveraged Buyout (LBO) investors have a broad market spectrum, offering the right balance between cost, and investment support.
Further Reading
Merger & Acquisitions Model: Download a professional M&A financial model. Dynamic valuation, accretion/dilution analysis, synergies, and debt schedules.
- Real Estate Private Equity Fund Financial Projection Model: Professional-grade Real Estate Private Equity (REPE) fund financial model in Excel.