
Merger & Acquisitions Financial Model Excel Template
This 5-Year, 3-Statement periodicity of months Merger & Acquisitions Financial Model Excel Template includes Transaction Assumptions, Purchase Price Allocation & Goodwill, Synergies & Integration Costs, and financial statements to forecast the financial health of your Mergers & Acquisitions.
5 Year Financial Model for a Merger & Acquisitions
Very extensive 5 Year financial models involve detailed revenue projections, cost structures, capital expenditures, and financing needs. The models provide a thorough understanding of the financial viability, profitability, and cash flow position.
Transaction Assumptions
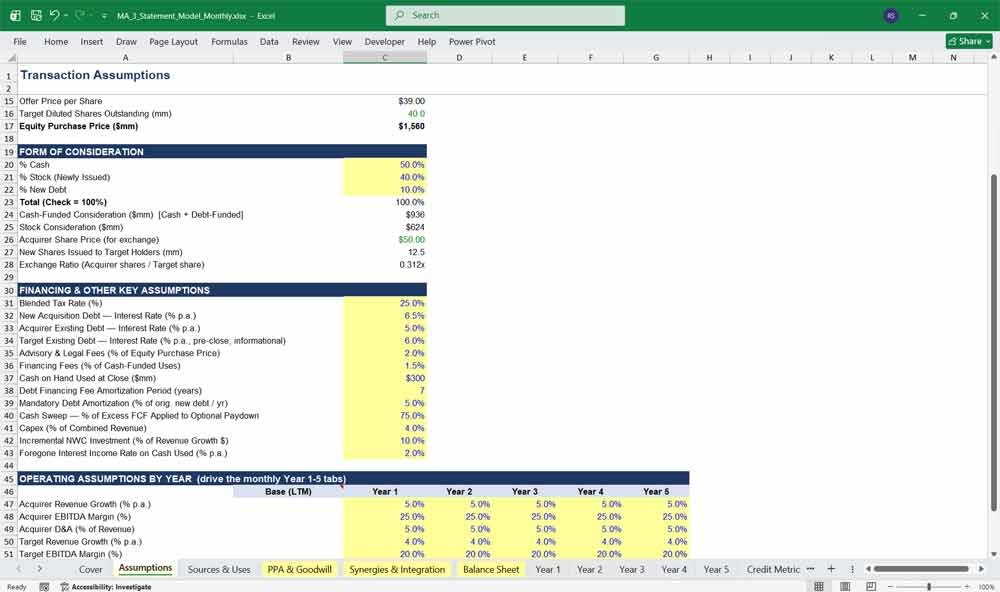
The transaction assumptions establish the fundamental parameters and mechanics of the M&A model at the closing date (Day 1). These metrics govern the valuation, the capital structure, and the baseline accounting adjustments required to consolidate the target company into the acquirer.
Valuation & Purchase Price: The headline purchase price is structured around a negotiated Enterprise Value (EV), typically derived as a multiple of the target’s trailing twelve months (TTM) or forward-looking EBITDA (e.g., 10.0x – 12.0x EBITDA). Equity Value is calculated by starting with Enterprise Value, adding cash, and subtracting existing debt, non-controlling interests, and unfunded pension liabilities, while adjusting for normalized working capital.
Transaction Fees: Investment banking advisory fees, legal fees, accounting and due diligence costs, and printing/regulatory filing fees are typically expensed immediately on the Income Statement (under post-tax transaction costs for certain jurisdictions, or capitalized/expensed depending on standard accounting treatment such as US GAAP ASC 805, where transaction costs are expensed as incurred). Financing fees (underwriting and commitment fees) are capitalized and amortized over the life of the debt.
Ownership Structure & Projections Timeline: The model runs on a discrete 5-year forecast horizon. Assumptions specify whether the transaction is an asset purchase (which often provides tax-deductible goodwill amortization) or a stock purchase (tax-free goodwill), as well as the acquirer’s marginal corporate tax rate.
Income Statement
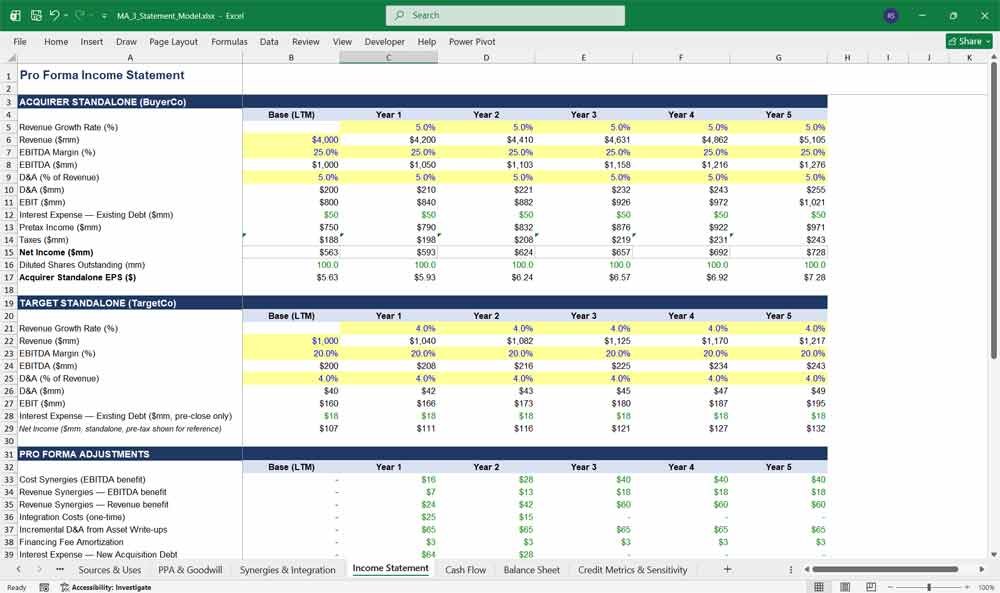
The Pro Forma Income Statement combines the standalone forecasts of the acquirer and target, layered with post-transaction adjustments over the 5-year period.
Revenue: Combined pro forma top-line revenue, incorporating organic growth projections plus phased-in revenue synergies.
Cost of Goods Sold (COGS) & Gross Profit: Combined gross margins adjusted for procurement synergies and manufacturing efficiencies.
Operating Expenses (SG&A): Combined SG&A expenses reduced progressively as cost synergies are fully realized, offset by initial integration and restructuring expenses in Years 1 and 2.
EBITDA: Consolidated operating earnings prior to D&A adjustments.
Depreciation & Amortization (D&A): Base D&A plus incremental D&A resulting from the write-up of PP&E and the amortization of newly created finite-lived identifiable intangibles from the PPA.
EBIT (Operating Income): EBITDA minus total D&A.
Interest Expense: Combined legacy interest expenses plus new interest expense incurred from debt raised to finance the acquisition, minus interest income on redeployed cash balances, adjusted for mandatory and optional debt paydowns over the 5-year schedule.
Pre-Tax Income (EBT): EBIT minus net interest expense.
Taxes: Combined pre-tax income multiplied by the pro forma marginal tax rate, accounting for tax-deductible interest and the non-deductibility of certain transaction costs or goodwill.
Net Income: Bottom-line earnings available to common shareholders, serving as the basis for Pro Forma Earnings Per Share (EPS) accretion/dilution analysis.
Mergers & Acquisitions Cash Flow Statement
The Cash Flow Statement determines whether the combined company generates sufficient cash to service debt, fund operations, execute the integration, and potentially repay acquisition financing.
It should be fully linked to the Income Statement and Balance Sheet.
Cash Flow from Operations
The operating cash flow section should begin with net income and adjust for non-cash items.
Typical adjustments include:
- Depreciation.
- Amortization.
- Stock-based compensation.
- Deferred taxes.
- PPA-related non-cash expenses.
- Other non-cash charges.
The model should then incorporate changes in operating working capital.
Working Capital
Important working-capital assumptions include:
- Accounts receivable days.
- Inventory days.
- Accounts payable days.
- Accrued expenses.
- Deferred revenue.
- Other operating current assets.
- Other operating current liabilities.
The target’s working-capital profile should be modeled separately before the transaction and then integrated into the combined-company forecast.
Cash Flow from Investing
Investing cash flow generally includes:
- Capital expenditures.
- Acquisitions of other businesses.
- Proceeds from asset sales.
- Other investing activities.
The acquisition itself normally appears in the transaction mechanics rather than recurring operating cash flow, but the model should clearly distinguish the initial transaction from future acquisitions.
Cash Flow from Financing
Financing cash flows should include:
- New acquisition debt.
- Revolver borrowings.
- Debt repayments.
- Mandatory amortization.
- Optional debt repayment.
- Equity issuance.
- Dividends.
- Share repurchases.
- Financing fees.
Free Cash Flow
A key output should be free cash flow available for debt repayment.
A typical conceptual calculation is:
Free Cash Flow = EBITDA − Cash Interest − Cash Taxes − Capital Expenditures − Change in Operating Working Capital − Other Cash Items
The exact definition should remain consistent throughout the model.
Cash Sweep and Debt Paydown
If the transaction is highly leveraged, the model should determine how excess cash is applied.
For example:
- Maintain minimum cash.
- Fund required capital expenditures.
- Pay mandatory debt amortization.
- Repay revolver balances.
- Apply excess cash to term debt.
- Potentially repay other debt according to the transaction’s financing terms.
This creates an important circular relationship between cash generation, debt balances, and interest expense. The model should use a clearly defined methodology to handle any circularity.
Mergers & Acquisitions Balance Sheet
The Pro Forma Balance Sheet represents the combined financial position of the merged entity on Day 1 (post-closing adjustments) and projects its evolution across the 5-year forecast window.
Assets:
Cash & Cash Equivalents: Opening cash adjusted for transaction uses and sources, plus cumulative annual net cash flows.
Accounts Receivable & Inventory: Combined working capital balances adjusted for target adjustments.
Property, Plant, & Equipment (PP&E): Combined historical net PP&E stepped up by fair market value adjustments, minus ongoing depreciation.
Goodwill & Intangibles: Newly recognized Goodwill from PPA plus unamortized balance of identifiable intangibles, reduced annually by accumulated intangible amortization.
Liabilities:
Accounts Payable & Accrued Expenses: Combined operating current liabilities.
Total Debt: Initial new debt raised plus legacy debt retained, reduced each year by mandatory and optional principal repayments based on the debt schedule.
Deferred Tax Liabilities (DTL): Created via asset write-ups, amortized down over time as the underlying assets are depreciated/amortized for tax purposes.
Shareholders’ Equity:
Common Stock & Additional Paid-In Capital (APIC): Acquirer equity plus any new equity issued for the transaction, adjusted for stock-based compensation.
Retained Earnings: Beginning retained earnings plus cumulative pro forma net income minus dividends paid over the 5-year period.
Check Rule: Total Assets must equal Total Liabilities plus Shareholders’ Equity in every forecast year.
Key Financial Metrics for Mergers & Acquisitions
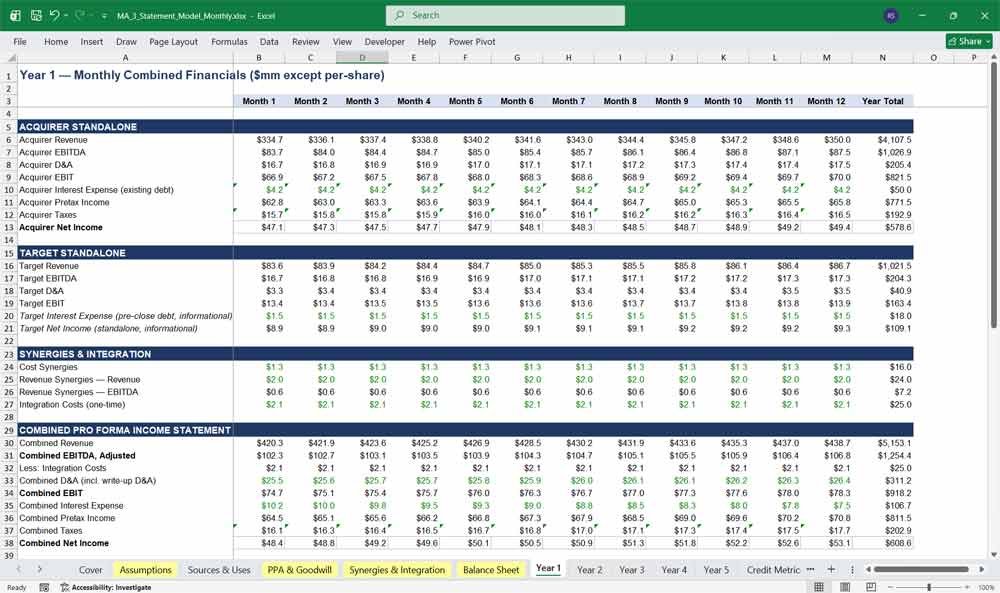
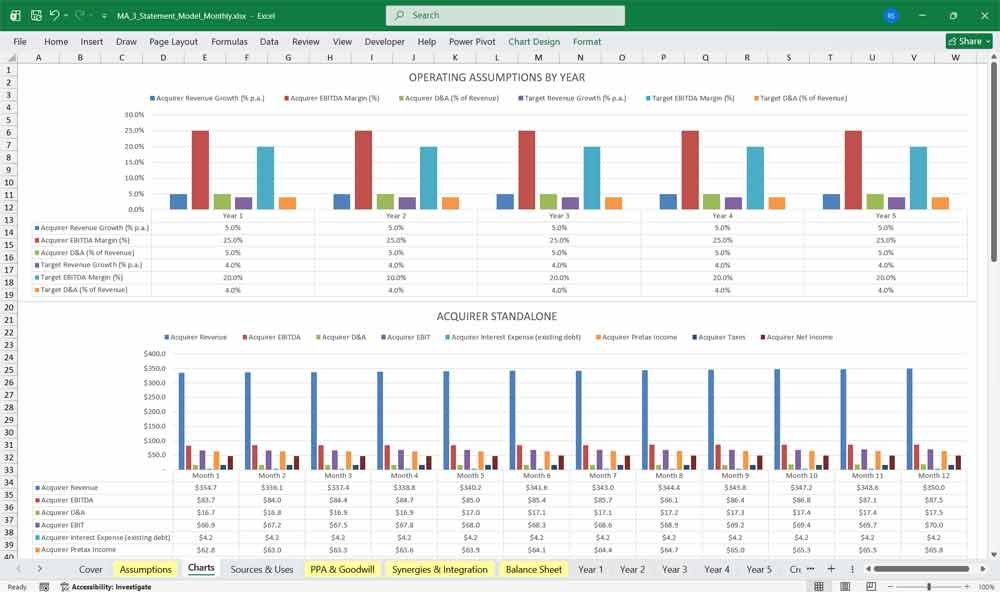
- Cover, Assumptions, Sources & Uses, PPA & Goodwill, Synergies & Integration, Balance Sheet — periodicity of months, “Operating Assumptions by Year” table to the Assumptions tab (annual growth/margin/D&A% drivers) since those now feed monthly formulas across five tabs instead of living in one annual Income Statement tab
- Year 1 – Year 5 (new) — each tab has 12 monthly columns + a Year Total column, containing:
- Acquirer standalone / Target standalone monthly financials
- Monthly synergy realization and integration costs
- Combined pro forma income statement
- A monthly acquisition-debt schedule (interest, mandatory amortization, cash sweep)
- Monthly cash flow and cash balance roll-forward
- An annual accretion/(dilution) summary in the Year Total column
- Credit Metrics & Sensitivity — now pulls annual figures from each Year tab’s December/Year-Total columns
Sources & Uses of Funds
The Sources & Uses schedule ensures that every dollar required to fund the acquisition, settle existing obligations, and pay transaction expenses is precisely accounted for by capital raised or redeployed. Total sources must equal total uses exactly.
Uses of Funds:
Purchase Price of Equity: The total cash/stock consideration paid to legacy shareholders of the target.
Refinancing of Target Debt: Existing target debt that must be paid off at closing (per change-of-control covenants).
Transaction & Advisory Fees: Fees paid to bankers, lawyers, and consultants.
Financing Fees: Upfront fees associated with securing new debt facilities (revolving credit facilities, term loans, senior notes).
Minimum Cash / Balance Sheet Cash: Cash required to be left on the target’s balance sheet to support ongoing operations post-close.
Sources of Funds:
New Debt Issuance: Term Loan A (TLA), Term Loan B (TLB), Senior Notes, or Subordinated Mezzanine Debt.
Acquirer Cash on Hand: Balance sheet cash redeployed by the acquirer to fund the transaction.
New Equity Issued / Rollover Equity: Common stock issued directly to finance the transaction or existing target management rollover equity rolled over into the new combined entity.
Purchase Price Allocation (PPA) & Goodwill
Purchase Price Allocation determines how the total purchase price is distributed across the target company’s identifiable net assets, with the residual balance recognized as goodwill.
Net Identifiable Assets: Book value of target assets less liabilities is adjusted to fair market value (FMV). Fixed assets (PPE) and intangible assets (customer relationships, proprietary technology, trademarks, patents, and trade names) are written up to their appraised fair values.
Deferred Tax Liabilities (DTL): Created as a result of write-ups on PP&E and identifiable intangibles, since book-tax differences arise when assets are stepped up for book purposes but remain at historical cost for tax purposes (in stock purchases).
Goodwill Calculation:
$$\text{Goodwill} = \text{Purchase Price} – (\text{Fair Value of Identifiable Assets} – \text{Identifiable Liabilities}) + \text{Deferred Tax Liabilities}$$Goodwill is tested annually for impairment rather than amortized under standard US GAAP/IFRS rules (unless private company alternatives are elected).
Identifiable Intangible Amortization: Indefinite-lived intangibles are not amortized, but finite-lived intangibles (such as customer lists and patents) are amortized on a straight-line or accelerated basis over their useful lives (e.g., 5 to 15 years), creating a non-cash expense that impacts future net income.
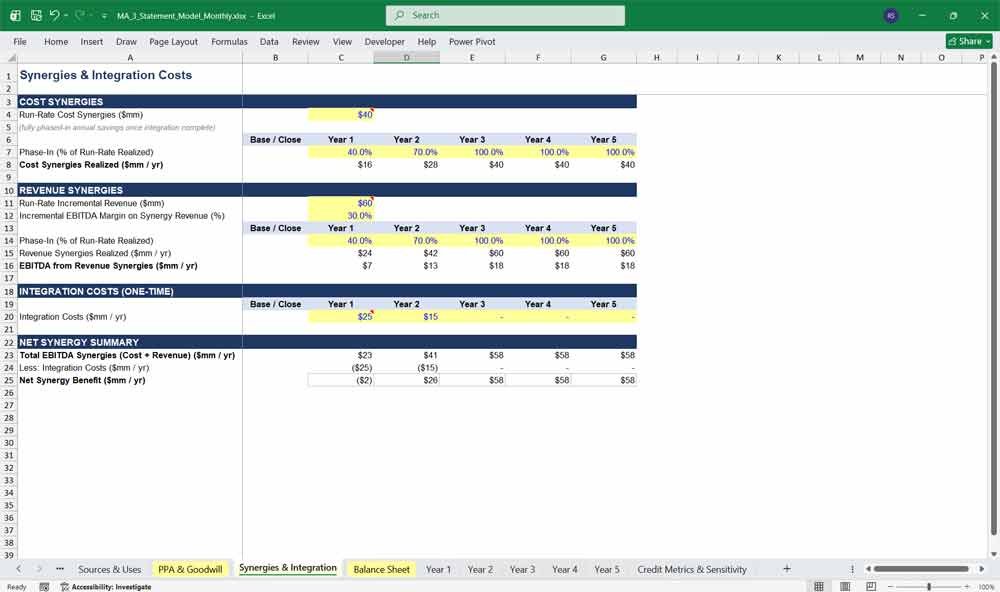
Synergies & Integration Costs
Synergies and integration costs dictate the operational value creation thesis of the M&A transaction over the 5-year forecast period.
Cost Synergies (Hard Synergies): Savings achieved through headcount reduction, elimination of redundant corporate overhead, vendor rationalization, supply chain consolidation, and facility closures. These are typically phased in over Years 1 to 3 (e.g., 50% run-rate in Year 1, 100% by Year 2).
Revenue Synergies (Soft Synergies): Cross-selling opportunities, geographic expansion, and pricing power enhancements. These are modeled more conservatively due to higher execution risk and delayed realization timelines.
Integration Costs (One-Time Costs): Expenses incurred to achieve synergies, including severance packages, IT system migration, rebranding, consulting fees, and contract termination penalties. These are modeled as pre-tax cash outflows, typically expensed upfront or over the first 24 months, with corresponding tax shields.
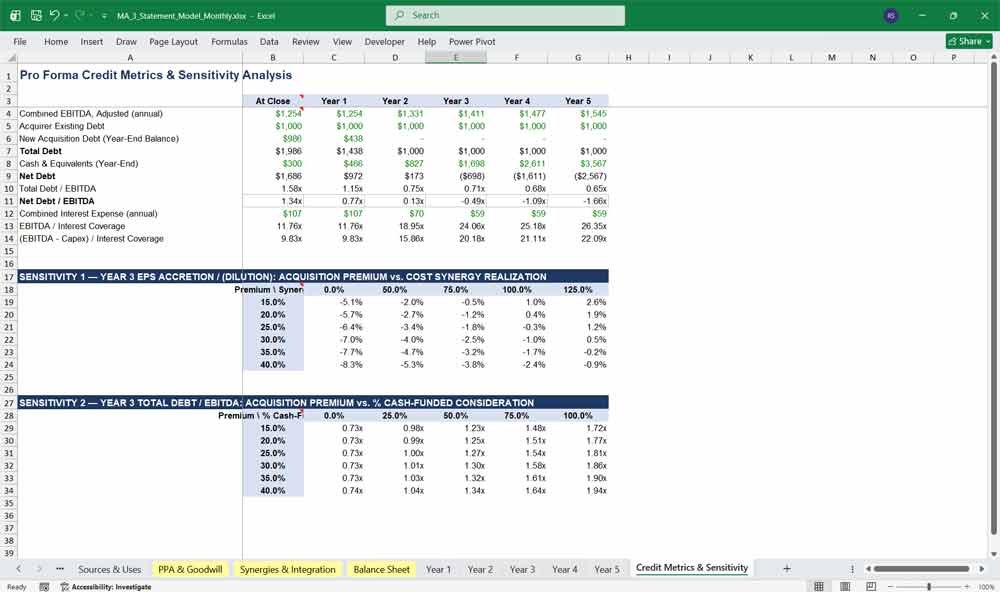
Pro Forma Credit Metrics & Sensitivity Analysis
This section evaluates the financial risk profile, debt-servicing capacity, and return profile of the transaction under varying macro and operational scenarios.
Key Credit Metrics:
Total Debt / EBITDA: Measures overall financial leverage at close and its deleveraging trajectory across the 5-year period through debt paydown and EBITDA growth.
Net Debt / EBITDA: Evaluates leverage adjusted for cash balances on hand.
EBITDA / Interest Coverage Ratio: Assesses the company’s operational cushion to service interest obligations.
($\text{EBITDA} – \text{CapEx}$) / Interest Coverage Ratio: Free cash flow coverage of debt service obligations.
Sensitivity Analysis:
Purchase Multiple vs. Synergies Realization: Evaluates pro forma EPS accretion/dilution and internal rate of return (IRR) across a grid of different purchase price multiples (e.g., 9.0x to 13.0x) and synergy realization percentages (e.g., 50% to 100%).
Revenue Growth & Margin Sensitivity: Stress-tests debt service capability under downside macroeconomic scenarios where target revenue growth misses projections by 200–500 basis points or operating margins compress due to integration delays.
Final Notes on the Financial Model
This 5 Year Merger & Acquisitions Financial Model Excel Template focuses on a projection that combines the standalone financial performance of the acquirer and target with the transaction financing, purchase accounting, synergies, integration costs, and resulting pro forma financial statements ensures sustainable profitability and cash flow stability.
Further Reading
Leveraged Buyout (LBO) Model: Build accurate, bank-ready financial projections for your LBO. Download our professional Excel template for feasibility and valuation analysis.
- Real Estate Private Equity Fund Financial Projection Model: Professional-grade Real Estate Private Equity (REPE) fund financial model in Excel.