
Financial Modeling Web App: Interactive Excel Dashboard
If your financial statements still lives in a 30-tab financial model Excel file, you already know the problem: the numbers are right, but nobody outside of finance can actually use them. This Interactive dashboard & Web App solves this by turning a static, formula-heavy workbook into a living tool that anyone — from a first-time analyst to a board member — can open, understand, and act on in seconds.
Why This Interactive Dashboard Beats a Spreadsheet Every Time
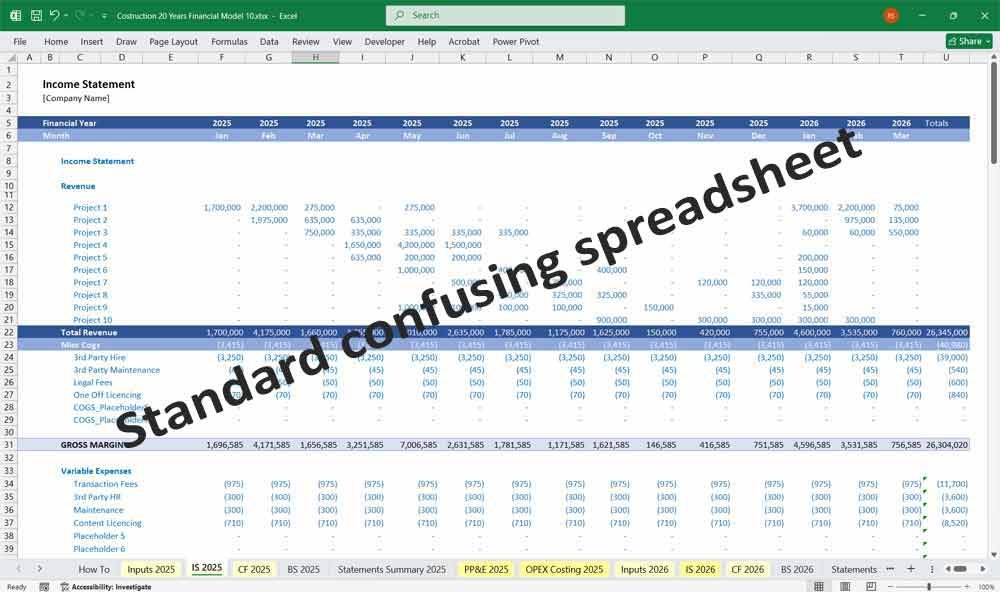
What do businesses usually have in front of them? a spreadsheet that’s keeps track of who owes them, their expenses, inventory, but it’s usually messy and it’s not completely accurate, and many people don’t really know what they’re looking at.
A spreadsheet is built for the person who built it. A dashboard is built for everyone who needs it. That single shift changes how fast a business can make decisions, how confidently it can present to investors, and how much time its team spends formatting instead of analyzing.
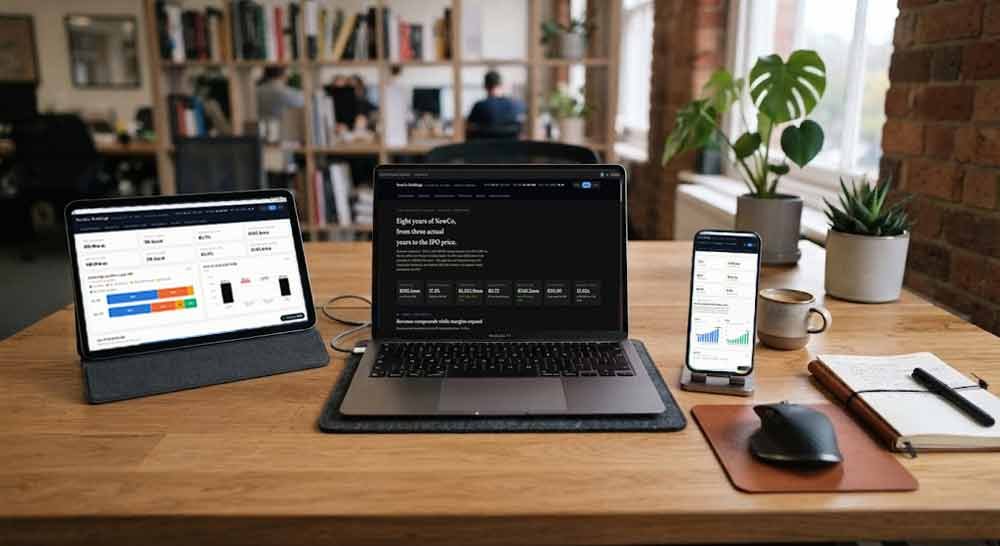
- Live Example: You’re able to view live updates from the model within seconds of your finance team updating relevant information. Save it as a Web App for your smartphone home screen so your got all your finances of your company live when you need it.
What This Dashboard Does That a Spreadsheet Can’t
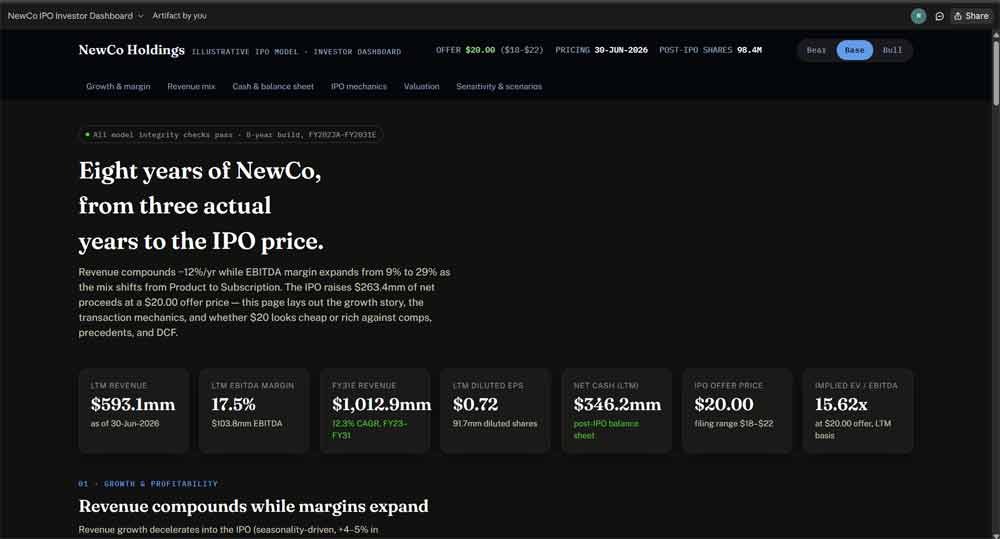
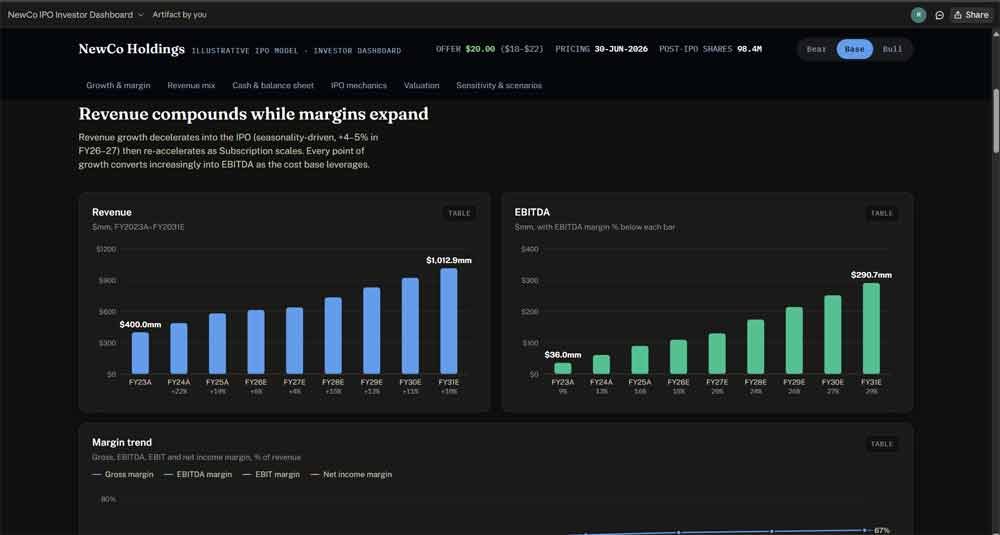
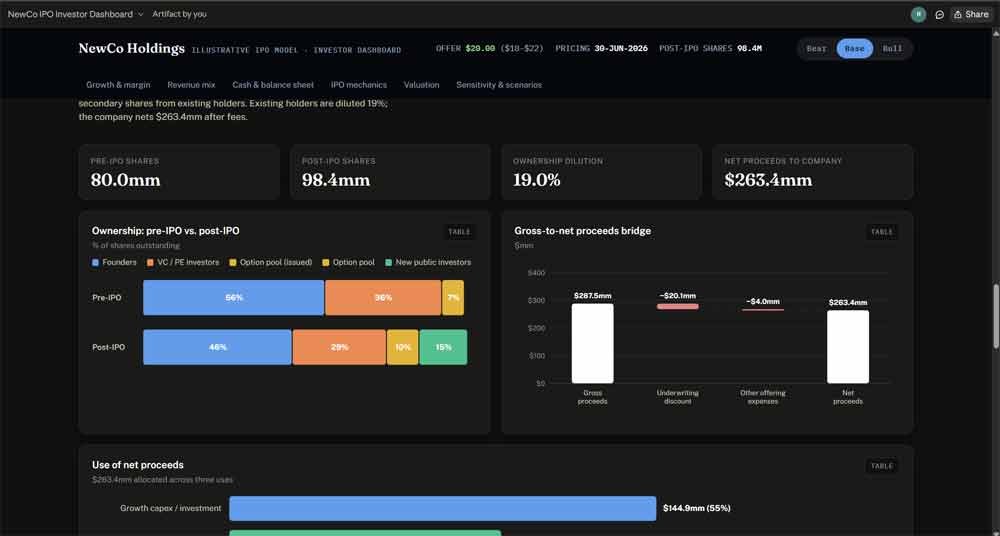
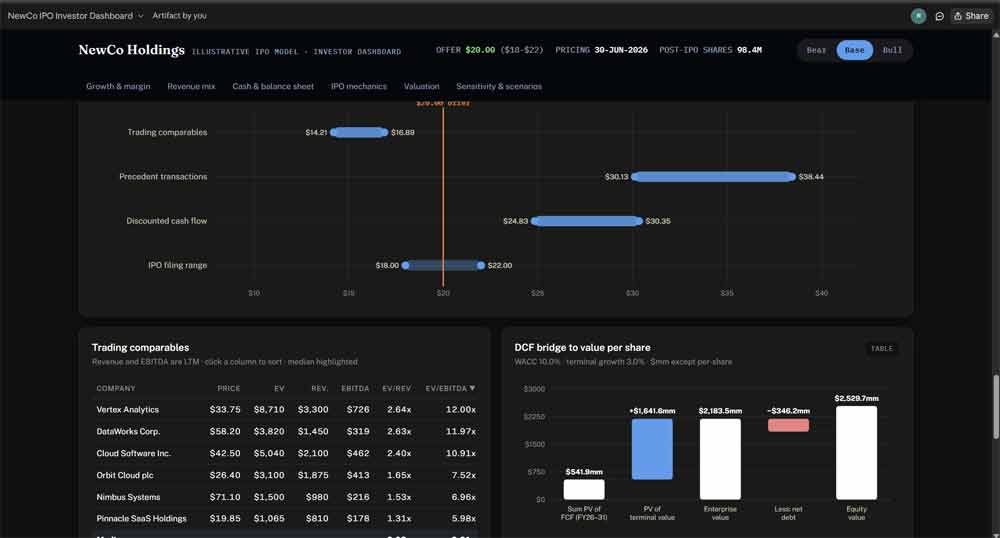
- Instant comprehension. KPI cards, charts, and visual scenario comparisons let a reader grasp performance, valuation, and trends in the time it takes to scroll — no formula-tracing, no hunting across tabs.
- Zero risk of broken formulas. Spreadsheets are one misplaced keystroke away from a corrupted reference. A dashboard’s data and logic are locked behind the interface, so the people viewing it can never accidentally break it.
- One link, not one file. Dashboards live at a URL. There’s no “final_v3_ACTUAL.xlsx” floating around in five inboxes — everyone looks at the same live version, on any device, with no software to install.
- Built for non-experts. Investors, board members, and prospective buyers don’t want to learn your model’s structure. A dashboard translates it into a narrative they can follow unassisted.
- Scenario and sensitivity views, instantly. Toggle between bear, base, and bull cases, or see a valuation sensitivity table, without touching a single cell or risking the underlying assumptions.
- Presentation-ready, always. No exporting to PowerPoint, no screenshotting charts that go stale the next time the model updates. The dashboard is the presentation.
- Faster diligence, faster deals. In an IPO, fundraise, or M&A process, a clean dashboard signals rigor and saves reviewers time — both of which work in your favor at the negotiating table.
Why This Matters for Any Business, Not Just An IPO Candidate
The case for dashboards isn’t limited to companies going public. Any business that reports numbers to someone else — a board, investors, lenders, department heads, or franchisees — faces the same underlying problem: complex data trapped in a format only its creator fully understands. A dashboard removes the translation layer. It turns “let me walk you through this spreadsheet” into “here’s the link, take a look before we talk,” which shortens meetings, sharpens questions, and puts the focus on decisions instead of navigation.
There’s also a credibility dimension. A polished, interactive dashboard signals that a business has its data under control — the same way a clean office or a well-designed website signals operational maturity. For companies raising capital or preparing for a sale, that impression compounds: it suggests the underlying numbers were built with the same care as the presentation of them.
Finally, dashboards scale in a way spreadsheets don’t. A workbook gets harder to maintain and easier to break as more people touch it. A dashboard’s source data can be refreshed centrally while the interface — and the experience for every viewer — stays consistent, clean, and current.
Dashboard Web App Frequently Asked Questions (Faq)
We already have a financial model in Excel. Why do we need a dashboard too?
Your Excel model stays exactly as it is — the dashboard doesn’t replace it, it translates it. The model remains your source of truth and working file; the dashboard is the version you hand to people who need the answers without needing the formulas. Most businesses keep both: Excel for building and stress-testing the numbers, dashboard for communicating them.
Will this work with our existing spreadsheet, or do we have to rebuild our model?
It’s built directly from your existing workbook. The data, structure, and assumptions you already have are mapped into the dashboard as-is — there’s no need to rebuild your model or change how your team works in Excel day to day.
Can we update the dashboard when our numbers change?
Yes. As your model is updated, the dashboard can be refreshed to reflect the latest figures, so the version people are viewing never falls out of date.
Is our data secure if it’s not just sitting in a spreadsheet on our computer?
Yes. Access can be controlled and limited to the people you choose, and the dashboard doesn’t expose your underlying formulas, raw data files, or model logic — viewers see the presented output, not the mechanics behind it.
Who is this actually for — do we need a finance background to read it?
No. That’s the core advantage. It’s designed so that investors, board members, potential acquirers, or internal stakeholders without deep spreadsheet fluency can understand performance, valuation, and scenarios at a glance, without anyone walking them through it line by line.
How is this different from just exporting charts from Excel into a deck?
Exported charts are a snapshot — the moment your numbers change, they’re outdated, and updating them means rebuilding the deck. A dashboard is live and interactive: viewers can explore scenarios, filter data, and see current figures, and updating the underlying data updates the whole presentation at once.
What does this cost us in terms of time or disruption to our current process?
Very little. Because it’s built from your existing model rather than requiring a new one, there’s no retraining, no migration, and no change to how your team currently builds or maintains its spreadsheets. The dashboard sits on top of your existing workflow rather than replacing it.
Can this be shared externally with investors or partners, or is it only for internal use?
Both. It can be shared as a private link for internal reporting or opened up for external stakeholders like investors, lenders, or acquirers — giving you one consistent source to send instead of a spreadsheet attachment that can be edited, broken, or misread.
Real Time Data In A Web App
This dashboard artifact updates every time some someone enters their newest data.
You can open it from your computer or your smartphone home screen as it’s also a web app, you have got all your businesses financial information anywhere, anytime.
Talk to us about live demonstrations on what this Dashboard can do for not only your business but your own personal time.