
Lithium Mine Financial Model Template
Our Lithium Mine Financial Model is a professional, fully integrated Excel template for evaluating a hard-rock lithium (spodumene) mining project from construction through 20 years of operations. Built for mining investors, project developers, analysts, lenders and consultants, the model links the mine plan, processing plant, SC6 concentrate production and lithium price deck directly to the income statement, cash flow, balance sheet and valuation. Every number is formula-driven, so you can test a lithium project feasibility study, prepare for a final investment decision (FID) or support a capital raising with confidence.
Financial Model for a Lithium Mine
The model uses a bankable, lender-ready structure with a 2-year monthly construction timeline, monthly operations for years 1–5 with annual roll-up columns, and annual operations for years 6–20, all reported in US dollars. Change one start date and every date, header and escalation index updates automatically across all 22 tabs. It calculates Project NPV, Project IRR, Equity IRR, payback, DSCR, LLCR and peak funding, with debt sculpting, construction financing, capitalised interest, tax losses, deferred tax and working capital all modelled in full.
Whether you are assessing a greenfield spodumene concentrator in Western Australia, benchmarking a lithium development company, or building a mining discounted cash flow (DCF) valuation, this template saves weeks of model building. It includes six ready-made scenarios, more than 25 sensitivity drivers, two-way NPV sensitivity tables, an executive dashboard with nine charts and over 80 integrity checks. Clear colour coding, a full index and illustrative inputs make it easy to adapt to your own lithium mine project.
What’s Inside: Tab-by-Tab Guide
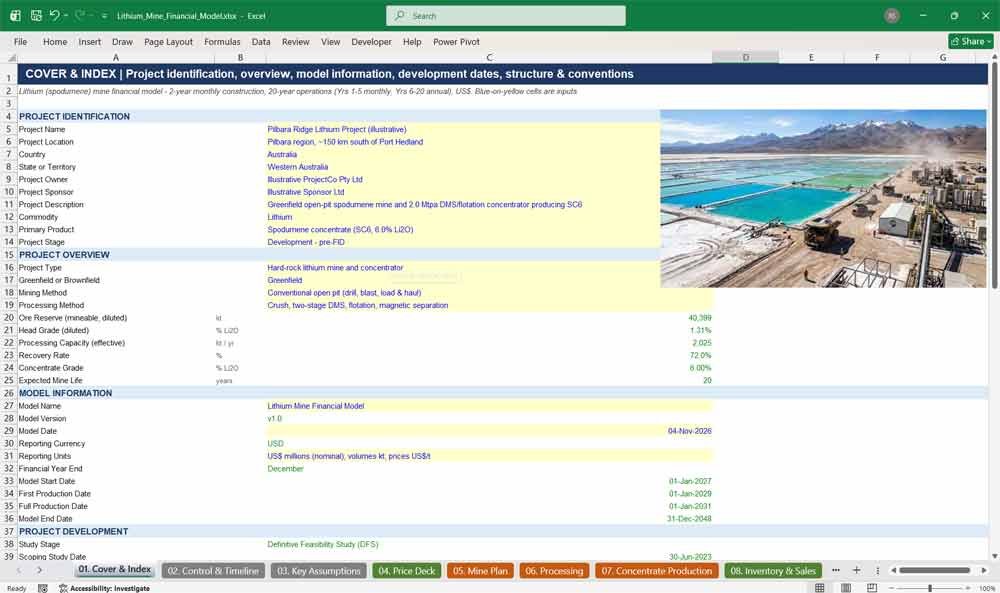
01. Cover & Index
A professional cover sheet summarising the lithium project’s identity, overview, key dates and model information, with a clickable index to every tab plus clear model conventions and disclaimers for investors and lenders.
- Project identification, location, owner, sponsor and stage
- Project overview: reserve, head grade, capacity, recovery and mine life
- Development milestones: scoping, PFS, DFS, FID, construction and COD
- Hyperlinked index of all 22 tabs
- Colour-coding legend, units, sign and rounding conventions
02. Control & Timeline
The master control panel for the lithium mine financial model. One start date drives the entire calendar, project phases, production flags, financial controls, scenario selection and calculation switches across every tab.
- Single Model Start Date re-dates the whole workbook automatically
- Construction (monthly), Ops Years 1–5 (monthly + FY totals), Ops Years 6–20 (annual)
- Project phase flags from exploration to rehabilitation
- Construction, commissioning, ramp-up, full production and closure flags
- Inflation, FX, discount rate, tax, royalty and debt/equity controls
- Switches for debt sculpting, tax, working capital and interest method
03. Key Assumptions
All technical and cost inputs for a spodumene mining project in one place: ore reserves, mining, processing, labour, power, maintenance, logistics, CAPEX estimate, working capital, financing and tax assumptions, each clearly labelled and documented.
- Ore reserve, grade, mining recovery, dilution and strip ratio
- Plant throughput, availability, utilisation and Li2O recovery
- Unit costs for mining, processing, power, fuel, labour and site services
- Detailed CAPEX estimate by area with contingency and phasing
- Working capital days, financing terms and tax depreciation inputs
- Project phase schedule with automatic start and end dates
Lithium Mine Sales & Expenses
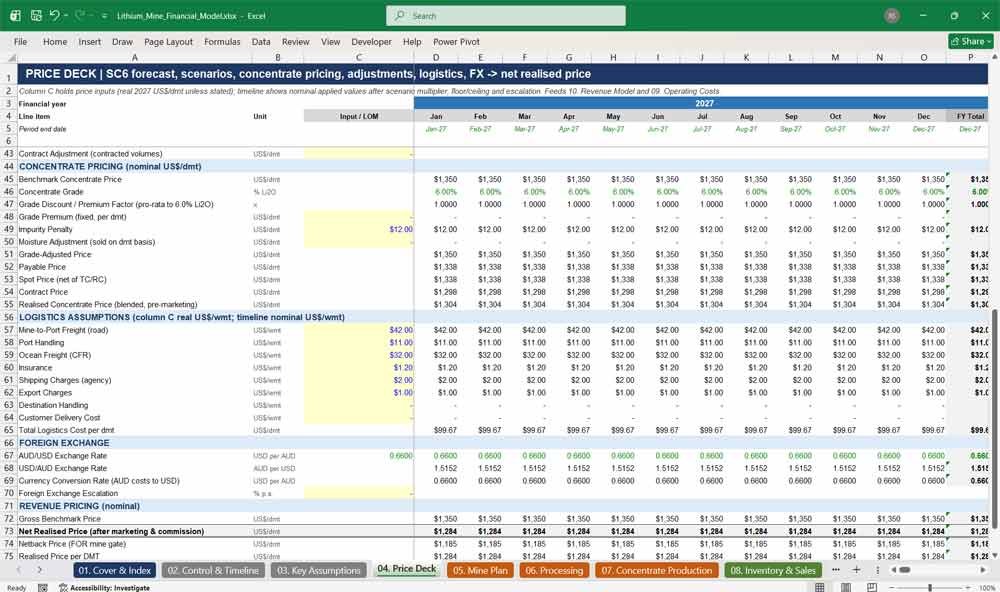
04. Price Deck
A complete lithium price deck converting the SC6 spodumene benchmark into a net realised price. Includes price forecasts, scenarios, grade adjustments, impurity penalties, contract pricing, logistics rates and AUD/USD exchange rates.
- Year 1–5 and long-term SC6 price forecasts with escalation
- Low, base, high, downside and upside price cases with floor and ceiling
- Lithium carbonate and hydroxide reference prices
- Grade, quality, payability, TC/RC, marketing and contract adjustments
- Mine-to-port, port, ocean freight and insurance logistics rates
- Netback price and realised price per tonne of LCE
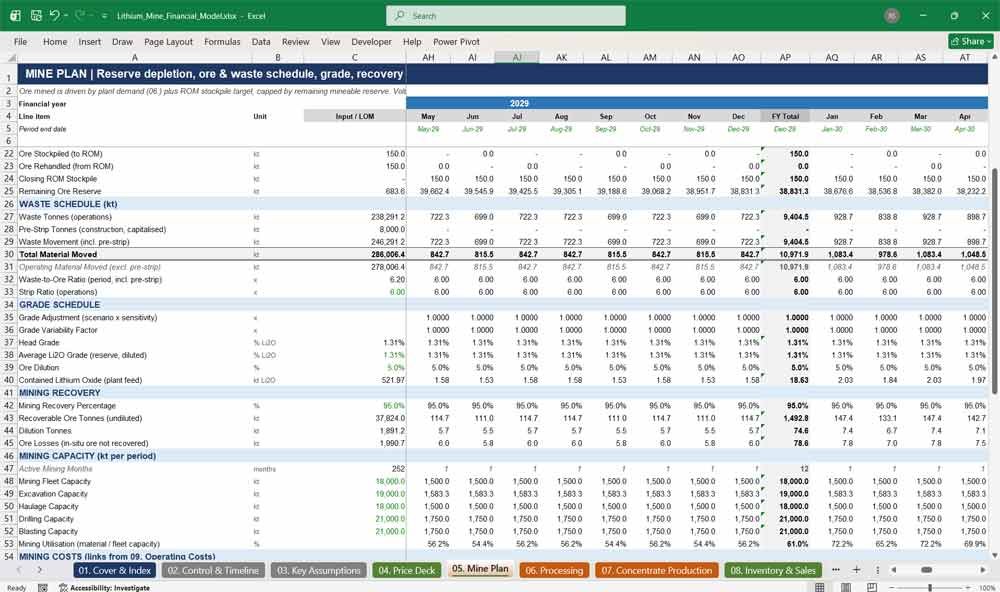
05. Mine Plan
A dynamic open-pit mine schedule driven by plant demand and reserve depletion, covering ore and waste tonnes, strip ratio, head grade, dilution, mining recovery, fleet capacity, pre-strip and mine development capital.
- Ore mined, processed, stockpiled and rehandled
- Waste movement, pre-strip tonnes and strip ratio
- Head grade and contained Li2O schedule
- Mining recovery, ore losses and dilution tonnes
- Fleet, excavation, haulage, drilling and blasting capacity checks
- Reserve reconciliation and remaining mine life
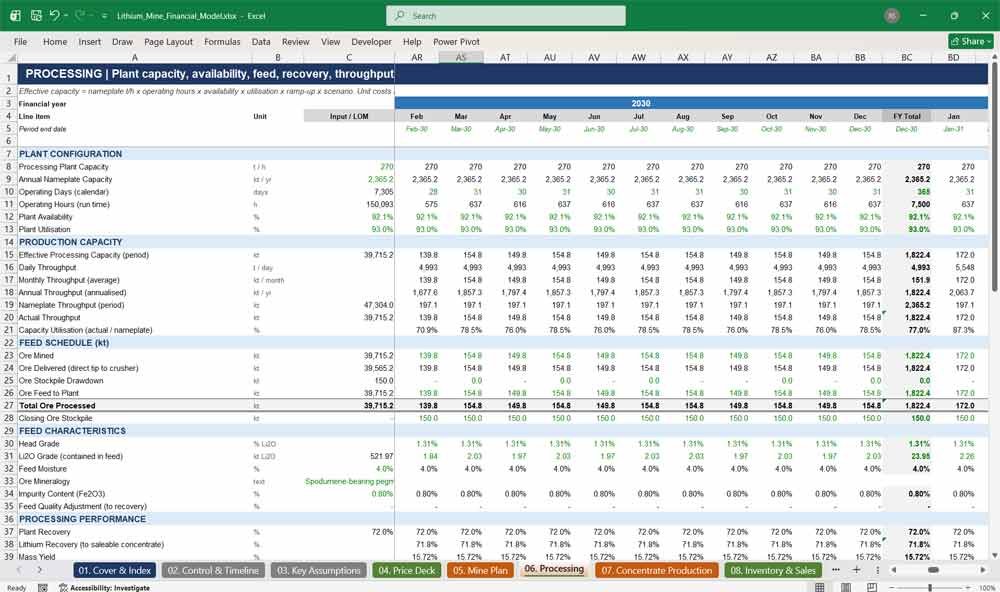
06. Processing
Models the spodumene concentrator from crushing to tailings, calculating effective throughput from nameplate capacity, availability, utilisation and ramp-up, alongside recovery, consumables, energy use, tailings storage and plant performance metrics.
- Nameplate and effective processing capacity
- Feed schedule, head grade and feed characteristics
- Plant recovery, mass yield and processing efficiency
- Power, diesel, reagent and water consumption
- Tailings tonnes and remaining storage capacity
- Planned maintenance, downtime and throughput losses
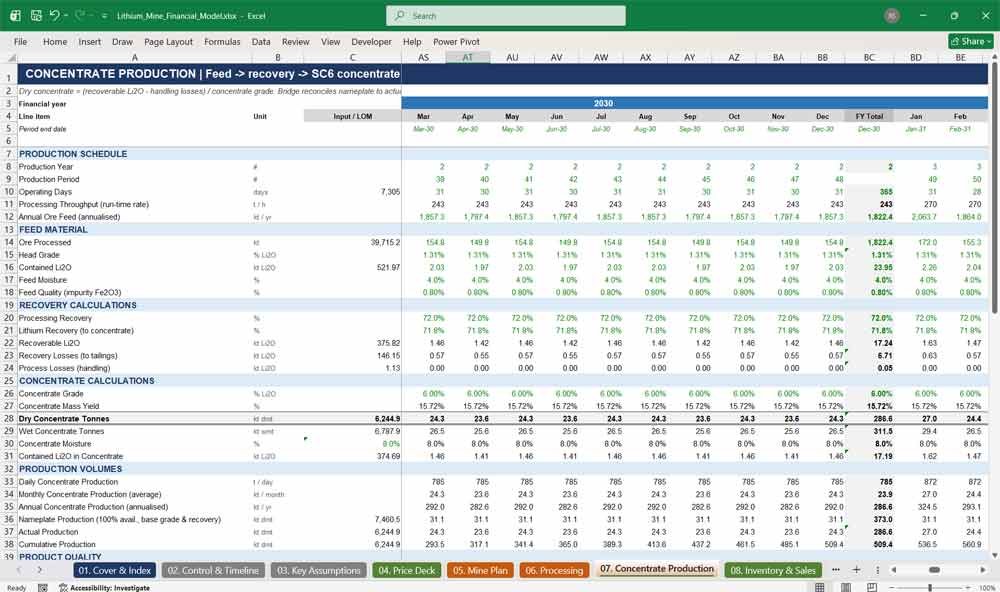
07. Concentrate Production
Converts recovered Li2O into dry and wet SC6 spodumene concentrate tonnes, with product quality specifications, a full production bridge from nameplate to actual output, and unit production cost metrics.
- Recoverable Li2O and recovery losses
- Dry (dmt) and wet (wmt) concentrate tonnes
- Daily, monthly, annual and cumulative production
- Product quality: Li2O grade, iron, silica, phosphorus, mica
- Production bridge: availability, ramp-up, grade and recovery effects
- Production cost per DMT and per tonne of ore
08. Inventory & Sales
Tracks concentrate stockpiles and sales from mine to customer, including inventory days, contracted versus spot sales, customer allocation, shipping and payment timing, sales adjustments and logistics costs.
- Opening and closing concentrate inventory with valuation
- Contracted, spot, domestic and export sales volumes
- Customer A, B and C offtake allocation
- Sales timing from production to payment date
- Sales adjustments and logistics cost links
- Inventory reconciliation and sales metrics
09. Operating Costs
A detailed lithium mine operating cost build covering mining, processing, labour, power, fuel, maintenance, site administration, logistics, environmental and corporate costs, with category-specific inflation and AUD/USD currency effects.
- Driver-based costs: tonnes moved, ore processed and concentrate sold
- FIFO labour by headcount and cost per employee
- Separate inflation indices for mining, processing, labour, power and fuel
- AUD cost share revalued at the applied exchange rate
- Operating cost per tonne of ore and per DMT of concentrate
- Scenario and sensitivity multipliers built in
Lithium Mine Financial Statements
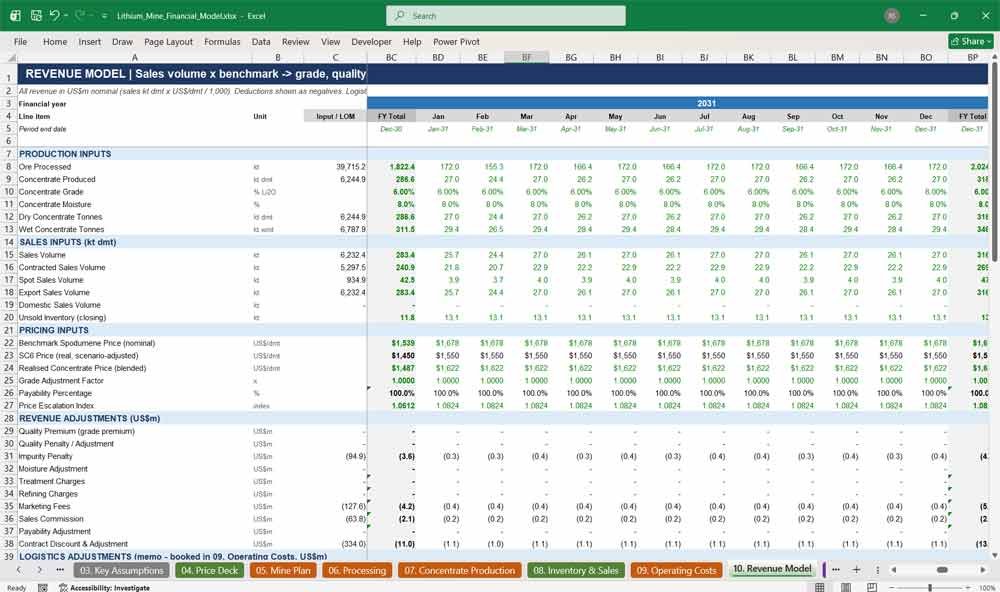
10. Revenue Model
Builds spodumene concentrate revenue from sales volume and benchmark price through grade, quality, payability, treatment charges, contract discounts and marketing fees to net revenue, plus royalties and revenue by customer and product.
- Gross benchmark, grade-adjusted, payable and net sales revenue
- Quality premiums, impurity penalties and moisture adjustments
- Contract versus spot pricing and marketing fees
- Revenue by customer and by product, including by-products
- FX gain/loss on AUD-linked revenue
- State royalty calculated on FOB value
11. CAPEX
A comprehensive mining capital expenditure schedule covering mining fleet, processing plant, infrastructure, engineering and construction, with contingency, escalation, construction phasing, sustaining capital, expansion and closure costs.
- Initial CAPEX by area with Year 1 and Year 2 phasing
- Engineering, construction, owner’s and escalation contingency
- Commissioning and first-operating-year capital
- Sustaining CAPEX for equipment, plant, infrastructure and tailings
- Closure CAPEX and rehabilitation provision
- Capital classification and construction in progress
12. Working Capital
Calculates receivables, concentrate and ore inventories, reagent and spare parts stock, payables, prepayments and accruals, producing the net working capital movement that flows into the cash flow statement.
- Receivable, payable and inventory days
- Concentrate, ore stockpile, reagent and spare parts inventory
- Operating and capital cost payables
- Prepayments, accruals and other current items
- Working capital investment and release
- Automatic unwind at end of mine life
13. Depreciation & Tax
Covers the fixed asset register, straight-line depreciation over remaining mine life, a tax written-down value pool, taxable income, tax loss carry-forward, current and deferred tax and tax payments.
- Asset register by plant, mining fleet, infrastructure and tailings
- Book depreciation and net book value schedule
- Tax depreciation over effective life with closure write-off
- Tax losses incurred, utilised and carried forward
- Current tax, deferred tax liability and cash tax paid
- Effective tax rate analysis
14. Income Statement
A complete mining income statement from revenue to net profit after tax, showing operating costs by nature, royalties, EBITDA, depreciation, EBIT, financing costs, tax, margins and per-tonne operating metrics.
- Gross and net sales revenue
- Operating costs by category plus royalties
- Gross profit, EBITDA and EBITDA margin
- Depreciation, EBIT and operating margin
- Interest, fee amortisation and profit before tax
- Net profit, EPS and per-tonne metrics
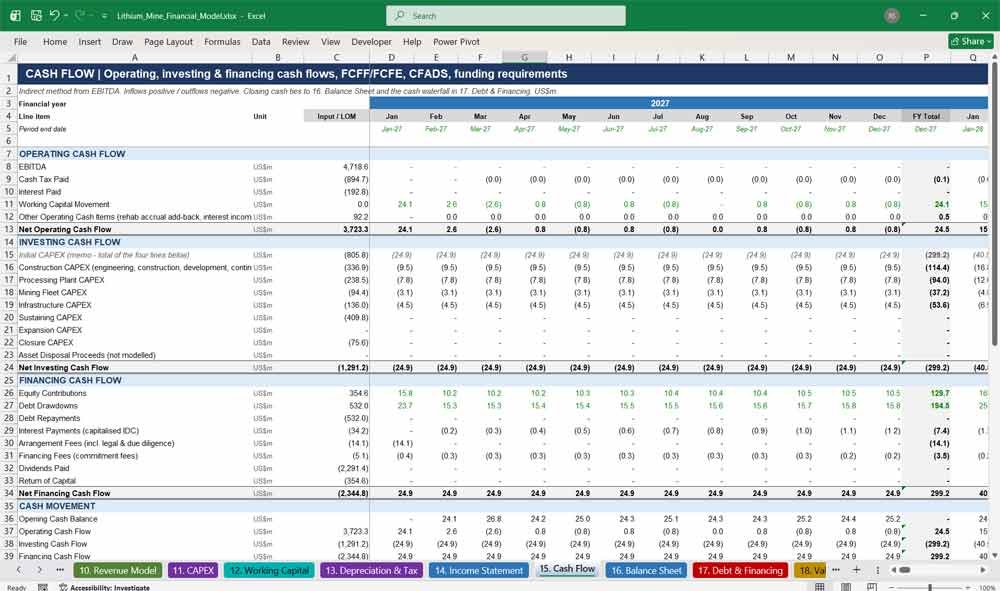
15. Cash Flow
An integrated mining cash flow statement presenting operating, investing and financing cash flows, free cash flow to firm and equity, cash flow available for debt service and project funding requirements.
- Operating cash flow from EBITDA, tax, interest and working capital
- Investing cash flow by CAPEX category including closure
- Financing cash flow: equity, debt, fees and dividends
- FCFF, FCFE and cumulative project cash flow
- Cash flow available for debt service (CFADS)
- Initial and peak funding requirements
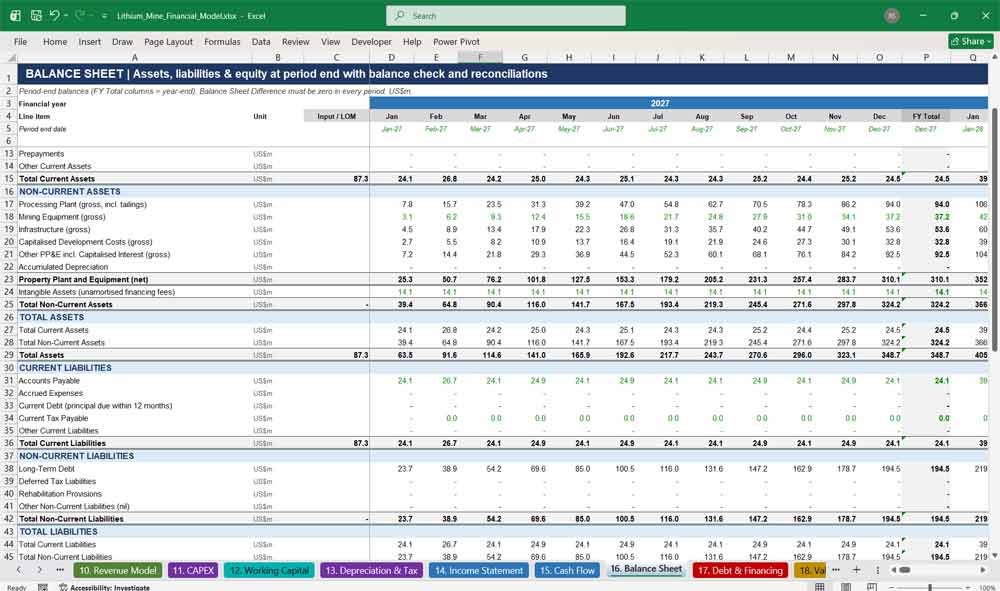
16. Balance Sheet
A fully balancing balance sheet with current and non-current assets, liabilities and shareholders’ equity at every period end, including a balance check, working capital ratios and reconciliations.
- Cash, receivables, inventories and prepayments
- PP&E by category, accumulated depreciation and intangibles
- Payables, current and long-term debt, tax and deferred tax
- Rehabilitation provision
- Share capital, retained earnings and current profit
- Balance check, current ratio and quick ratio
Lithium Mine Valuation
17. Debt & Financing
Project finance debt modelling for a lithium mine, including funding structure, construction drawdowns, interest during construction, commitment and arrangement fees, straight-line or sculpted repayment, DSCR and LLCR covenants and a full cash waterfall.
- Pro-rata debt and equity construction funding
- Interest during construction and commitment fees capitalised
- Debt sculpting to a target DSCR or straight-line repayment
- Cash sweep, voluntary repayment and grace period
- DSCR, forward DSCR, LLCR, PLCR and debt-to-equity
- Cash waterfall with dividends and return of capital
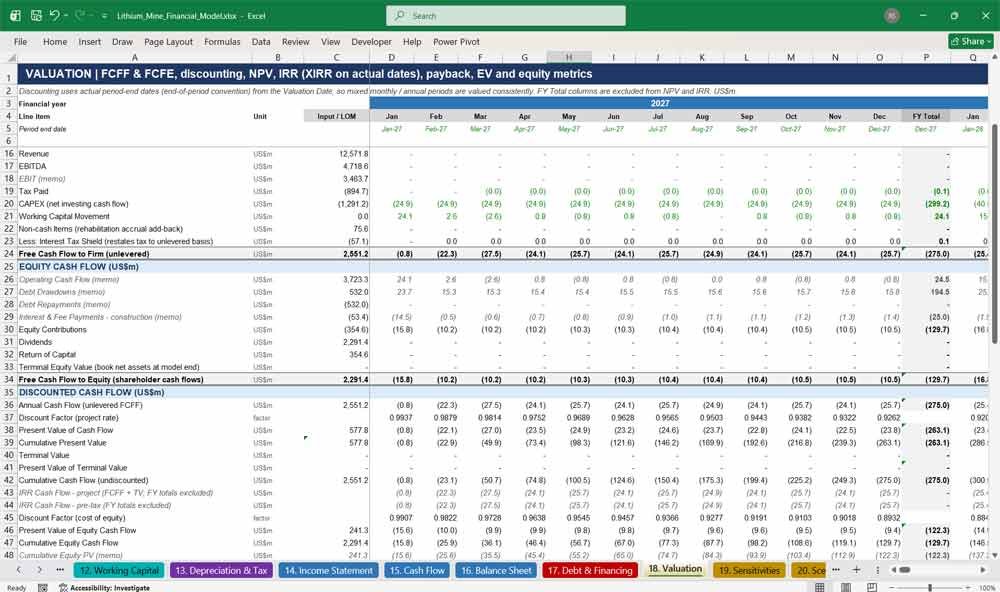
18. Valuation
A mining DCF valuation calculating Project NPV, Project IRR and Equity IRR using actual period dates, with payback, discounted payback, equity multiple, enterprise value and net asset value metrics.
- Unlevered free cash flow to firm and equity cash flows
- Date-based discount factors for mixed monthly and annual periods
- Project NPV, post-tax IRR and pre-tax IRR (XIRR)
- Equity NPV, Equity IRR and equity multiple
- Payback and discounted payback from first production
- Enterprise value, EV per tonne and net debt at COD
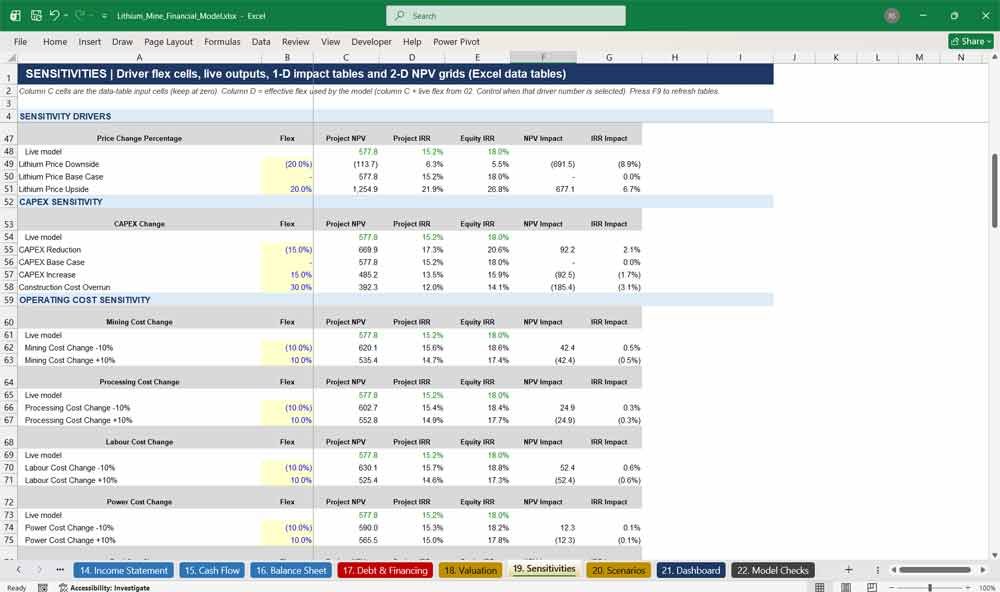
19. Sensitivities
Test how lithium price, CAPEX, operating costs, grade, recovery, schedule, financing, FX and tax affect project value, with live driver controls, one-way impact tables and two-way NPV sensitivity grids.
- More than 25 sensitivity drivers with live flex control
- NPV, Project IRR and Equity IRR impact tables
- Lithium price vs CAPEX, operating costs and recovery grids
- CAPEX vs operating costs and construction delay grids
- Debt funding vs interest rate equity NPV grid
- Built with Excel data tables – refresh with F9
20. Scenarios
Six ready-made scenarios – Base, Downside, Upside, Severe Downside, Optimistic and User Defined – built from a library of price, production, cost, capital, schedule, financing, FX and tax cases.
- Switch scenarios from a single control cell
- Commodity price cases including price recovery and decline
- Production, operating cost and capital cases
- Schedule cases for delays, early commissioning and ramp-up speed
- Financing, FX and tax and royalty cases
- Side-by-side scenario outputs: NPV, IRR, payback, peak funding, DSCR
21. Dashboard
An executive dashboard presenting the lithium project’s headline operating, financial, valuation and financing KPIs, scenario comparisons, model status and nine annual charts ready for investor presentations.
- Project, mining, processing and sales metrics
- Financial, cash flow, valuation and financing KPIs
- Cost metrics including cash cost per DMT
- Scenario NPV and IRR summary
- Model status traffic lights
- Nine charts: production, price, revenue, EBITDA, CAPEX, FCF and debt
22. Model Checks
More than 80 automated integrity checks covering inputs, timeline, mine plan, processing, production, sales, costs, working capital, tax, financing, financial statements and valuation, each with a clear PASS/REVIEW status.
- Input checks for missing, invalid and negative assumptions
- Timeline, mine plan and processing reconciliation checks
- Production, inventory and revenue reconciliation checks
- Tax, debt and DSCR covenant checks
- Balance sheet, cash flow and retained earnings checks
- Per-period checks across the full timeline plus overall model status
Why Buy This Model
Building a bankable lithium mine financial model from scratch can take weeks and introduce costly errors. This template gives you a fully integrated, formula-driven Excel model that has already been tested end to end: the balance sheet balances in every period, cash ties across the statements, and over 80 checks confirm the model’s integrity. It reflects how lenders, investors and mining analysts expect a project model to look, with clear colour coding, a single-date timeline, scenario and sensitivity analysis and an investor-ready dashboard. Simply replace the illustrative inputs with your own study data and you have a professional valuation and financing model ready for feasibility studies, board papers, capital raisings and lender due diligence.
Lithium Mining Frequently Asked Questions
Is this model only for spodumene projects, or can I use it for other lithium projects?
It is built around a hard-rock spodumene mine producing SC6 concentrate. It can be adapted to other concentrate-producing mines, but it does not model lithium brine operations or downstream hydroxide or carbonate refineries.
Do I need advanced Excel skills to use it?
No. Inputs are clearly marked in blue on yellow, and every other cell is a formula. If you can enter numbers in a spreadsheet, you can run the model. Financial modelling experience helps when interpreting the results.
What happens if my construction start date is different?
Just change the Model Start Date on the Control & Timeline tab. Every date, year header, month label and escalation index across all 22 tabs updates automatically.
Are the assumptions based on a real project?
No. All inputs are illustrative placeholders for a typical 2.0 Mtpa Western Australian spodumene project. They are there to show how the model works and should be replaced with your own technical study and market data.
Which version of Excel do I need?
A modern desktop version of Microsoft Excel (Microsoft 365, Excel 2021 or Excel 2019) is recommended. The model uses standard functions including XIRR and MINIFS and contains no macros.
Why do the sensitivity and scenario tables need F9?
They use Excel data tables, which recalculate the whole model many times. The workbook is set to “Automatic except data tables” so it stays fast while you edit inputs. Press F9 to refresh the tables.
Can I change the debt structure?
Yes. You can set the debt funding percentage, interest rate, fees, grace period and repayment period, and switch between sculpted repayment to a target DSCR or straight-line repayment. Cash sweep and voluntary repayment options are also included.
Does the model contain circular references?
No. Interest on the average debt balance is solved algebraically, so the model calculates without circularity and without needing Excel’s iterative calculation setting.
Can I use it for lender or investor presentations?
Yes. The Dashboard summarises the key KPIs and charts, and the Valuation, Debt & Financing and Model Checks tabs provide the detail lenders and investors typically review. The results should still be reviewed independently before any reliance.
Does it handle Australian dollar costs and a US dollar price?
Yes. Revenue is in US dollars, and a set share of operating and capital costs is treated as AUD-denominated and revalued at the applied AUD/USD exchange rate, with FX scenarios and sensitivities included.
Can I add my own scenarios?
Yes. The User Defined Case lets you pick any combination of price, production, cost, capital, schedule, financing, FX and tax cases, and you can edit the values in each case library.
Does the model include closure and rehabilitation costs?
Yes. Closure costs are paid at the end of mine life, and a rehabilitation provision is built up over the operating life, flowing through the income statement, balance sheet and cash flow.
Further Reading
-
Maximize your asset evaluation and investment analysis with this institutional-grade Copper Mine Financial Model. This specialized template features dynamic inputs for grade recovery, smelting and refining charges (TC/RCs), byproduct credits (like gold or molybdenum), and multi-scenario cash flow forecasting to accurately assess project economics.
- Accelerate your project analysis and investment decisions with this comprehensive Iron Ore Mine Financial Model. This production-ready template streamlines your evaluation process with integrated modules for grade-tonnage curves, logistical shipping costs, life-of-mine forecasting, and detailed NPV/IRR calculations.
- Process valuations and feasibility studies with this dedicated Lithium Refinery Financial Model. Designed specifically for downstream chemical processing, this comprehensive template provides pre-built structures for tracking chemical reagent costs, spodumene conversion efficiencies, battery-grade carbonate or hydroxide output premiums, and complex tolling margins.
Final Notes on the Financial Model
This 20 Year Lithium Mine Financial Model Template must focus on balancing capital expenditures with steady revenue growth from diversified commodity mining. By optimizing operational costs, power efficiency, and maximizing high-margin services, this model helps to ensure sustainable profitability and cash flow stability.