
Copper Mine Financial Model & Excel Template
Our Copper Mine Financial Model is a fully integrated Excel template built for open-pit copper operations. It takes you from the mine plan to the three financial statements in one workbook. Start with life-of-mine tonnages by pit and phase, then follow ore through grade control, dilution, stockpiling, milling and flotation to copper concentrate, cathode and payable copper. From there, every pound of copper flows into revenue, operating costs, sustaining and growth capex, working capital, the income statement, cash flow statement and balance sheet. All 25 tabs are formula-driven, with no hardcoded results and no macros.
Financial Model for a Copper Mine
This copper mining financial model covers 3 years of monthly historical actuals, then a 20-year forecast: monthly detail with annual roll-ups for Years 1–5, and annual columns for Years 6–20. A single Model Start Date re-dates the entire workbook. Every header, escalation index, fiscal-year total and budget lookup updates automatically, even for non-calendar financial years. Scenario selectors for Base, Upside, Downside and Management cases flex copper price, production, operating costs, capex and FX, with sensitivity inputs for copper, diesel and electricity.
Built for mine finance teams, FP&A analysts, mining consultants, lenders and investors, the model reports the metrics that matter in copper mining. These include C1 cash cost per pound, All-In Sustaining Cost (AISC), strip ratio, head grade, recovery, concentrate production and EBITDA margin. It also calculates NPV and free cash flow. A dedicated Budget vs Actual tab delivers month, year-to-date and full-year variance reporting with an EBITDA bridge. Fifteen built-in integrity checks confirm the balance sheet, cash flow and copper reconciliations in every period.
What’s Inside: Tab-by-Tab Guide
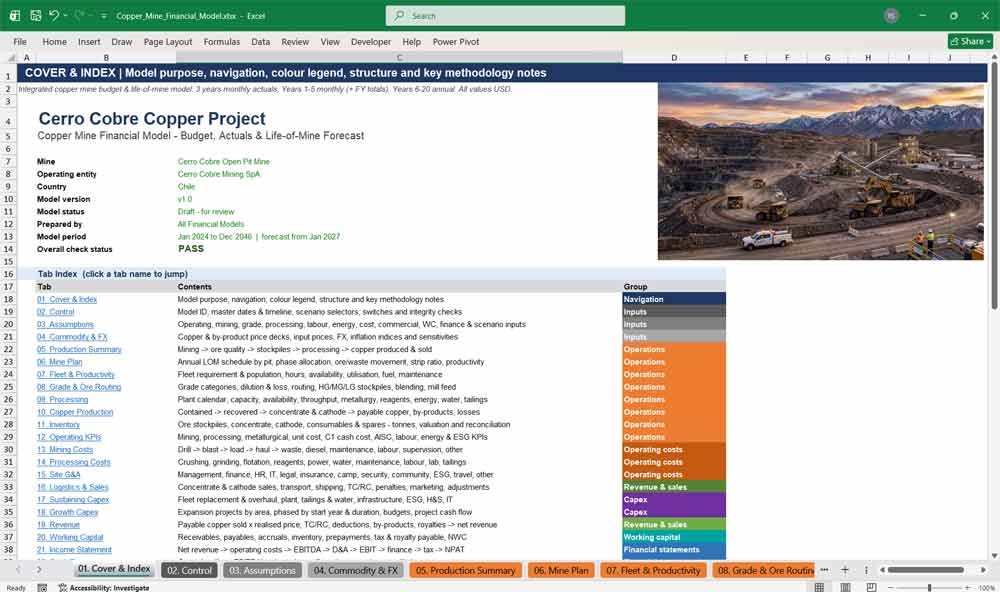
01. Cover & Index
The cover and index tab is the navigation hub of the copper mining financial model. It summarises project details, model period and overall check status, and gives one-click hyperlinks to all 25 tabs. It also includes a colour legend, a model flow map and key methodology notes, so users understand the structure immediately.
- Clickable index to every tab, grouped by function
- Live project name, entity, country and model period
- Overall model check status (PASS / REVIEW)
- Colour legend: inputs, formulas, links and memo lines
- Model flow and methodology notes
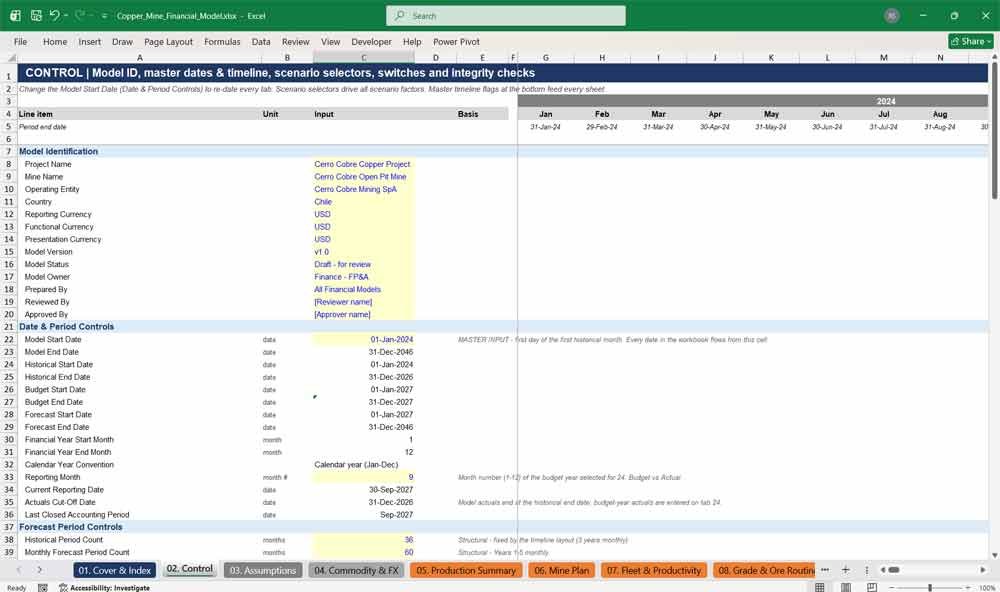
02. Control
The Control tab is the command centre of the mine financial model. It holds model identification, the master Model Start Date, period counts and scenario selectors. It also holds actual and budget switches, calculation switches and the master timeline flags. Change one date or one dropdown and the entire Excel model updates instantly.
- One Model Start Date drives every date in the workbook
- Scenario selector: Base, Upside, Downside, Management
- Separate overrides for price, production, opex, capex and FX
- Interest, depreciation, tax, working capital and inventory switches
- Model integrity check summary
03. Assumptions
The Assumptions tab contains every scalar input for the copper mine. These cover operating days, mining availability, ore grades, dilution, plant capacity, copper recovery, concentrate grade, labour, energy, unit costs, commercial terms, working capital, tax, royalty, closure and scenario factors. All inputs are clearly marked, documented and ready to replace with your site data.
- Over 150 documented, colour-coded inputs
- Ore grade, dilution, ore loss and recovery assumptions
- Labour, diesel, electricity and water consumption rates
- TC/RC, payability, royalty, tax and working capital days
- Scenario factors for production, cost, recovery and capex
Copper Mine Commodity FX & Productivity
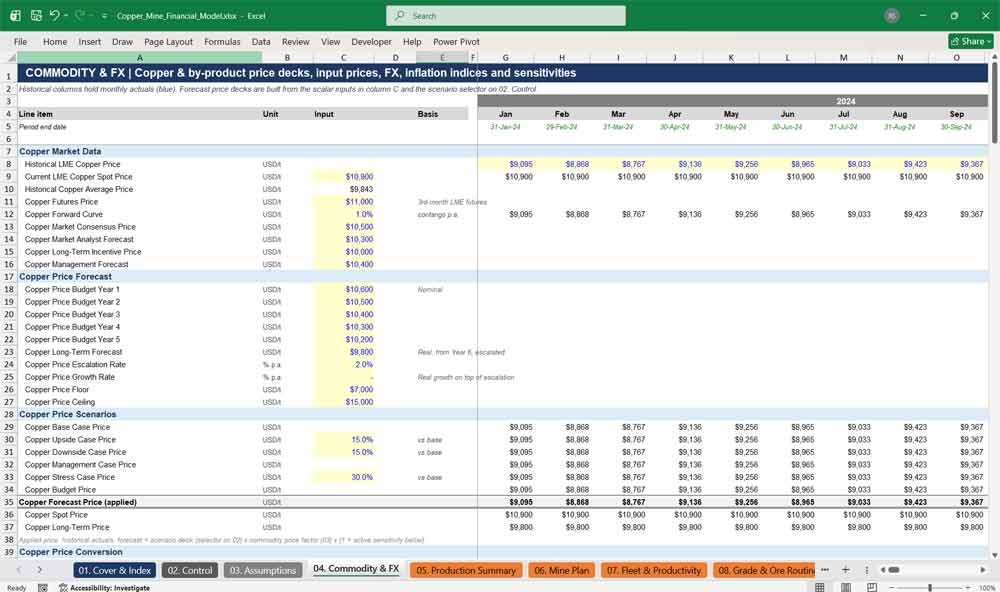
04. Commodity & FX
This tab builds the copper price forecast and by-product price decks for gold, silver, molybdenum and other by-products. It also covers input prices for diesel, electricity, natural gas, sulphuric acid, explosives and reagents, plus FX rates and inflation indices. Historical monthly actuals sit alongside budget, consensus, long-term and scenario price paths.
- LME copper price deck: budget Years 1–5 plus escalated long-term price
- Upside, downside, management and stress copper cases
- Gold, silver and molybdenum price forecasts
- USD to local-currency FX scenarios and inflation indices
- Price sensitivities from −20% to +20%
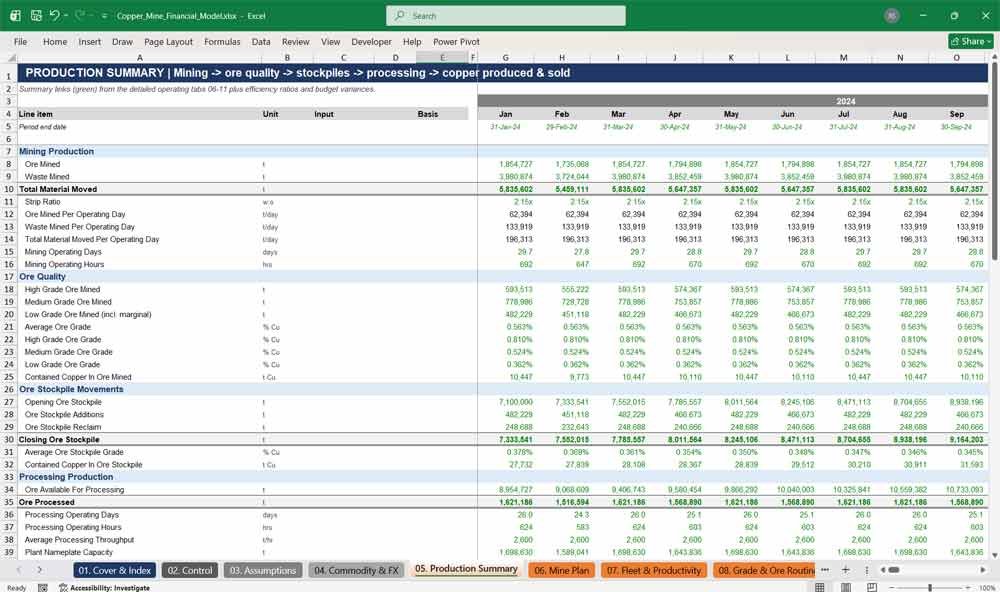
05. Production Summary
The Production Summary gives a one-page operational view of the copper mine. It covers ore and waste mined, strip ratio, ore quality, stockpile movements, plant throughput, metallurgical performance, concentrate and cathode production, payable copper, and copper sold. Production efficiency ratios and budget variances complete the picture for management reporting.
- Ore mined, waste mined and total material moved
- Head grade, recovery and recovered copper
- Payable copper in tonnes, pounds and Mlb
- Copper sales and closing inventory
- Production efficiency and budget variance lines
06. Mine Plan
The Mine Plan tab holds the life-of-mine schedule by pit and mining phase. Annual ore and waste tonnages are phased into months by calendar days. It calculates the mining calendar, material movement, strip ratio, mining productivity and capacity headroom, and reconciles plan against budget for the historical periods.
- Annual LOM inputs for Pit 1, Pit 2, Pit 3 and other pits
- Ore and waste allocation by mining phase
- Mining operating days, downtime and operating hours
- Strip ratio, tonnes per hour and capacity headroom
- Budget versus actual mine plan reconciliation
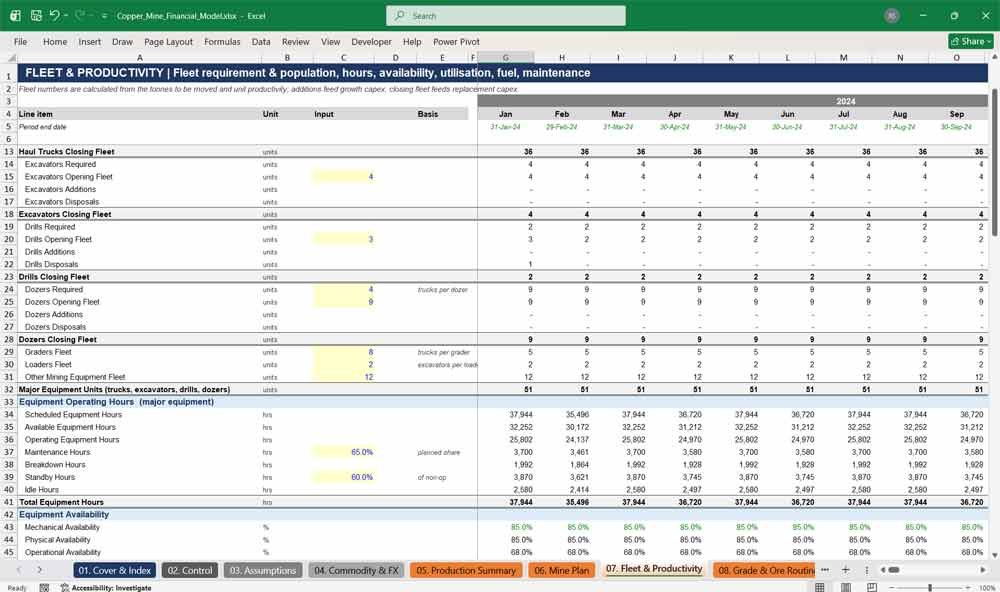
07. Fleet & Productivity
This tab calculates the mining fleet requirement from tonnes to be moved and unit productivity. It covers haul trucks, excavators, drills, dozers, graders and loaders. It models fleet additions and disposals, equipment hours, availability, utilisation, diesel consumption and maintenance. Fleet additions feed growth capex automatically.
- Fleet requirement driven by tonnes and productivity
- Opening, additions, disposals and closing fleet
- Mechanical, physical and operational availability
- Haul truck payload, cycle time and tonnes per hour
- Diesel and lubricant consumption by fleet category
08. Grade & Ore Routing
Grade & Ore Routing models ore by grade category: high, medium, low and marginal. It applies dilution, ore loss and grade control. Ore is routed to the mill or to stockpiles up to plant capacity. High, medium and low grade stockpiles are reclaimed in order with weighted-average grades, producing an accurate blended mill-feed grade.
- Ore tonnes, grades and contained copper by category
- Dilution, ore loss and mining recovery
- Direct mill feed versus stockpile routing
- Three stockpiles with grade and contained-copper tracking
- Ore movement and contained copper reconciliations
09. Processing
The Processing tab models the concentrator: calendar, plant capacity, availability, utilisation, throughput, head grade and copper recovery. It also covers crushing and grinding, flotation, reagent, power and water consumption, and tailings storage. A built-in expansion uplift links plant capacity to the growth capex programme.
- Plant capacity from operating hours and design throughput
- Availability, utilisation and throughput per hour or day
- Copper recovery, tailings grade and metallurgical losses
- Reagent, electricity and water consumption per tonne
- Tailings storage capacity and utilisation
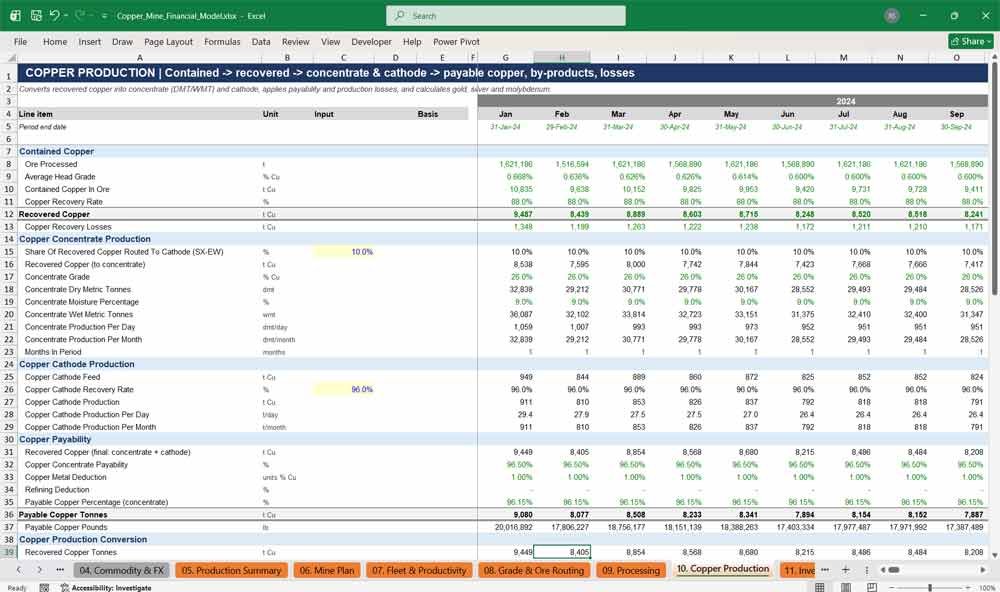
10. Copper Production
Copper Production converts recovered copper into saleable product. It calculates concentrate dry and wet metric tonnes, SX-EW cathode production, payability after metal deductions, and payable copper in tonnes and pounds. Gold, silver, molybdenum and other by-product production is included, along with production losses and a production reconciliation check.
- Concentrate DMT and WMT with moisture
- Copper cathode production (SX-EW share)
- Payable copper after metal deductions
- Gold, silver and molybdenum by-products
- Handling, transport and quality losses
Copper Mine Financial Statements
11. Inventory
The Inventory tab tracks ore stockpiles, copper concentrate, cathode, consumables and spare parts in both tonnes and value. Product inventories are valued at current production cost, and the change in value flows to the income statement. A full inventory reconciliation proves opening, additions, production, purchases, sales, consumption and closing balances.
- Stockpile tonnes, grade and contained copper
- Concentrate and cathode inventory with holding days
- Consumables and spare parts purchases versus usage
- Inventory valuation by category
- Inventory reconciliation check
12. Operating KPIs
Operating KPIs reports the key performance indicators mining executives track. It covers productivity, plant performance, metallurgical efficiency, unit mining and processing costs per tonne, and site cost per pound. It also includes C1 cash cost, AISC, labour productivity, energy and water intensity, and carbon emissions.
- C1 cash cost per pound of payable copper
- All-In Sustaining Cost (AISC) per pound
- Mining cost per tonne moved and per tonne of ore
- Processing cost per tonne milled
- Energy, water and carbon intensity KPIs
13. Mining Costs
Mining Costs builds operating costs from activity drivers. It covers drilling, blasting, loading, hauling, waste disposal, diesel, equipment maintenance, mining labour, supervision and other mining costs. Unit rates are escalated by inflation indices and adjusted by the cost scenario, giving a transparent, auditable mining cost model.
- Drill metres, explosives and ammonium nitrate costs
- Loading and hauling costs per tonne, plus tyres
- Diesel cost from litres consumed and price deck
- Equipment maintenance cost allocation
- Mining labour, contractors, supervision and support
14. Processing Costs
Processing Costs models concentrator operating costs. It covers crushing, grinding media and liners, flotation, reagents, electricity, water, plant maintenance, processing labour, laboratory, tailings management and processing support. Consumption-based drivers and price decks make every processing cost per tonne traceable back to its inputs.
- Grinding media, mill liners and crusher wear parts
- Lime, collector, frother and flocculant costs
- Electricity energy, demand and network charges
- Plant maintenance cost allocation
- Laboratory, tailings and support costs
15. Site G&A
The Site G&A tab covers general and administrative costs. It includes management, finance, HR, IT, legal, insurance, camp and accommodation, security, community relations, environmental and safety, travel, and corporate allocations. Annual budgets are escalated by inflation, adjusted by scenario and automatically stop when processing ceases.
- Over 80 detailed G&A cost lines
- Camp, catering and accommodation costs
- Insurance, security and IT budgets
- Community and government relations
- Corporate allocations, kept separate for AISC
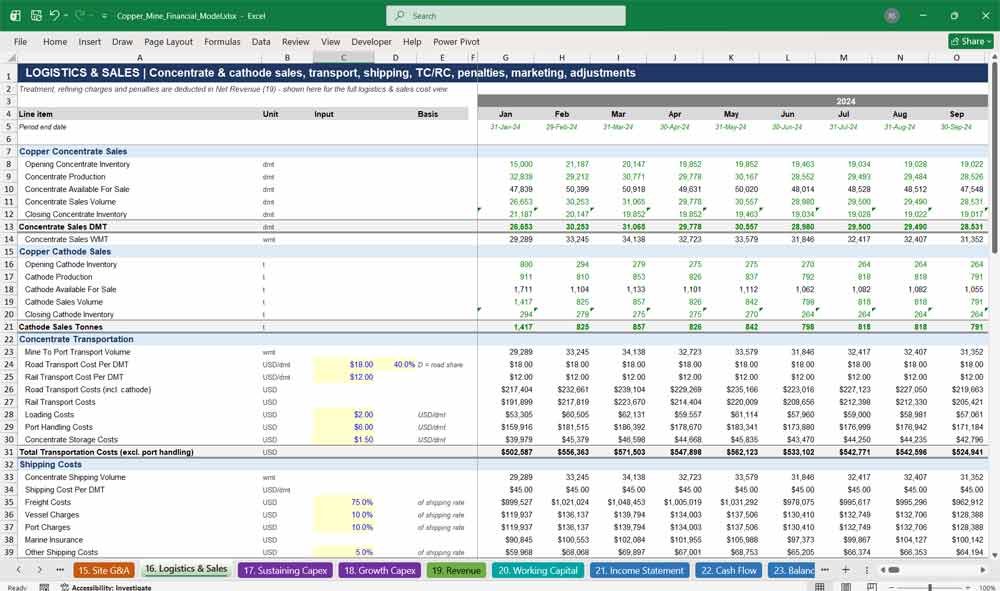
16. Logistics & Sales
Logistics & Sales models concentrate and cathode sales, mine-to-port road and rail transport, port handling, shipping and marine insurance. It also covers treatment charges, refining charges, quality penalties, sales and marketing, and commercial adjustments. These include provisional pricing, final settlement and quotational period effects.
- Concentrate sales in DMT and WMT
- Road and rail transport and port handling costs
- TC/RC calculations with escalation
- Arsenic, lead, mercury and moisture penalties
- Provisional pricing and final settlement adjustments
17. Sustaining Capex
Sustaining Capex calculates fleet replacement from closing fleet, useful life and unit cost. It also covers equipment overhauls, processing plant capital, tailings and water infrastructure, site infrastructure, progressive rehabilitation, health and safety, IT, and other sustaining capital. A summary tracks approved, committed, forecast and uncommitted spend.
- Fleet replacement driven by fleet size and useful life
- Overhauls, engine and transmission replacements
- Plant, tailings and water infrastructure capital
- Progressive mine rehabilitation by hectare
- Approved versus committed versus forecast summary
18. Growth Capex
Growth Capex manages expansion projects across mine expansion, processing expansion, tailings and water, infrastructure, and technology and automation. Each project has a budget, start year and duration, and spend is phased and escalated automatically. Project budget, forecast-to-complete, contingency and cash-flow tracking support capital project control.
- Over 30 expansion projects with budget, start year and duration
- Plant capacity expansion linked to throughput uplift
- Autonomous haulage and fleet automation
- Project contingency and milestone payments
- Forecast-to-complete and final cost variance
19. Revenue
The Revenue tab calculates gross copper revenue from payable copper sold at the realised price: LME plus premium less discount. It deducts treatment charges, refining charges and commercial deductions to reach net revenue. It adds gold, silver and molybdenum by-product credits, and calculates royalties and revenue per pound.
- Payable copper sold from concentrate and cathode
- Realised copper price per tonne and per pound
- TC/RC and commercial deductions
- By-product revenue for gold, silver and molybdenum
- Royalties and budget versus actual revenue reconciliation
20. Working Capital
Working Capital calculates receivables, payables, accrued expenses, inventory, prepayments, other receivables, tax payable and royalty payable using the days method. The method works consistently for monthly and annual periods. Net working capital and its cash flow impact link directly to the cash flow statement and balance sheet.
- Accounts receivable and concentrate receivables
- Accounts payable by supplier category
- Payroll, contractor, utility and maintenance accruals
- Tax and royalty payables
- Net working capital and cash flow impact check
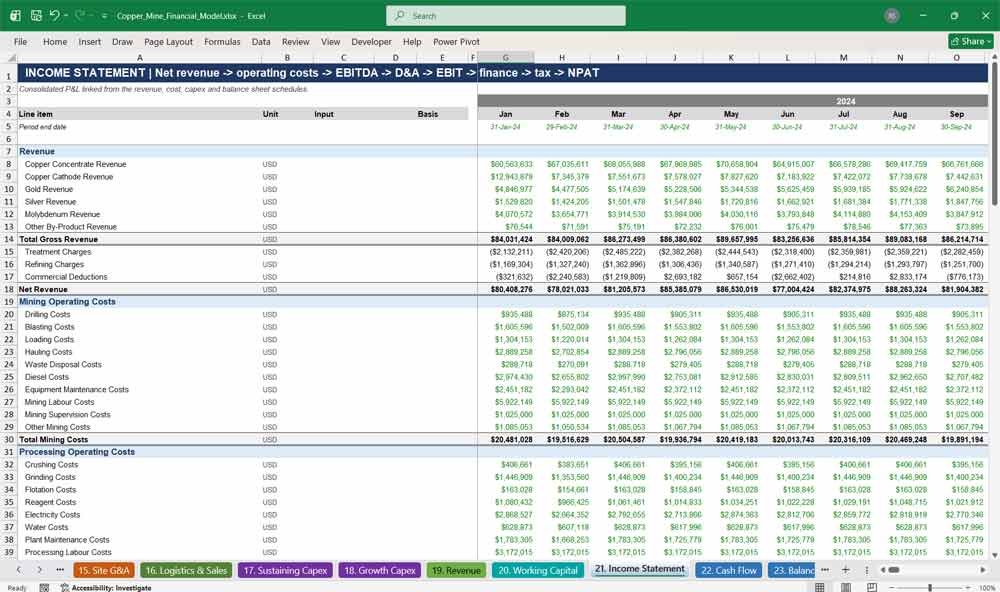
21. Income Statement
The Income Statement presents net revenue, mining, processing, G&A and logistics costs, then EBITDA and EBITDA margin. It continues through depreciation by asset class, EBIT, finance costs, rehabilitation provision unwinding, tax losses, corporate income tax and withholding tax, down to net profit after tax.
- Revenue from concentrate, cathode and by-products
- EBITDA and EBITDA margin
- Depreciation by fleet, plant, infrastructure and development
- Interest, financing fees and FX
- Tax with loss carry-forward and net profit margin
22. Cash Flow
The Cash Flow statement uses the indirect method from EBITDA. It covers interest, tax and royalty payments, working capital changes, closure spend, sustaining and growth capex by category, debt drawdowns and repayments, lease payments and dividends. It reconciles opening to closing cash in every period.
- Operating cash flow from EBITDA
- Capex split by sustaining and growth category
- Debt, lease and dividend cash flows
- Dividends limited to available cash
- Free cash flow and cash reconciliation
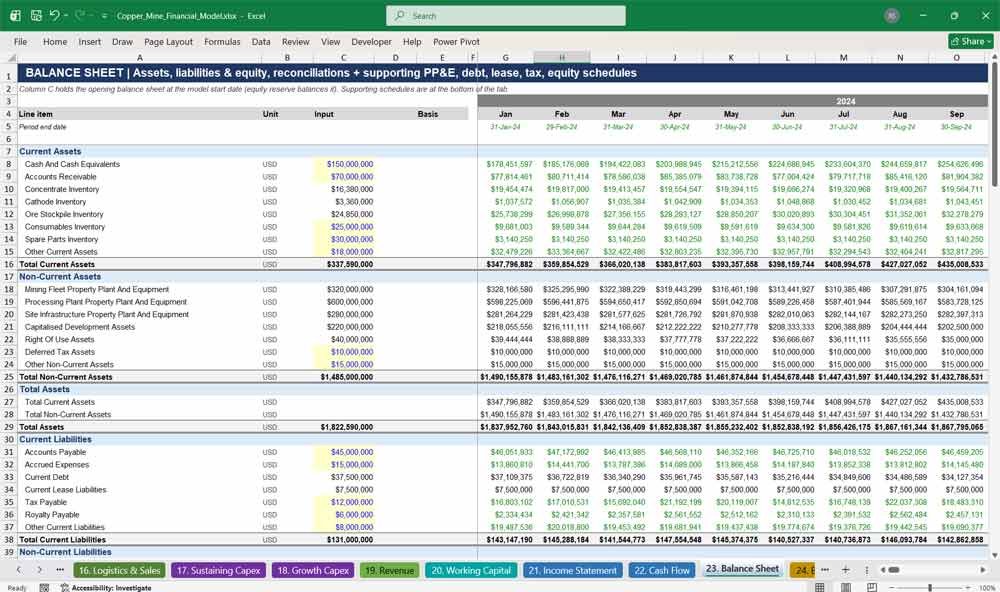
23. Balance Sheet
The Balance Sheet presents current and non-current assets, liabilities and shareholders’ equity, with an opening balance sheet at the model start date. Supporting schedules cover PP&E, right-of-use assets, leases, debt, tax losses, rehabilitation provision and equity. Balance sheet, cash and retained earnings checks prove the model balances in every period.
- Opening and closing balance sheet in every period
- PP&E roll-forward by asset class
- Debt, lease and rehabilitation provision schedules
- Retained earnings and dividend tracking
- Balance sheet check: zero difference in every period
KPIs For A Copper Mine
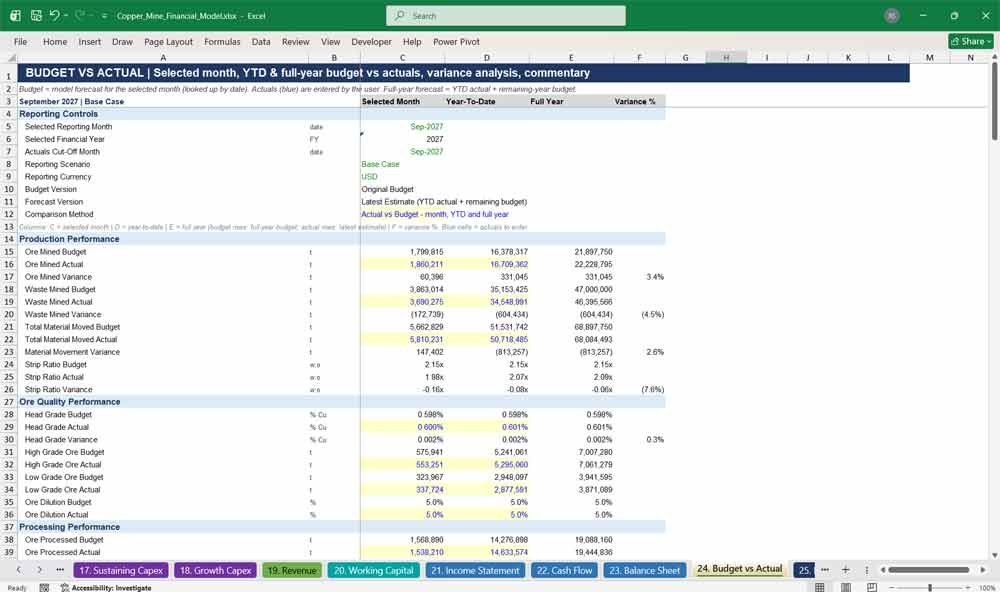
24. Budget vs Actual
The Budget vs Actual tab delivers monthly management reporting. Select a reporting month to compare actuals against budget for the month, year-to-date and full year. It covers production, grade, recovery, prices, costs, revenue, EBITDA, capex and cash flow, with an EBITDA variance bridge and management commentary.
- Month, year-to-date and full-year comparisons
- Latest estimate: YTD actual plus remaining budget
- Volume, price, grade and recovery variances
- EBITDA variance bridge
- Management commentary and key risks
25. Dashboard
The Dashboard brings together 15 model integrity checks and annual executive KPIs for every year. It shows NPV of free cash flow, life-of-mine highlights, and charts for payable copper, C1 cash cost and AISC against copper price, and EBITDA against free cash flow. It is ready for board packs and investment committees.
- 15 PASS/REVIEW integrity checks
- Annual summary of production, revenue, EBITDA and cash
- NPV and life-of-mine highlights
- C1 and AISC versus copper price chart
- Year-by-year model check status
Why Buy This Model
Building a credible copper mine financial model from scratch can take weeks of specialist work, and a single broken link can undermine an investment decision. This template gives you a professionally structured, fully integrated mining model that is ready to use today. It runs from mine plan to balance sheet, with monthly budgeting, a 20-year life-of-mine forecast, C1 and AISC reporting, scenario analysis and Budget vs Actual reporting. Every number is formula-driven, colour-coded and documented, and 15 built-in checks prove the model balances in every period. Simply replace the illustrative inputs with your own mine plan, grades, costs and price deck. You get a lender-ready model you can present with confidence to management, boards, banks and investors.
Copper Mining Frequently Asked Questions
Is this model suitable for an operating mine or a new project?
It is designed for an operating open-pit copper mine, with 3 years of historical actuals, a monthly budget year and a 20-year forecast. It can also be adapted for a mine nearing production: enter your opening balance sheet and mine schedule, and set historical inputs to your latest actuals.
Can I use it for gold, zinc or other metals?
The model is built around copper concentrate and cathode, and it already includes gold, silver and molybdenum by-products. Polymetallic or gold-dominant operations would need some adaptation of the payability and revenue logic. The mining, processing, cost, capex and financial statement structure applies to most open-pit operations.
How do I change the start date of the model?
Change the Model Start Date on the 02. Control tab. Every date, year heading, month label, escalation index and budget lookup updates automatically, including for non-calendar financial years such as July to June.
Does the model contain macros or VBA?
No. It is a pure formula model with no macros, VBA or circular references, so it is fully transparent and easy to audit.
Which version of Excel do I need?
Microsoft Excel 2010 or later, including Microsoft 365, on Windows or Mac. It uses standard functions only, such as SUMIFS, INDEX/MATCH and EOMONTH.
Is the data in the model real?
No. The model ships with illustrative inputs for a roughly 20 Mtpa open-pit copper-gold operation, so you can see how it works. Replace the blue input cells with your own mine plan, grades, recoveries, costs and price assumptions.
How do I run scenarios?
Select Base, Upside, Downside or Management Case on the Control tab. You can also override the commodity price, production, operating cost, capex or FX scenario individually. Sensitivity inputs let you flex copper, diesel and electricity prices.
Does it calculate C1 cash cost and AISC?
Yes. The Operating KPIs tab calculates C1 cash cost per pound and All-In Sustaining Cost per pound of payable copper every period. The Dashboard charts both against the copper price.
How does Budget vs Actual reporting work?
Choose a reporting month on the Control tab. The model looks up the budget for that month, year-to-date and full year. You enter actuals in the blue cells, and the tab calculates variances, a latest-estimate full-year forecast and an EBITDA variance bridge.
How do I know the model is working correctly?
The Dashboard runs 15 integrity checks across every period. These include the balance sheet, cash flow, retained earnings, working capital, ore and copper reconciliations, inventory, debt and capex, plus an error check. Each shows PASS or REVIEW, with an overall model status on the Cover.
Can I change the mine plan and stockpile strategy?
Yes. Annual ore and waste tonnages by pit, grade-category shares and phase allocations are inputs on the Mine Plan tab. The stockpiling and reclaim logic responds automatically to your mine plan and plant capacity.
Can lenders and investors use this model?
Yes. It follows bankable modelling standards: colour-coded inputs, consistent formulas, a clear model flow, supporting schedules and visible tie-out checks. It produces the outputs banks and investors expect, including NPV, free cash flow, debt balances and AISC.
Can I edit and customise the model?
Yes. The workbook is fully unlocked, so you can add pits, cost lines, projects or reports to suit your operation.
Further Reading
Optimize your project valuation and forecasting with this professional Coal Mine Financial Model. Designed specifically for mining operators and investors, this comprehensive template includes pre-built tabs for production scheduling, capital expenditure tracking, and cash flow analysis to ensure accurate economic evaluations.
- Accelerate your project analysis and investment decisions with this comprehensive Iron Ore Mining Financial Model. This production-ready template streamlines your evaluation process with integrated modules for grade-tonnage curves, logistical shipping costs, life-of-mine forecasting, and detailed NPV/IRR calculations.
Final Notes on the Financial Model
This 20 Year Coal Mine Financial Model Template must focus on balancing capital expenditures with steady revenue growth from diversified commodity mining. By optimizing operational costs, power efficiency, and maximizing high-margin services, this model helps to ensure sustainable profitability and cash flow stability.