
Coal Mine Financial Model Excel Template
A coal mine financial model in Excel built for underground longwall operations that produce metallurgical (coking) and thermal coal. The 26-tab workbook runs every number from mine development and longwall production through coal processing, sales and royalties. From there it builds an integrated Income Statement, Balance Sheet and Cash Flow Statement. Three years of monthly historicals sit alongside a 20-year forecast: the first five years are monthly with annual roll-ups, and years six to twenty are annual. That makes it suitable for budgeting, mine planning, lender reporting and long-term valuation.
20-Year Financial Model for a Coal Mine
This coal mining financial model template is fully formula-driven, with roughly 199,000 live formulas and no hard-coded results. Change the start date on the Assumptions tab and every date, period label, escalation index and financial year in the workbook updates automatically. Inputs are colour-coded (blue on yellow), calculations are black and cross-tab links are green, so you can see straight away which cells are safe to edit. Built-in integrity checks confirm the balance sheet balances and cash reconciles in every period.
Whether you are a mine owner, CFO, mining engineer, lender, consultant or investor, this underground coal mine model gives you a bankable, lender-ready structure without building from scratch. Model ROM tonnes, yields, realised coal prices, mining opex per tonne, tiered royalties, capital expenditure, depreciation, tax, debt covenants and closure provisions. Then test the results with live scenarios, sensitivity tables, break-even analysis, NPV, IRR and payback.
What’s Inside: Tab-by-Tab Overview
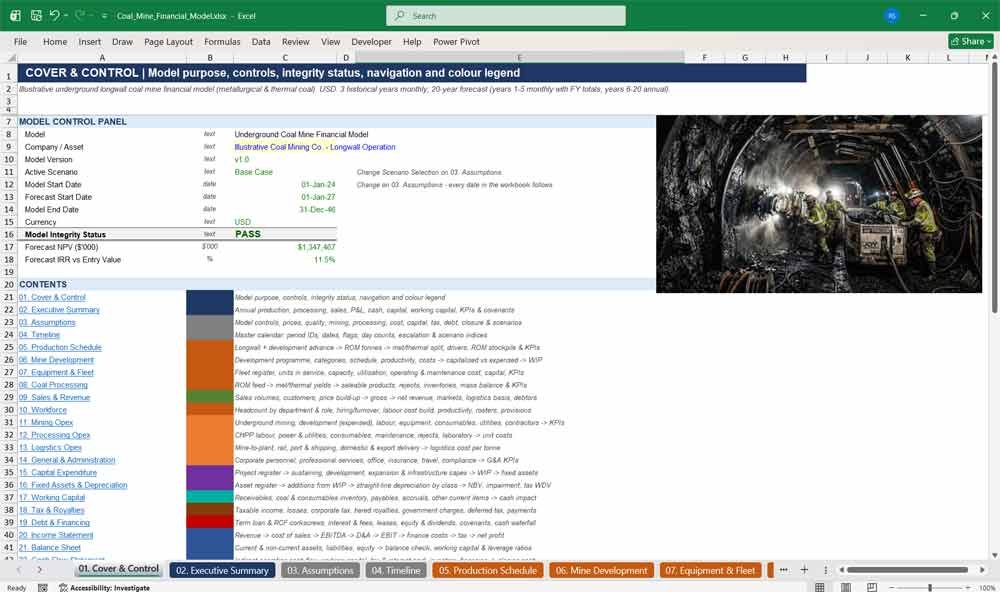
01. Cover & Control
The Cover & Control tab is the model’s command centre. It shows the active scenario, model dates, currency, forecast NPV, IRR and a single integrity status that turns PASS when every check ties. A hyperlinked contents list, colour legend and tab-colour key make this coal mining Excel model easy to navigate and audit.
- Model control panel with scenario, version and key dates
- Overall integrity status linked to the Dashboard checks
- Hyperlinked table of contents for all 26 tabs
- Input, calculation, link and check colour legend
02. Executive Summary
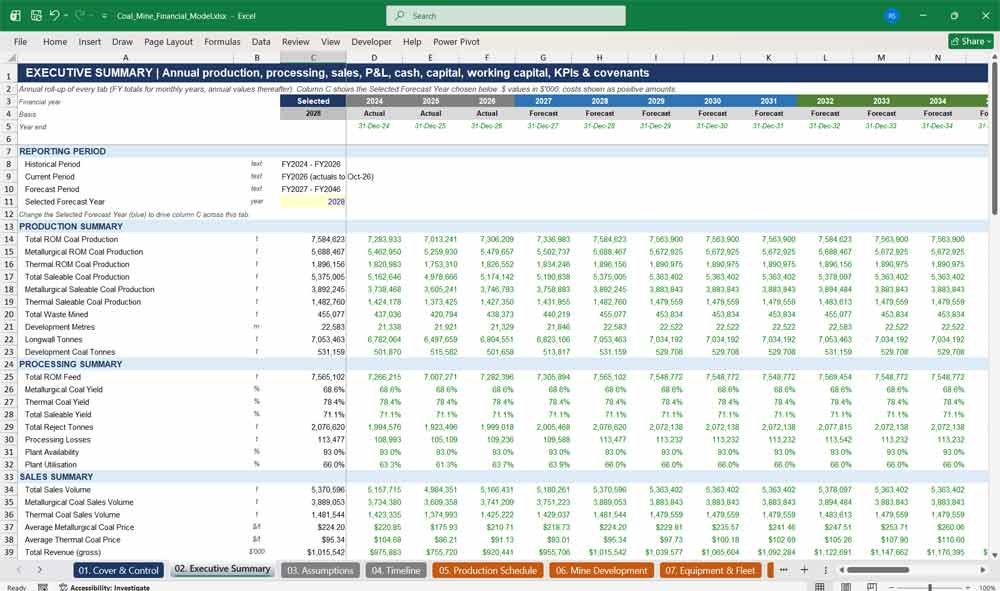
The Executive Summary rolls the whole coal mine financial model into one annual view. It covers production, processing, sales, financial performance, cash flow, capital and debt, working capital, KPIs and covenants. Choose any forecast year from the drop-down to show it in a dedicated column, ready for board packs, investor updates and lender presentations.
- Annual summary for every historical and forecast year
- Selected Forecast Year drop-down drives a headline column
- Production, sales, EBITDA, NPAT, free cash flow and net debt
- Executive dashboard with 20-year forecast totals
Coal Mine Revenue & Expenses
03. Assumptions
The Assumptions tab holds every input in one place: model start date, coal benchmark prices, quality specifications, mining and processing parameters, workforce, operating cost rates, capital, working capital, tax and royalties, debt and closure. It also contains the scenario table and the annual ramp-up and closure profiles that drive the coal mine forecast.
- Single model start date drives every date in the workbook
- Met and thermal coal benchmark prices and escalation
- Detailed unit-rate tables for mining, processing, logistics and G&A
- Seven-case scenario selector with a drop-down
04. Timeline
The Timeline tab is the master calendar behind the monthly and annual forecast. Every period ID, financial year, quarter, month, day count, mining day and flag is calculated from the start date. Escalation indices, scenario factors and discount factors also live here, so all tabs share one consistent, fully dynamic horizontal timeline.
- Period numbers, IDs, financial years, quarters and months
- Historical, forecast, budget, YTD and QTD flags
- Mining, processing and maintenance day calculations
- Cost, price and capital escalation indices
05. Production Schedule
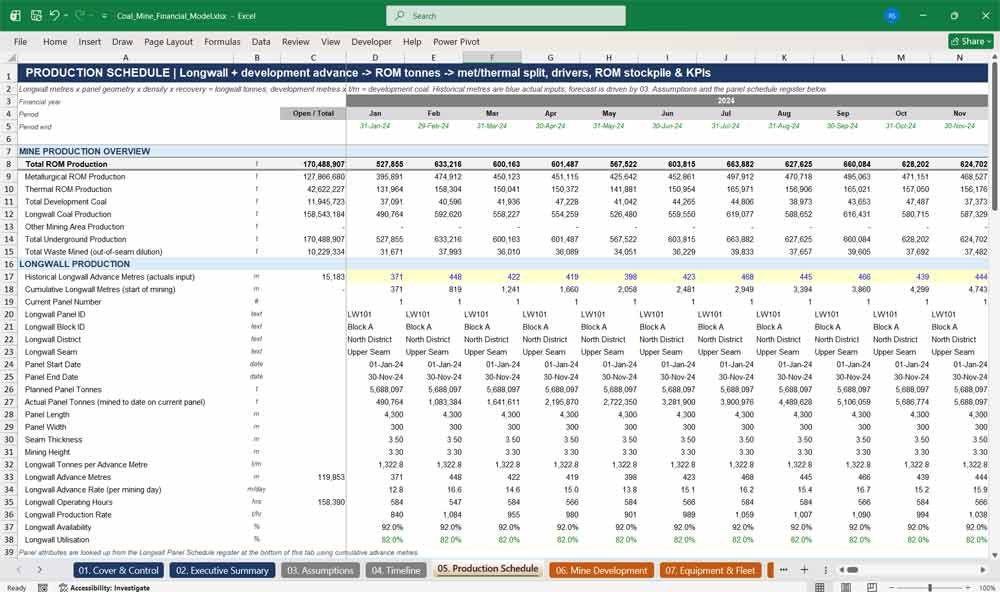
The Production Schedule converts longwall and development advance rates into ROM coal tonnes. A 28-panel longwall schedule automatically tracks the current panel ID, block, district, seam, dimensions and start and end dates. ROM is split into metallurgical and thermal feed, alongside production drivers, coal quality, a ROM stockpile reconciliation and production KPIs.
- Longwall tonnes from metres × panel geometry × density × recovery
- Development metres and development coal tonnes
- Longwall panel schedule register with automatic dating
- ROM stockpile reconciliation and capacity utilisation
06. Mine Development
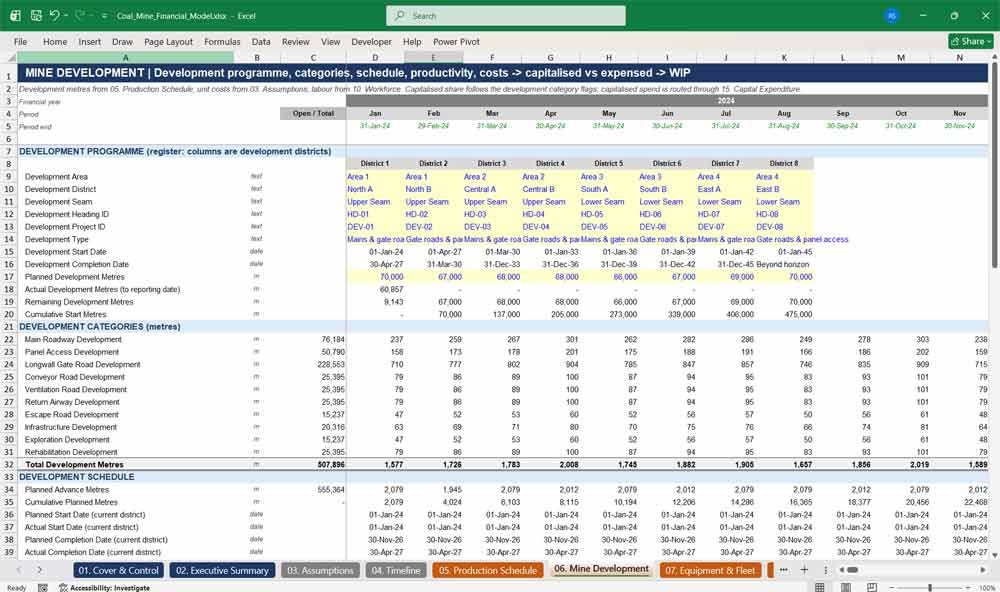
The Mine Development tab models the development programme by district and across ten roadway categories, including main roads, gate roads and return airways. It schedules planned against actual advance, calculates development productivity and builds development cost per metre. Capitalised development is separated from expensed cost and routed through capital work in progress.
- Development district register with start and completion dates
- Ten development categories with capitalisation flags
- Planned vs actual advance, delay days and completion %
- Capitalised vs expensed development reconciliation
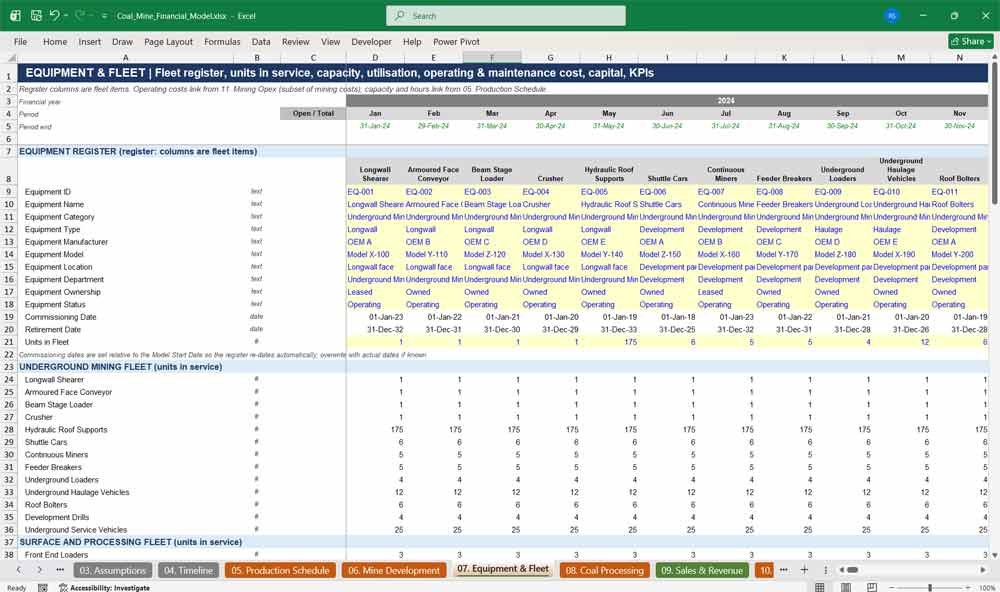
07. Equipment & Fleet
The Equipment & Fleet tab registers 26 items of underground, surface and processing fleet, from the longwall shearer and continuous miners to coal handling plant. It tracks units in service, rated and operating capacity, availability and utilisation, plus equipment operating and maintenance costs. Fleet capital costs, useful lives and equipment KPIs are included.
- Fleet register with IDs, ownership, status and dates
- Capacity, availability, utilisation and downtime hours
- Fuel, electricity, maintenance and overhaul costs
- Equipment capital, replacement cost and depreciation data
08. Coal Processing
The Coal Processing tab models the CHPP (coal handling and preparation plant). ROM feed is capped by available plant capacity, then met and thermal yields produce saleable tonnes, rejects and processing losses. It splits output into premium met, semi-soft coking, PCI and thermal products, with product inventories and a full mass balance check.
- Plant capacity, availability, utilisation and throughput
- Met and thermal yields, rejects and processing losses
- Product split across eight coal products
- Mass balance and inventory reconciliation
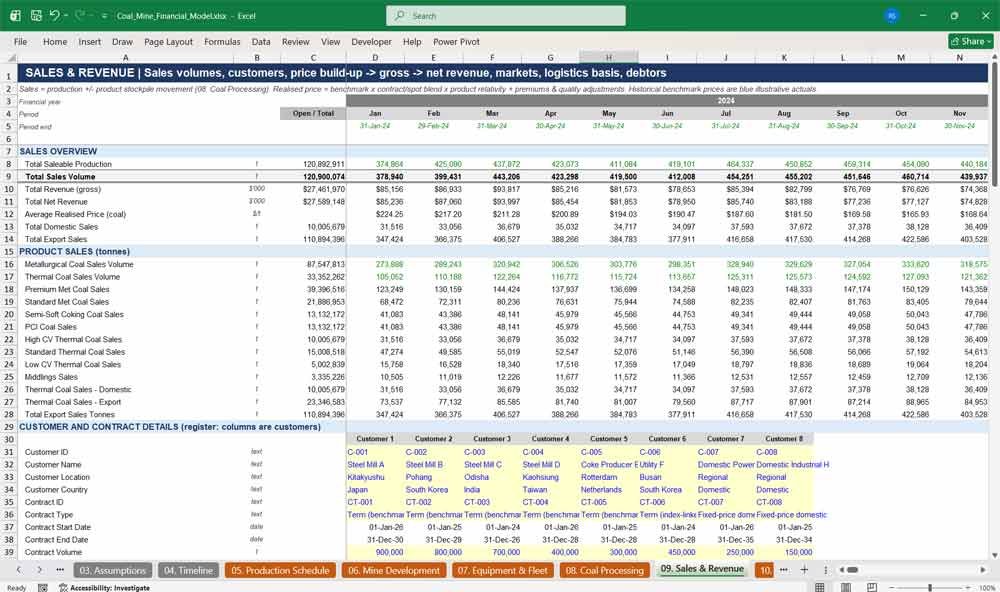
09. Sales & Revenue
The Sales & Revenue tab builds realised coal prices from benchmark prices, contract and spot blends, product relativities, quality premiums and ash, moisture, sulphur and calorific value adjustments. It calculates gross and net revenue, domestic and export splits, delivery terms, a customer contract register and accounts receivable.
- Realised price build-up for met and thermal coal
- Gross revenue to net revenue after discounts and fees
- Customer and contract register with take-or-pay volumes
- FOB, CFR, mine gate and delivered sales analysis
10. Workforce
The Workforce tab drives headcount by department and employee category, with hires, turnover and transfers. It builds total employment cost from base payroll, shift allowances, overtime, bonuses, payroll tax, superannuation and contractors, then allocates labour cost to mining, development, processing, logistics and G&A. Rosters, productivity and employee provisions are included.
- Headcount schedule with hires, departures and transfers
- Full labour cost build including oncosts and contractors
- Labour cost allocation with reconciliation check
- Workforce productivity, rosters and leave provisions
Coal Mine Financial Statements
11. Mining Opex
The Mining Opex tab calculates underground mining operating costs from drivers such as ROM tonnes, longwall tonnes and development metres, multiplied by escalated unit rates. It covers longwall, continuous miner, labour, equipment, consumables, utilities, contractors and other mining costs, and reports mining cost per ROM tonne and per saleable tonne.
- Driver-based cost pools with editable unit rates
- Expensed development costs linked from Mine Development
- Mining labour, equipment, consumables and utilities
- Mining cost per tonne and development cost per metre
12. Processing Opex
The Processing Opex tab models CHPP operating costs: plant labour, electricity, water, magnetite, flocculants, reagents, maintenance, reject and tailings handling, laboratory and quality control. Costs flow from feed tonnes, reject tonnes and fixed annual budgets, giving processing cost per ROM tonne, per saleable tonne and per operating hour.
- Processing labour from the workforce allocation
- Power, water and consumables usage rates
- Plant maintenance, reject and tailings handling costs
- Processing unit-cost KPIs
13. Logistics Opex
The Logistics Opex tab models the coal supply chain from mine to customer: mine-to-plant haulage, rail loading, rail freight, port handling, ship loading, CFR shipping freight, demurrage, and domestic and export delivery. Rates apply to the right tonnes, giving rail, road, port and shipping cost per tonne.
- Mine-to-rail, rail-to-port and port and shipping costs
- CFR freight and marine insurance on CFR tonnes only
- Domestic and export delivery costs
- Transit reconciliation and logistics cost per tonne
14. General & Administration
The General & Administration tab captures corporate overheads, including corporate personnel, professional services, office costs, insurance, corporate travel, licences and compliance, community relations and other administration. Annual budgets escalate automatically, and G&A KPIs show cost per employee, per ROM tonne, per saleable tonne and as a percentage of revenue.
- Corporate personnel split by function
- Audit, legal, tax and advisory fees
- Insurance, travel, licences and community costs
- G&A drivers and KPIs
15. Capital Expenditure
The Capital Expenditure tab holds a 31-project register covering sustaining, development, expansion and infrastructure capital. Each project has an annual budget, start and end years, contingency and escalation. It models capital work in progress, commitments, payment stages, capitalisation and the transfer to fixed assets by asset class.
- Project register with owners, dates and status
- Sustaining, development, expansion and infrastructure capex
- Capital WIP, commitments and contingency
- Capex mapped to asset classes and cash flow lines
16. Fixed Assets & Depreciation
The Fixed Assets & Depreciation tab maintains a 16-class asset register with opening cost, accumulated depreciation and remaining lives. Additions are depreciated straight-line by vintage over each class’s useful life. It covers disposals, an impairment test against recoverable amount, tax depreciation, temporary differences and a full net book value reconciliation.
- Asset register by class with useful lives
- Straight-line depreciation by vintage
- Impairment indicator and recoverable amount test
- Tax written-down value and deferred tax impact
17. Working Capital
The Working Capital tab calculates accounts receivable, coal and consumables inventory, accounts payable, accruals, prepayments, GST/VAT and other current items from days-based drivers. Coal inventory is valued at unit production cost. A working capital reconciliation feeds the cash flow movement directly into the Cash Flow Statement.
- Debtor, creditor, inventory and accrual days
- Coal inventory valued at production cost
- Other current assets and liabilities
- Working capital reconciliation and cash impact
18. Tax & Royalties
The Tax & Royalties tab calculates taxable income, tax losses carried forward, corporate tax, deferred tax assets and liabilities and tax payments. Tiered coal royalties are charged on value per tonne after deductible freight. Other government charges, royalty payments and a full tax reconciliation to the effective tax rate are included.
- Taxable income and tax loss utilisation
- Tiered royalty rates above and below a price threshold
- Deferred tax from temporary differences and losses
- Tax reconciliation and effective tax rate
19. Debt & Financing
The Debt & Financing tab models an amortising term loan and a revolving credit facility, with interest, commitment fees, financing fee amortisation, leases, equity and dividends. A cash waterfall draws the facility to protect minimum cash. Covenant tests for net debt to EBITDA, interest cover and DSCR flag any breach.
- Term loan and RCF corkscrews with balloon repayment
- Interest on opening balances, so there are no circular references
- Leases, equity and dividend policy
- Leverage, interest cover and DSCR covenant tests
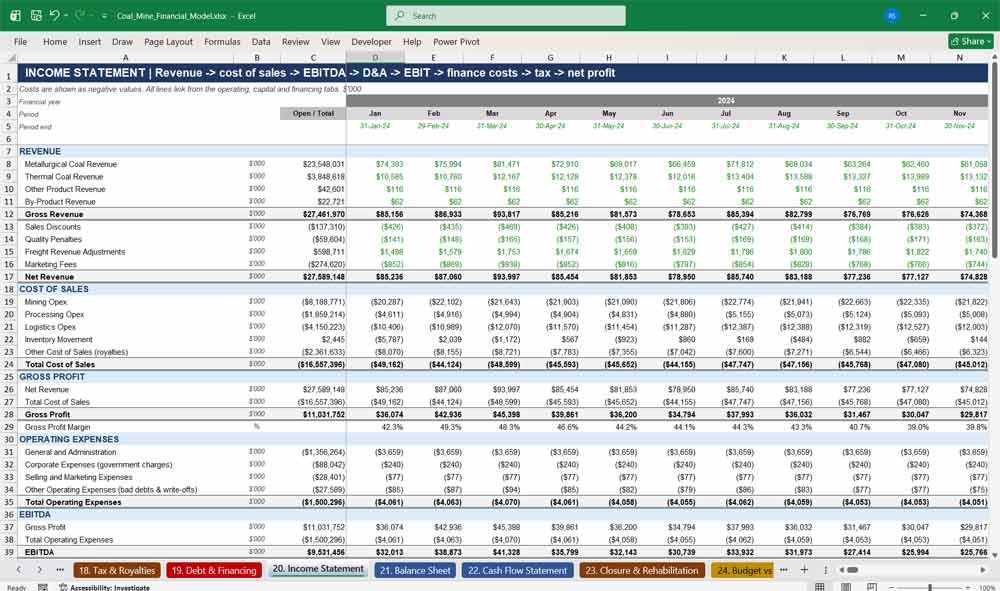
20. Income Statement
The Income Statement presents revenue, cost of sales, gross profit, operating expenses, EBITDA, depreciation and amortisation, EBIT, finance costs, tax and net profit after tax, monthly and annually. Margins, EBITDA per saleable tonne and earnings per tonne give lenders and investors a clear view of coal mine profitability.
- Revenue to net profit in a standard format
- Royalties within cost of sales
- EBITDA, EBIT and net profit margins
- EBITDA and earnings per tonne
21. Balance Sheet
The Balance Sheet reports current and non-current assets, liabilities and equity for every period, starting from an opening balance sheet at the model start date. It includes property, plant and equipment by group, capital WIP, rehabilitation assets and provisions, deferred tax and leases. A balance check, working capital ratios and leverage metrics are included.
- Full balance sheet for every month and year
- Opening balance sheet at the model start date
- Balance sheet check that ties in every period
- Current ratio, quick ratio and net debt to EBITDA
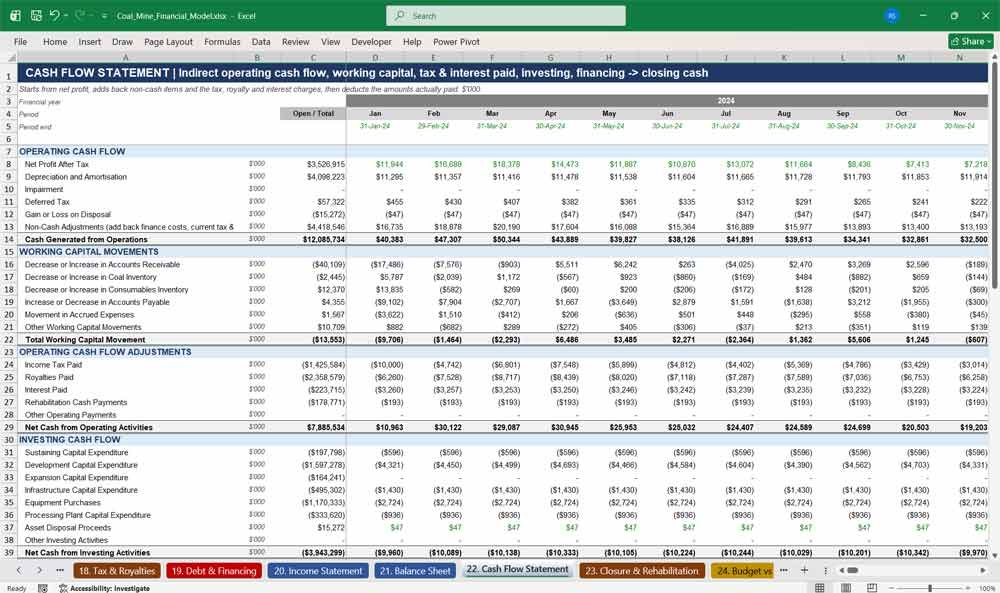
22. Cash Flow Statement
The Cash Flow Statement uses the indirect method to reconcile net profit to operating cash flow. It then shows investing and financing cash flows and closing cash. It separates tax, royalty, interest and rehabilitation payments, and reports free cash flow before and after financing, cash conversion and minimum cash headroom.
- Indirect operating cash flow with working capital movements
- Capex by sustaining, development, expansion, equipment and plant
- Free cash flow before and after financing
- Cash check against the Balance Sheet
Key Model Components For A Coal Mine
23. Closure & Rehabilitation
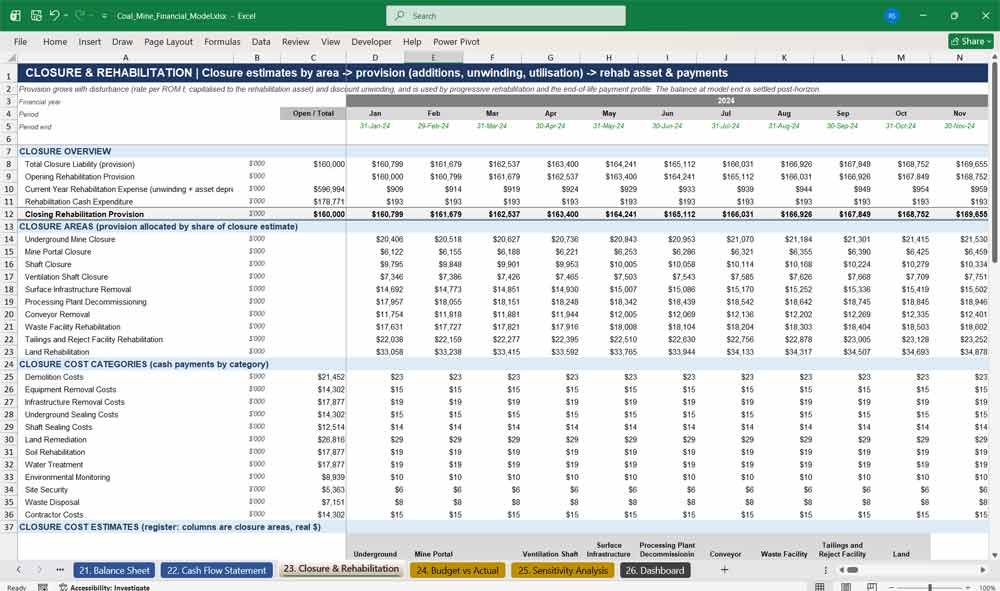
The Closure & Rehabilitation tab estimates closure costs for ten areas, from underground sealing to tailings and land rehabilitation. It builds the rehabilitation provision with new disturbance, discount unwinding and utilisation, and adds a rehabilitation asset, payment profile, closure schedule and closure KPIs such as cost per tonne and per hectare.
- Closure cost estimate register with contingency
- Provision roll-forward with discount unwinding
- Progressive and end-of-life closure payments
- Closure cost per ROM tonne and per hectare
24. Budget vs Actual
The Budget vs Actual tab compares budget drivers with actuals or the latest forecast for any selected financial year. It covers production, processing, sales, mining, processing and logistics opex, G&A, capex and financials, and includes an EBITDA variance bridge covering price, volume, yield, mix, labour, fuel, electricity, maintenance and contractors.
- Selectable financial year with actual or forecast basis
- Budget vs actual for operations, costs and capex
- EBITDA variance bridge that reconciles to the total
- Management commentary and action tracking
25. Sensitivity Analysis
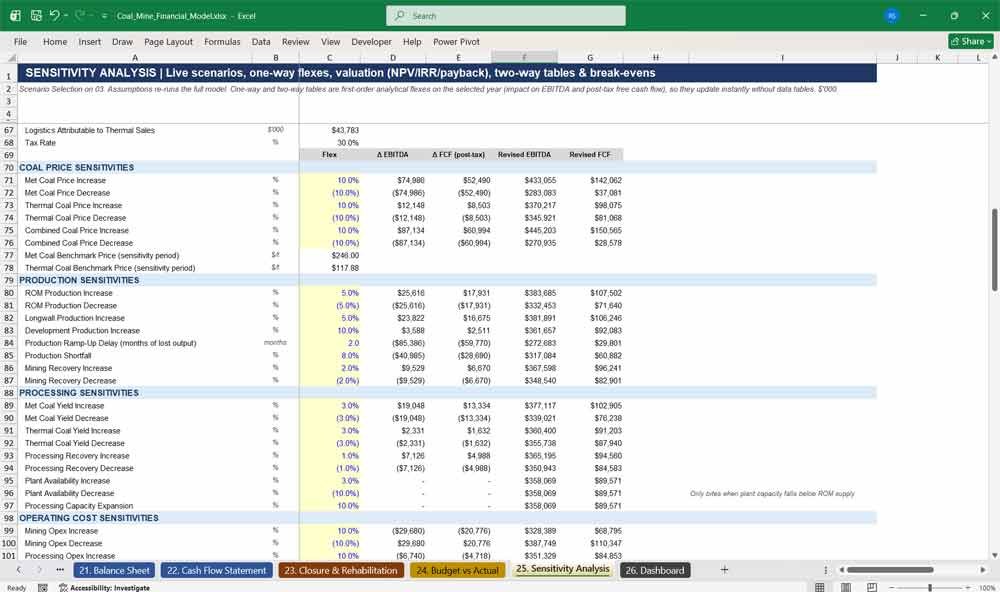
The Sensitivity Analysis tab tests coal price, production, yield, cost, capital and financial sensitivities, showing the impact on EBITDA and free cash flow. It reports NPV, IRR and payback, includes seven two-way sensitivity tables, and calculates break-even met and thermal coal prices, break-even production and covenant headroom.
- One-way sensitivities with editable flex inputs
- NPV, IRR and payback period
- Seven two-way sensitivity tables
- Break-even prices, production, yield and mining cost
26. Dashboard
The Dashboard tab runs 13 model integrity checks for every year and shows each as PASS or REVIEW. They cover the balance sheet, cash, mass balance, cost tie-outs and the asset, working capital, tax and debt reconciliations. Five charts show revenue, EBITDA, production, cash, net debt, unit costs and coal prices over time.
- 13 automated integrity and covenant checks
- PASS / REVIEW status by year with colour coding
- Overall model status feeding the Cover tab
- Five ready-made charts for presentations
Why Buy This Coal Mine Financial Model?
Building a credible coal mining financial model from scratch can take weeks and still leave gaps that lenders and investors will find. This model gives you a complete, integrated and audit-friendly structure from day one: 26 tabs, a monthly and annual horizontal timeline, three statements that balance in every period, and the operational detail coal professionals expect. That detail includes longwall panel scheduling, CHPP yields, tiered royalties, capitalised development and closure provisions. Every forecast is driven by clearly marked inputs, every date updates from one start date, and live checks show at a glance whether the model is working. Replace the illustrative inputs with your site data and you have a decision-ready model for budgeting, financing, valuation and board reporting.
Coal Mining Frequently Asked Questions
Is this model suitable for an open-cut (surface) coal mine?
It is designed for underground longwall operations, so the production logic is built around longwall and development metres. The processing, sales, royalty, cost, capital and financial statement sections apply to any coal mine. An open-cut operation would need its production drivers changed to strip ratio and BCM-based mining.
Can I model both metallurgical and thermal coal?
Yes. The model splits ROM coal into met and thermal feed and applies separate yields. It produces eight products, including premium hard coking coal, semi-soft, PCI and high, standard and low CV thermal coal, and prices each product separately.
Can I change the start date and forecast period?
Yes. Change the Model Start Date on the Assumptions tab and every date, period label, financial year and escalation index in the workbook updates automatically. The financial year follows the start month, so a July start gives a July to June financial year.
What is the forecast horizon?
Three years of monthly historicals, then a 20-year forecast. Years 1 to 5 are monthly with an annual roll-up column, and years 6 to 20 are annual.
Do I need advanced Excel skills or macros?
No. The model uses standard Excel formulas only, with no macros and no circular references. Inputs are blue on yellow, so you always know which cells to change.
Will lenders and investors accept this format?
The model follows bankable modelling conventions: separated inputs, consistent formulas, colour coding, a balancing Balance Sheet, a reconciled Cash Flow Statement, covenant tests, and a Dashboard of integrity checks for every year.
Can I run different scenarios?
Yes. A drop-down selector switches the whole model between seven cases: Base, Upside, Downside, High Price, Low Price, High Production and Low Production. The Sensitivity Analysis tab adds one-way and two-way flexes, break-even analysis, NPV and IRR.
Does it include royalties and tax?
Yes. Tiered royalties are calculated on value per tonne after deductible freight. Corporate tax covers tax losses carried forward, tax depreciation and deferred tax, and a full reconciliation to the effective tax rate is included.
Can I enter my actual historical results?
Yes. Historical longwall metres, development metres and benchmark coal prices are input rows, and the Budget vs Actual tab compares your budget with actuals for any selected year, including an EBITDA variance bridge.
What currency is the model in?
The model reports in USD. Monetary time-series are stored in whole dollars and displayed in thousands. You can relabel the reporting currency on the Assumptions tab and enter inputs in your own currency.
Are the numbers in the model real data?
No. The inputs are realistic illustrative values for an underground longwall operation, so you can see the model working straight away. Replace them with your own mine plan, costs and prices.
How does the model handle mine closure?
Closure costs are estimated by area with contingency, and a rehabilitation provision grows with disturbance and discount unwinding. Progressive and end-of-life payments are modelled, along with the rehabilitation asset and its depreciation.
Can I add more longwall panels, projects or customers?
Yes. The longwall panel schedule, development districts, capital project register, equipment fleet and customer contracts are register tables with editable inputs. You can extend the existing structure to add more items.
Further Reading
Maximize your asset evaluation and investment analysis with this institutional-grade Copper Mine Financial Model. This specialized template features dynamic inputs for grade recovery, smelting and refining charges (TC/RCs), byproduct credits (like gold or molybdenum), and multi-scenario cash flow forecasting to accurately assess project economics.
- Accelerate your project analysis and investment decisions with this comprehensive Iron Ore Mining Financial Model. This production-ready template streamlines your evaluation process with integrated modules for grade-tonnage curves, logistical shipping costs, life-of-mine forecasting, and detailed NPV/IRR calculations.
Final Notes on the Financial Model
This 20 Year Coal Mine Financial Model Template must focus on balancing capital expenditures with steady revenue growth from diversified commodity mining. By optimizing operational costs, power efficiency, and maximizing high-margin services, this model helps to ensure sustainable profitability and cash flow stability.