
Mining Company Financial Model Template
20-Year Financial Model for a Mining Company
Built around industry-standard mine economics, this mining project finance model covers everything from resources and reserves, mine planning, and metallurgical recovery through to the full copper concentrate sales waterfall, royalties and streaming, project debt sculpting, and progressive closure and rehabilitation provisioning. A live Scenario Manager toggles Base, Upside, and Downside commodity price cases across every downstream tab, making it equally useful for investment committee presentations, lender due diligence, equity research, corporate development teams, and mining finance students learning how a real mine cash flow model is built.
Why This Model
Every formula in this mining company financial model is fully linked and auditable, with colour-coded inputs, formulas, and cross-sheet links, a balance sheet that ties to zero in every period, and a dashboard summarising NPV, IRR, and production KPIs at a glance. Whether you’re valuing a copper porphyry development, benchmarking project economics, or training analysts on mining finance fundamentals, this template gives you a credible, bank-grade starting point you can adapt with your own resource, cost, and price assumptions in minutes.
Model Tab Highlights
1. Cover & Control
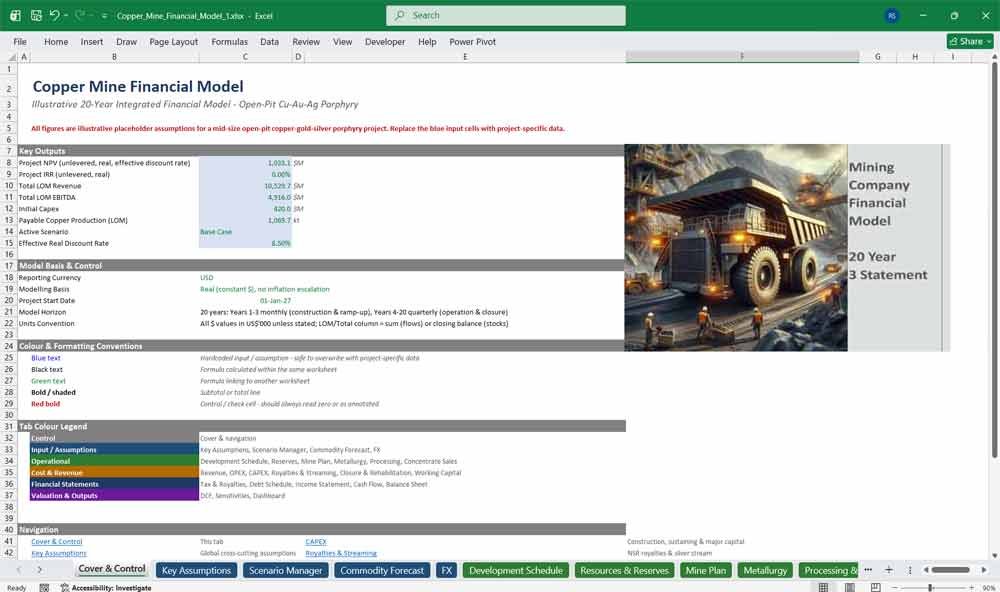
The Cover & Control tab is the navigation hub of this mining financial model, summarising headline NPV, IRR, and production outputs alongside model basis and colour-coding conventions. It’s the fastest way to orient new users inside a 25-tab mining valuation model.
- One-click hyperlinked navigation to all 25 tabs
- Headline NPV, IRR, revenue, EBITDA, and capex at a glance
- Colour-coding legend (input, formula, link, total, control cell)
- Tab-colour legend mapped to model sections
- Model basis, currency, and 20-year horizon summary
2. Key Assumptions
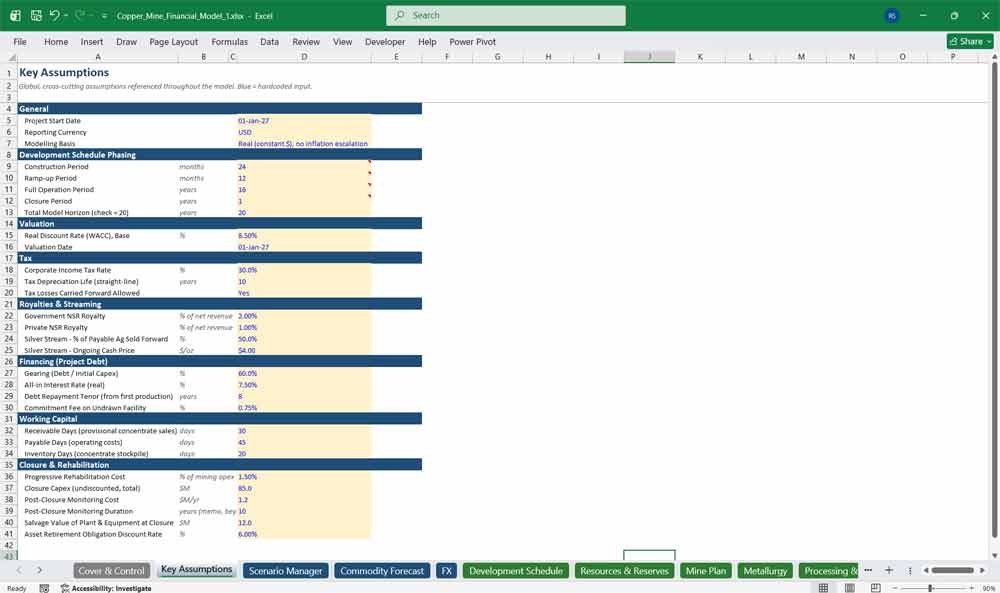
The Key Assumptions tab centralises every global input driving this mining company financial model — currency, units, tax rate, discount rate, and modelling basis — so analysts update core mine economics assumptions once and flow changes through the entire 20-year valuation model instantly.
- Single source of truth for global model inputs
- Real-terms (constant dollar) modelling basis clearly flagged
- Currency, unit, and reporting convention control
- Feeds every downstream operational and financial tab
- Blue-coded input cells for fast assumption updates
Mining Company Revenue – Forecasting
4. Commodity Forecast
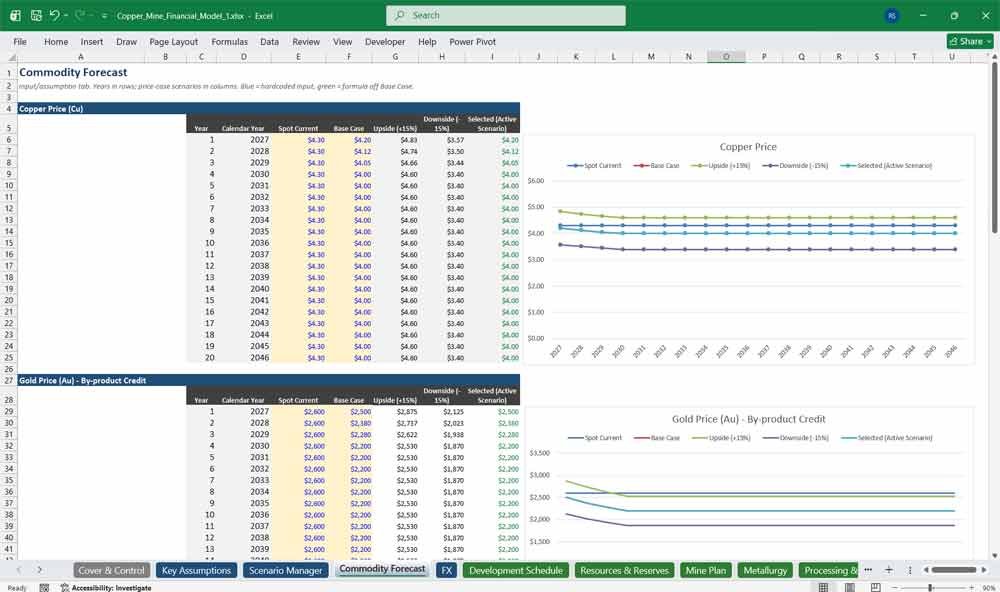
The Commodity Forecast tab is the pricing engine of this mining financial model, presenting 20-year copper, gold, silver, TC, and RC price decks with Spot, Base, Upside, and Downside columns — the assumption backbone behind every revenue and concentrate sales calculation.
- Years-in-rows, scenario-in-columns commodity price structure
- Copper, gold, silver, TC, and RC price decks
- Spot Current, Base Case, Upside, and Downside cases
- Directly linked to Scenario Manager’s active case selector
- Drives Concentrate Sales, Revenue, and DCF outputs
5. FX
The FX tab translates local-currency mining operating costs into USD, giving this mining company financial model realistic multi-currency cost exposure. A 20-year exchange rate deck and a labour/power versus imported-cost split let users stress-test currency risk within the broader mine economics model.
- 20-year local-currency FX rate assumption
- USD versus local-currency opex cost split
- Scenario-linked FX rate for Base/Upside/Downside cases
- Real-terms FX treatment (no inflation drift)
- Feeds OPEX cost translation directly
6. Development Schedule
The Development Schedule is the master timeline engine of this mining financial model, sequencing 104 periods — 36 months of construction and ramp-up followed by 68 operating quarters — across a 20-year mine life, with every other tab referencing this schedule by column.
- 104-period master timeline (36 monthly + 68 quarterly)
- Construction, ramp-up, operation, and closure phase flags
- Human-readable period-date header row on every linked tab
- Mid-period discount convention support
- Single source of period logic for the entire model
7. Resources & Reserves
The Resources & Reserves tab presents a JORC/NI 43-101-style Mineral Resource and Ore Reserve statement underpinning this copper mining financial model, detailing measured, indicated, and inferred tonnages plus proven and probable reserves at defined copper, gold, and silver grades and cut-off assumptions.
- JORC/NI 43-101-style resource and reserve categories
- Copper, gold, and silver grade disclosure
- Modifying factors and cut-off grade assumptions
- Reserve base directly feeds the Mine Plan tab
- Transparent resource-to-reserve conversion basis
8. Mine Plan
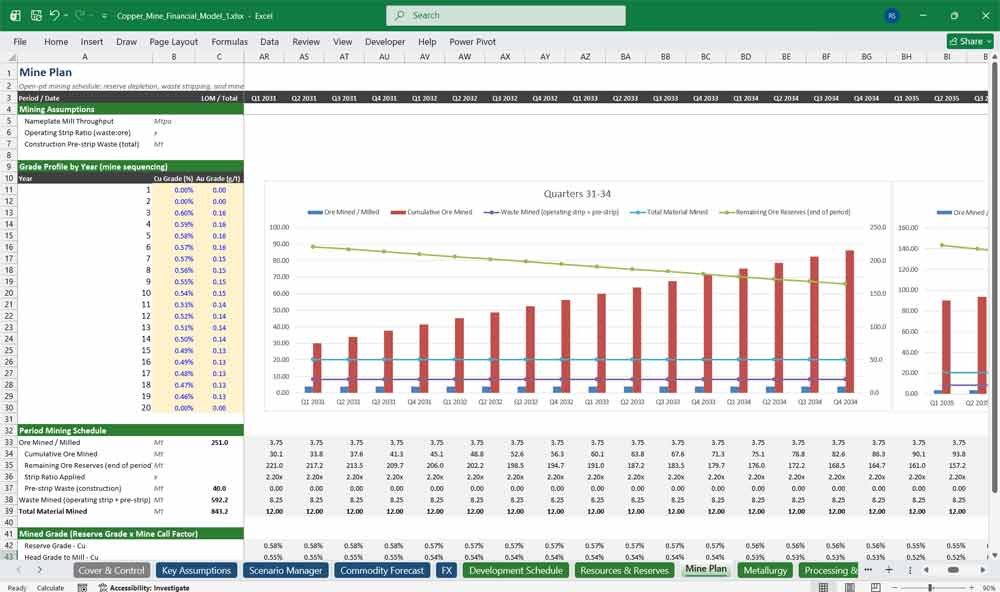
The Mine Plan tab sequences reserve depletion, waste stripping, and mined grade over the mine life, giving this mining valuation model a realistic production profile. Strip ratio and grade-by-year tables keep ore feed assumptions fully auditable across all 104 modelled periods.
- Period-by-period reserve depletion and cumulative mining
- Strip ratio and waste tonnes scheduling
- Grade profile by year (mine sequencing)
- Scenario Manager grade multiplier fully linked
- Reserves deplete to zero exactly at end of mine life
Mining Company Production & Sales
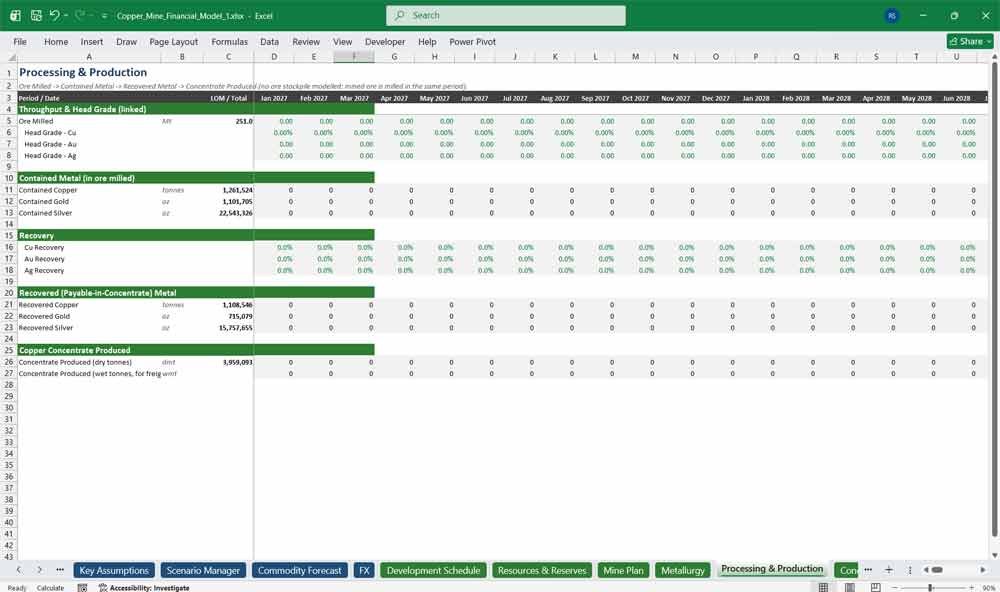
10. Processing & Production
The Processing & Production tab converts ore milled into contained, recovered, and concentrate metal, forming the operational core of this mining company financial model. It links throughput, head grade, and recovery assumptions into a single production chain feeding revenue and concentrate sales calculations.
- Ore Milled → Contained Metal → Recovered Metal → Concentrate chain
- Throughput and head grade fully period-linked
- Copper, gold, and silver production tracked together
- Concentrate tonnes (dry and wet) calculated
- No stockpile assumption keeps the model transparent
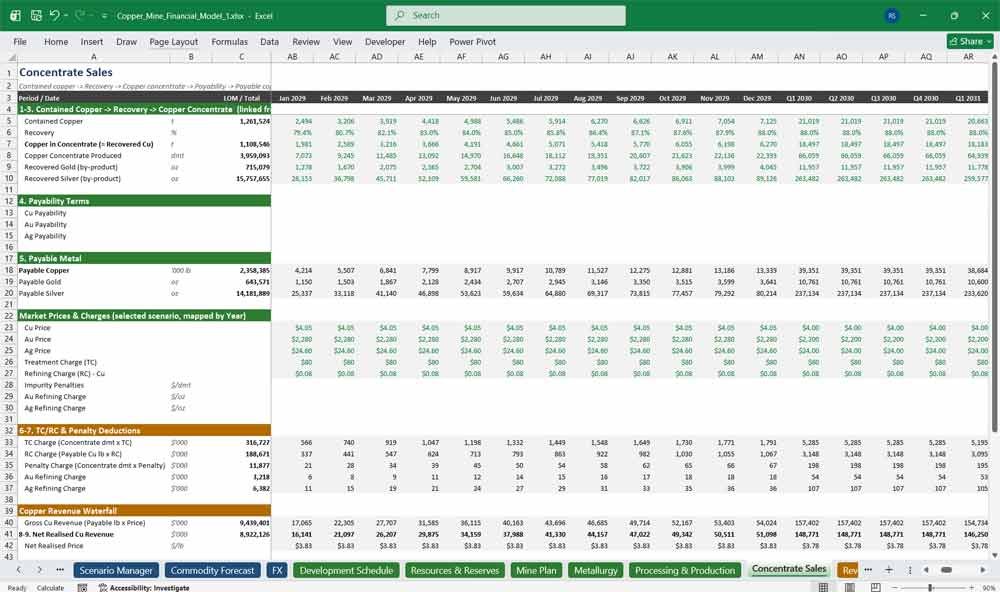
11. Concentrate Sales
The Concentrate Sales tab runs the full copper concentrate pricing waterfall in this mining financial model — contained copper through recovery, payability, TC/RC charges, penalties, and net realised price — making it one of the most detailed concentrate revenue models available.
- Full waterfall: contained copper → payable copper → net revenue
- TC/RC treatment and refining charge modelling
- Impurity penalty and by-product refining charge treatment
- Gold and silver payable metal calculations included
- Net realised price benchmarking by period
12. Revenue
The Revenue tab consolidates copper, gold, and silver net sales revenue from the Concentrate Sales waterfall into a single, auditable top-line for this mining financial model. It’s the clean revenue bridge investors and lenders need before diving into operating costs and profitability.
- Consolidated net revenue by metal (Cu, Au, Ag)
- Direct link to the Concentrate Sales waterfall
- Life-of-mine revenue total for quick benchmarking
- Feeds Income Statement and DCF revenue lines
- Fully scenario-responsive revenue output
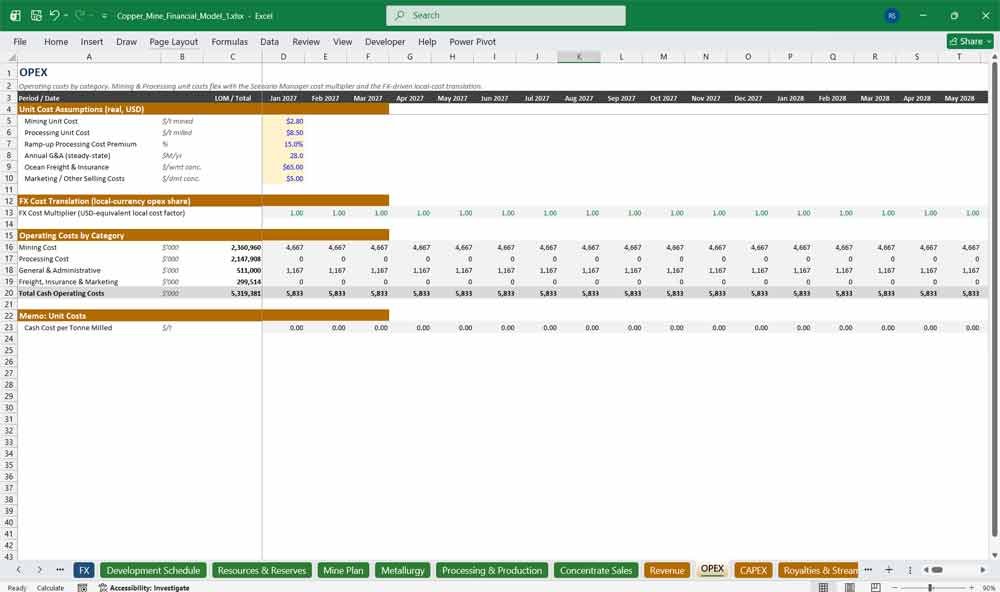
13. OPEX
The OPEX tab breaks down mining, processing, G&A, and freight costs across the mine life, giving this mining financial model realistic, scenario-flexed operating cost assumptions. FX-linked cost translation and Scenario Manager multipliers keep unit costs responsive to macro and operational assumptions.
- Mining, processing, G&A, and freight cost categories
- Unit-cost-driven, period-by-period cost build
- FX-linked local-currency cost translation
- Scenario Manager cost multiplier fully applied
- Life-of-mine total operating cost summary
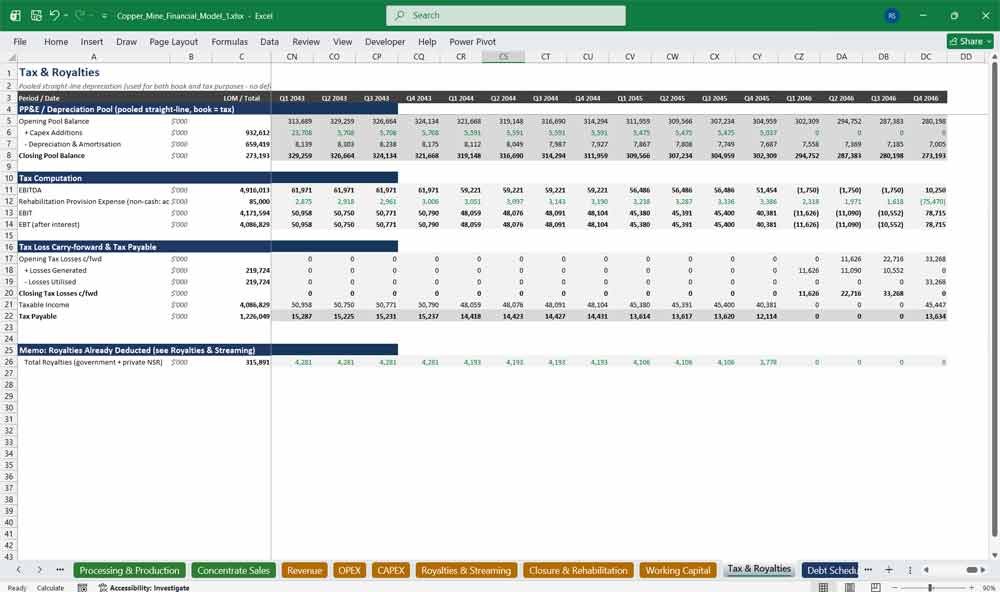
18. Tax & Royalties
The Tax & Royalties tab houses the shared depreciation pool, EBITDA-to-EBT build, corporate tax calculation, and loss carry-forwards central to this mining company financial model’s profitability engine, ensuring tax leakage and depreciation timing are modelled with real project finance rigor.
- Pooled straight-line depreciation (book and tax aligned)
- EBITDA → EBIT → EBT → tax payable build
- Tax loss carry-forward tracking
- Rehabilitation provision expense fully incorporated
- Feeds Income Statement and unlevered DCF tax lines
Key Model Components For Mining
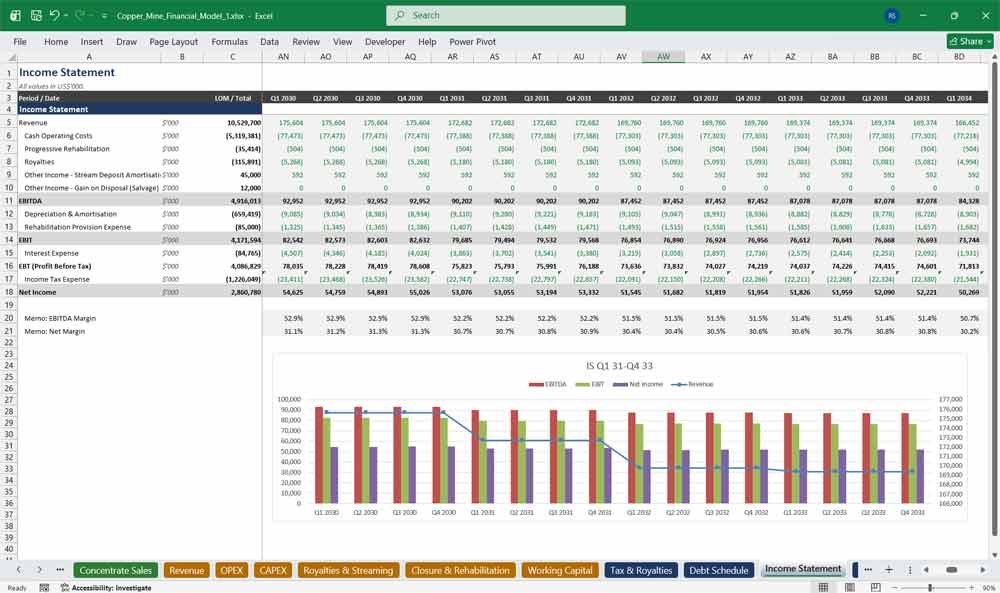
20. Income Statement
The Income Statement ties revenue, operating costs, depreciation, interest, and tax into a clean, fully-linked P&L, giving this mining financial model the profitability transparency needed for investment appraisal, lender covenant testing, and equity research on mining company earnings potential.
- Fully-linked EBITDA, EBIT, EBT, and net income build
- Other income lines for stream amortisation and salvage gain
- Interest expense linked to the Debt Schedule
- Period-by-period profitability across the full mine life
- Directly reconciles to the Cash Flow and Balance Sheet
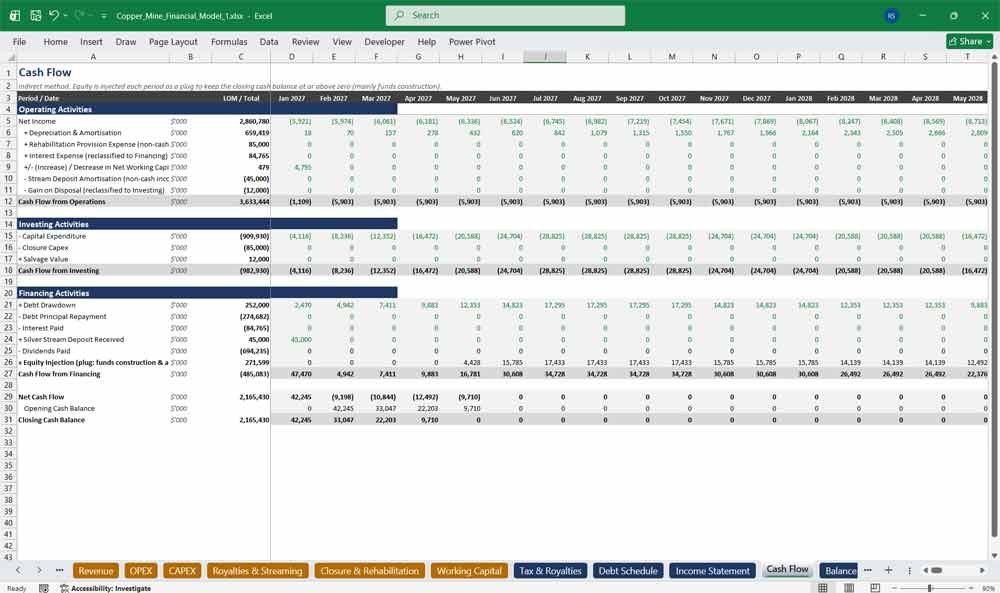
21. Cash Flow
The Cash Flow statement uses the indirect method with a live equity cash-sweep plug, ensuring this mining company financial model never shows negative cash — a critical, audit-ready feature for construction funding analysis and project finance cash flow modelling.
- Indirect-method operating, investing, and financing cash flow
- Automatic equity plug funds construction shortfalls
- Non-cash addbacks for depreciation, provisions, and stream amortisation
- Closing cash balance always non-negative
- Fully reconciled to Balance Sheet cash
22. Balance Sheet
The Balance Sheet ties Assets to Liabilities plus Equity in every one of the model’s 104 periods, giving this mining financial model the double-entry integrity institutional investors, auditors, and lenders expect from a bank-grade mine valuation and project finance model.
- Full Assets = Liabilities + Equity balance check
- Balance check verified at exactly zero every period
- Net PP&E, debt, and provision roll-forwards included
- Deferred stream revenue liability tracked
- Cumulative equity injections and retained earnings shown
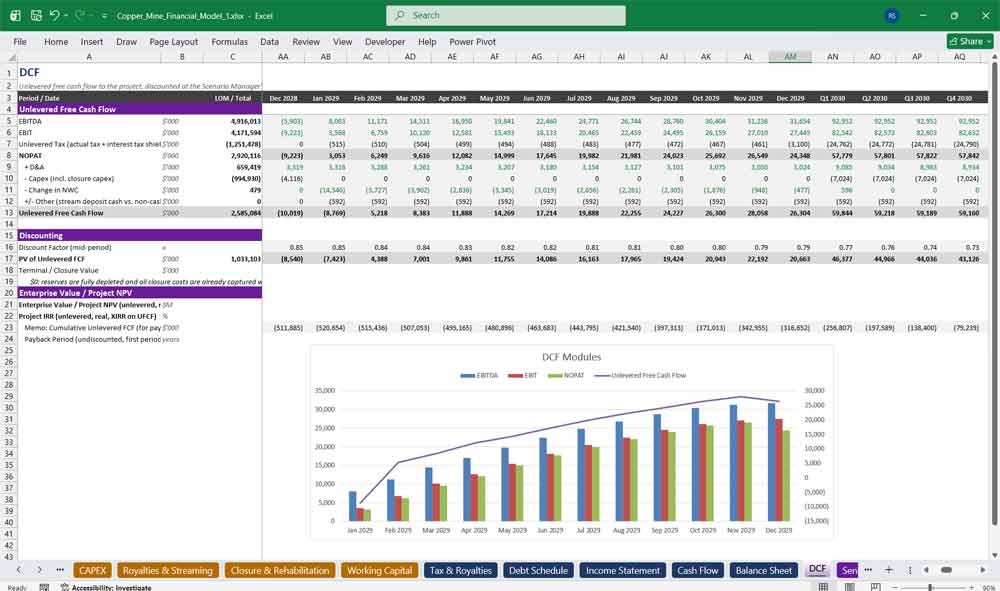
23. DCF
The DCF tab builds unlevered free cash flow from EBITDA through tax, D&A, capex, and working-capital changes to Enterprise Value, delivering the core project NPV and IRR outputs that make this mining company financial model a genuine investment decision-making tool.
- Full EBITDA → EBIT → NOPAT → UFCF waterfall
- Mid-period discount factor and PV of FCF
- No terminal value — full reserve depletion modelled
- Unlevered tax approximation with interest tax shield add-back
- Headline Project NPV and IRR outputs
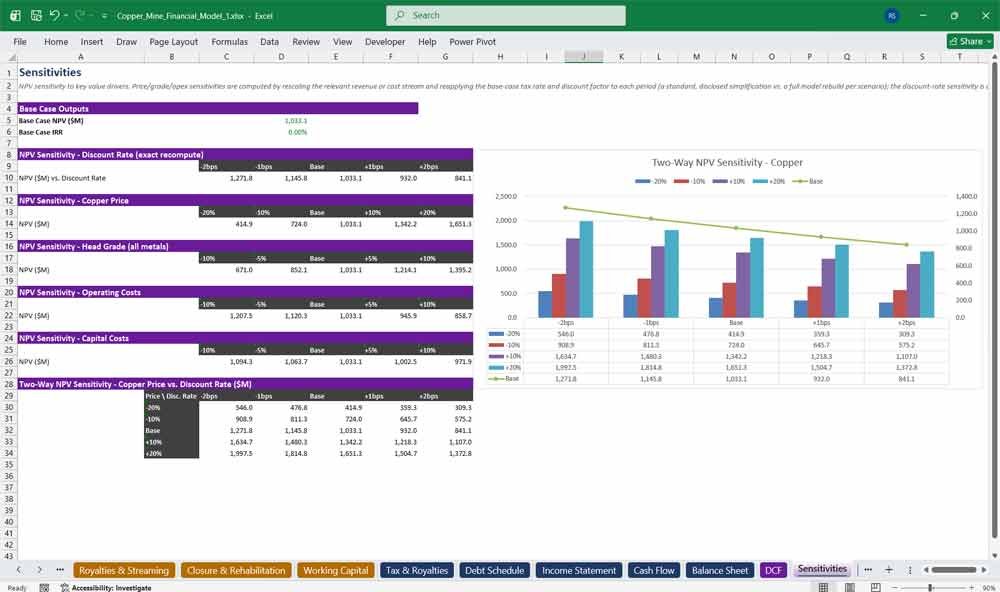
24. Sensitivities
The Sensitivities tab stress-tests this mining financial model’s NPV against discount rate, copper price, grade, opex, and capex swings, plus a two-way price-versus-discount-rate grid — essential risk analysis for any serious mining investment or project finance appraisal.
- Exact discount-rate NPV sensitivity recompute
- Copper price, grade, opex, and capex one-way sensitivities
- Two-way copper price vs. discount rate NPV grid
- Fast, formula-driven — no manual data tables
- Highlights the biggest value drivers at a glance
25. Dashboard
The Dashboard delivers an executive summary of this mining company financial model — NPV, IRR, production, and financial KPIs alongside annual charts — giving decision-makers a one-page view of mine economics without digging through 25 detailed tabs.
- Key outputs: NPV, IRR, mine life, LOM production
- Annual production and financial summary table
- Revenue, EBITDA, and unlevered FCF trend chart
- Ore milled bar chart and NPV tornado sensitivity chart
- Fastest way to present mine economics to stakeholders
Frequently Asked Questions
What is a Mining Company Financial Model?
A Mining Company Financial Model is an Excel-based financial and valuation model designed to forecast the economics of a mining project over its development and operating life. This template integrates mine planning, production, commodity prices, operating costs, CAPEX, financing, taxation, cash flow, and DCF valuation into one linked mining project finance model.
What commodities does the mining financial model cover?
The model is designed for copper, gold, and silver mining projects. It includes commodity price forecasts for copper, gold, and silver, as well as the associated concentrate treatment and refining charge assumptions used in the sales calculations.
How long is the forecast period?
The model uses a 20-year modelling horizon. Its master development schedule contains 104 forecast periods, comprising 36 monthly construction and ramp-up periods followed by 68 quarterly operating periods.
Does the model include a DCF valuation?
Yes. The model includes a dedicated DCF tab that calculates unlevered free cash flow and produces Project NPV and IRR outputs. The DCF incorporates EBITDA, tax, depreciation, CAPEX, working capital, and mid-period discounting.
Does the model include mining production and metallurgy?
Yes. The model includes dedicated Resources & Reserves, Mine Plan, Metallurgy, and Processing & Production schedules. These link ore tonnes, grades, recovery assumptions, contained metal, recovered metal, and concentrate production through the operating model.
Does it include a copper concentrate sales model?
Yes. The Concentrate Sales tab models the commercial sales waterfall from contained metal through payable metal, treatment charges, refining charges, penalties, and net realised price. Gold and silver payable metal are also included.
Can I run different commodity price scenarios?
Yes. The Scenario Manager allows you to switch between Base, Upside, and Downside cases. Scenario adjustments can flow through commodity prices, grade, mining costs, processing costs, CAPEX, FX, and discount rates without manually re-linking the model.
Does the mining model include CAPEX and operating costs?
Yes. The model includes dedicated CAPEX and OPEX schedules. CAPEX covers construction expenditure, sustaining capital, and major or deferred capital events, while OPEX includes mining, processing, G&A, and freight costs.
Does it include project finance debt?
Yes. The dedicated Debt Schedule includes project debt sizing, construction-period drawdowns, capitalised interest and fees, principal repayments, and debt balance roll-forwards.
Does the model include a three-statement financial model?
Yes. The operating schedules feed into fully linked Income Statement, Cash Flow Statement, and Balance Sheet tabs. The Balance Sheet includes a balance check designed to reconcile Assets with Liabilities and Equity throughout the model.
Does the model include royalties and streaming?
Yes. The Royalties & Streaming tab models NSR royalties and a silver streaming arrangement, including the upfront stream deposit, ongoing streamed-metal pricing, and associated balance sheet treatment.
Does it include mine closure and rehabilitation costs?
Yes. The model includes progressive rehabilitation, closure CAPEX, post-closure monitoring costs, rehabilitation provisions, salvage value, and environmental obligations. These costs are incorporated into the broader project cash flow and valuation framework.
Can I analyse the sensitivity of the mining project valuation?
Yes. The Sensitivities tab allows you to analyse NPV under changes to copper price, discount rate, grade, OPEX, and CAPEX. It also includes a two-way copper price versus discount rate NPV sensitivity grid.
Who is this mining financial model designed for?
The model is suitable for feasibility studies, project finance, M&A due diligence, investment analysis, corporate development, equity research, lender analysis, and mining finance education. It provides a structured framework for analysing mine economics, project cash flow, financing requirements, and valuation.
Is the model suitable for learning mining finance?
Yes. The linked structure provides a practical framework for understanding how a mining project financial model is constructed, from resources and mine planning through production, revenue, costs, financing, financial statements, and DCF valuation. The colour-coded inputs, formulas, and cross-sheet links also make the model easier to follow and audit.
Final Notes on the Financial Model
This 20 Year Mining Company Financial Model must focus on balancing capital expenditures with steady revenue growth from diversified commodity mining. By optimizing operational costs, power efficiency, and maximizing high-margin services, this model helps to ensure sustainable profitability and cash flow stability.