
Iron Ore Mine Financial Model Template
Our Iron Ore Mine Financial Model is a professional Excel template built for mining companies, investors, lenders and consultants who need a bankable view of an iron ore project from construction to closure. It covers a 24-month monthly construction period, five years of monthly operations with annual roll-ups, and fifteen further annual operating years, giving a complete 20-year life-of-mine forecast. Every figure is formula-driven and linked to a single model start date, so the whole timeline re-dates instantly.
20-Year Financial Model for an Iron Ore Mine
This iron ore mining financial model goes far beyond a simple revenue and cost sheet. It integrates JORC-style resources and reserves, a physical mine plan, plant throughput and ramp-up, product mix and specifications, CFR China pricing with Fe grade premiums and silica, alumina and phosphorus penalties, rail, port and ocean freight logistics, and detailed opex and capex. The outputs flow into a fully linked income statement, cash flow statement and balance sheet that balances in every period.
Built to the standards used by project finance lenders and private equity analysts, the iron ore DCF model calculates project NPV, IRR, MIRR, payback, equity IRR and equity multiple. It also includes senior, subordinated and revolving debt with DSCR and LLCR covenants, a dividend lock-up test, royalties and tax with loss carry-forward, plus scenario analysis, two-variable sensitivity tables, breakeven prices and a 25-tab model checks dashboard.
What’s Inside: Tab-by-Tab Overview
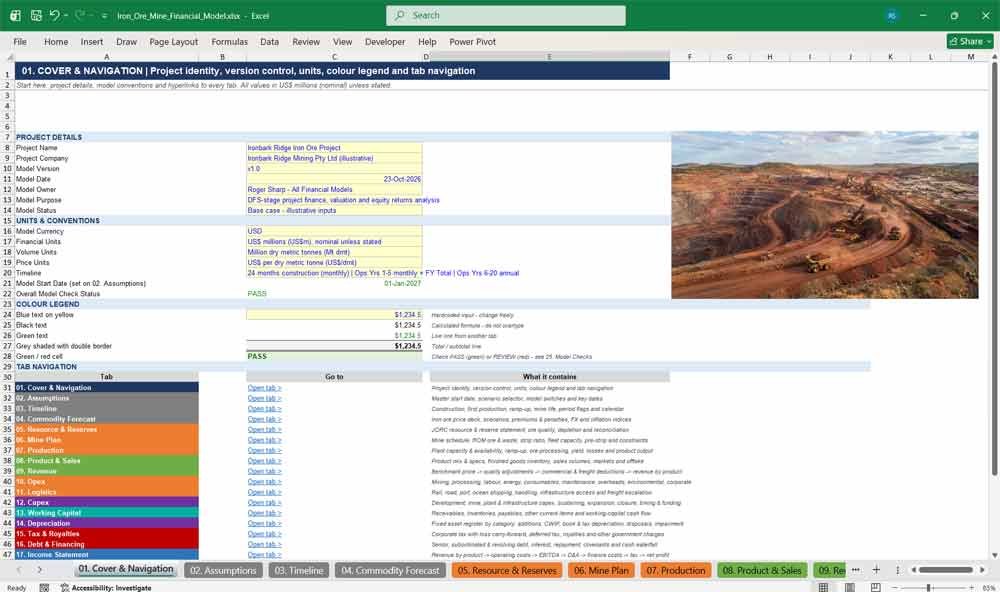
01. Cover & Navigation
The cover tab introduces your iron ore project with its name, version, units, model owner and live check status. A colour legend explains input, formula and link conventions, while hyperlinked navigation lets users jump instantly to any of the 25 tabs.
- Project name, version control, model owner and purpose
- Units and conventions (US$ millions, Mt dry, US$/dmt)
- Colour-coded legend for inputs, formulas, links and checks
- One-click hyperlinks to every tab
02. Assumptions
The control panel of the mining financial model. Change one Model Start Date and every date updates automatically. Select from five commodity price scenarios and toggle switches for nominal or real pricing, debt, tax, royalties, expansion, cash sweep and terminal value.
- Single master start date drives the whole workbook
- Five-scenario price selector (Base, Upside, Downside, High, Low)
- On/off switches for debt, tax, royalties, sweep and lock-up
- Key dates and headline results at a glance
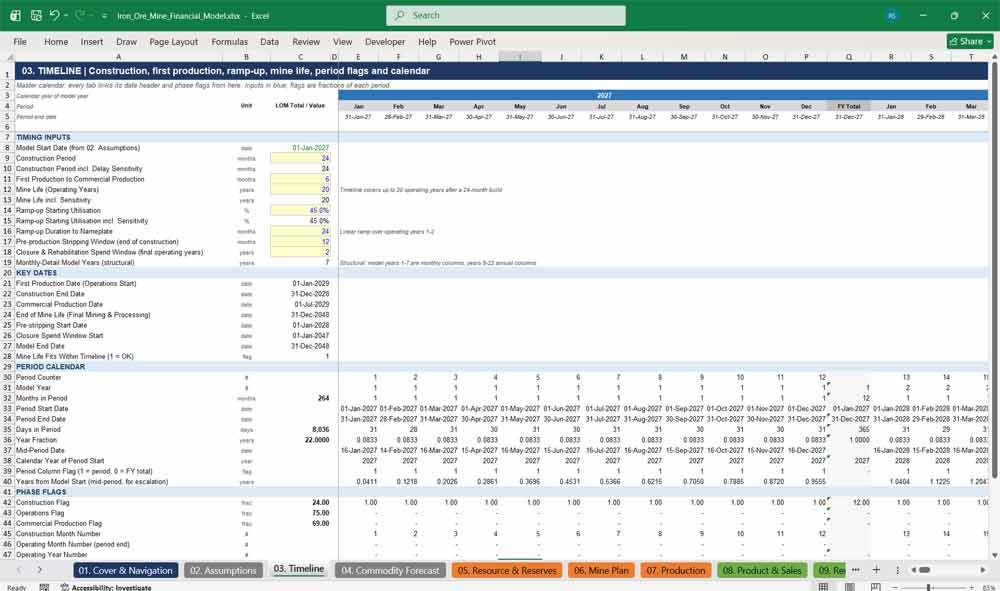
03. Timeline
The master calendar for the iron ore project. It calculates construction, first production, commercial production, ramp-up and end of mine life, then generates period flags, an S-curve for capex phasing and closure weights used by every other tab.
- 24-month construction, monthly ops years 1–5, annual years 6–20
- Linear ramp-up to nameplate over operating years 1–2
- Construction S-curve, pre-stripping and closure spend weights
- Production delay and mine life sensitivity built in
Iron Ore Mine Revenue – Forecasting
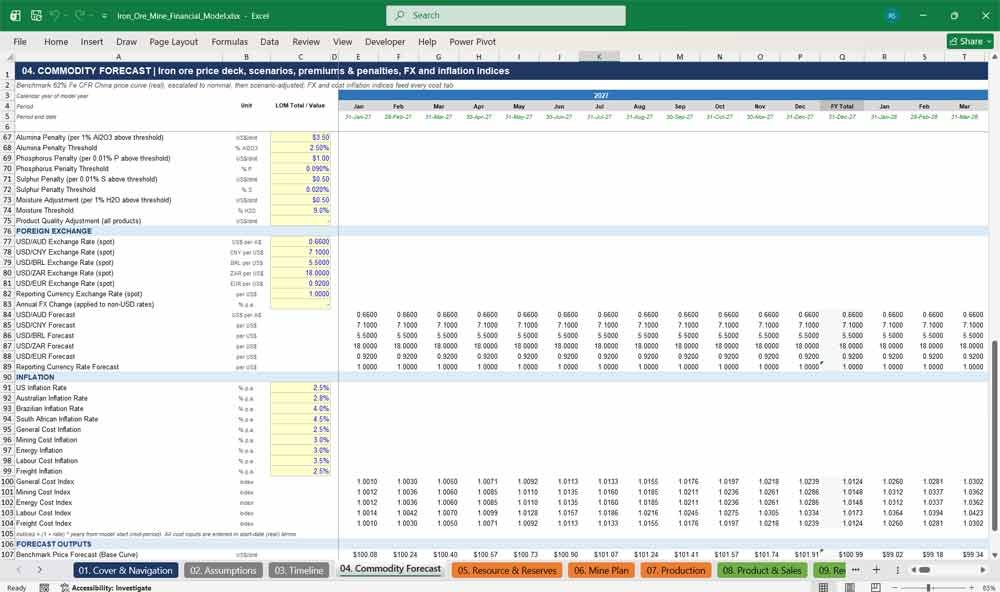
04. Commodity Forecast
A complete iron ore price deck based on the 62% Fe CFR China benchmark. It builds spot, forward, short, medium and long-term prices, applies escalation and scenarios, and models product premiums, penalties, foreign exchange and cost inflation indices.
- 62%, 65% and 58% Fe benchmark prices with CFR and FOB
- Five price scenarios with a manual adjustment overlay
- Lump, fines and pellet premiums plus grade and impurity penalties
- USD/AUD, CNY, BRL, ZAR and EUR FX and inflation indices
05. Resource & Reserves
Captures a JORC (2012) style resource and reserve statement, including measured, indicated and inferred resources and proven and probable reserves. Reserves deplete each period from the mine plan, with mining recovery, dilution, ore characteristics and reconciliation fully modelled.
- Mineral resources and ore reserves with grades and contained iron
- Ore quality: Fe, silica, alumina, phosphorus, sulphur, moisture
- Period-by-period resource and reserve depletion
- Mining recovery, dilution and reserve life outputs
06. Mine Plan
The physical heart of the open pit mining model. ROM ore is scheduled to feed the processing plant, subject to reserves, ore limits and fleet capacity. Waste, strip ratio, pre-stripping, mining capacity, constraints and cost drivers are all calculated automatically.
- ROM ore, waste and total material movement schedule
- Strip ratio with early-years uplift and deferred stripping
- Fleet capacity, permitted limits and utilisation
- Pre-production stripping and mine development costs
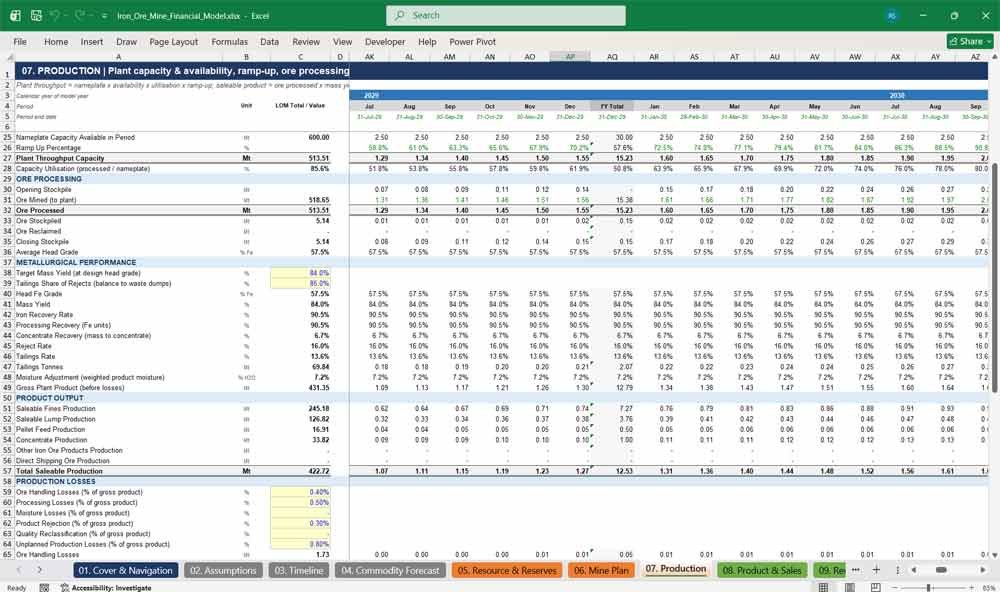
07. Production
Models iron ore processing from plant feed to saleable product. Nameplate capacity, availability, utilisation and ramp-up determine throughput, while mass yield, iron recovery and production losses convert processed ore into fines, lump, concentrate, pellet feed and DSO.
- Nameplate capacity with optional expansion case
- Scheduled and mechanical availability and OEE
- Mass yield, iron recovery, rejects and tailings
- Saleable production by product with loss reconciliation
08. Product & Sales
Converts saleable production into sales through finished goods inventory. It sets product mix and specifications, splits sales by market including China, Japan and South Korea, and models contracted offtake, take-or-pay volumes, shipping frequency and inventory management.
- Product mix and full quality specifications by product
- Sales allocation by destination market
- Contracted versus spot offtake and take-or-pay volumes
- Finished goods inventory, losses and write-down test
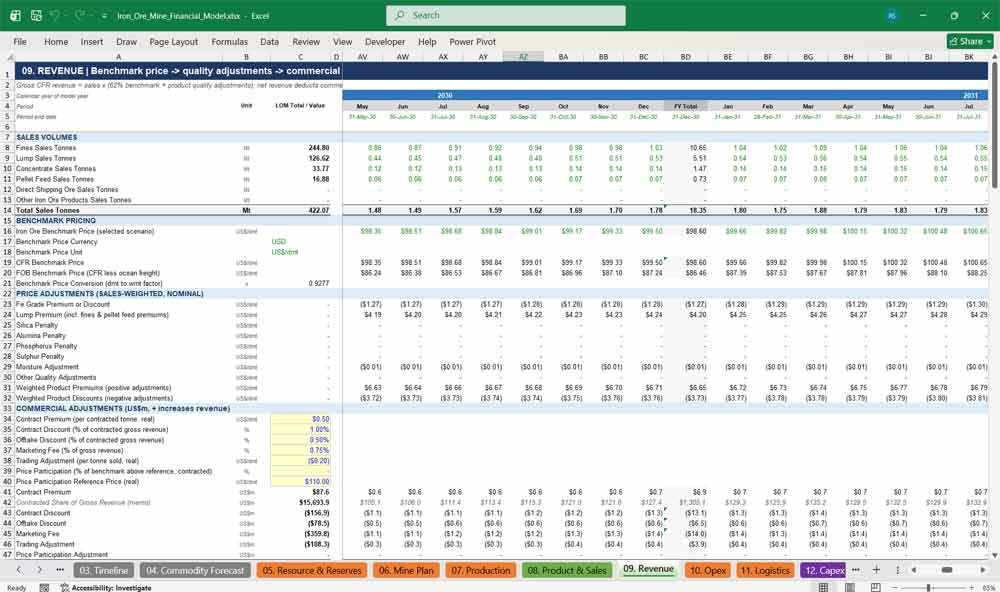
09. Revenue
Builds iron ore revenue from the benchmark price through to net realised price. Product quality adjustments, contract and offtake discounts, marketing fees and ocean freight deductions are applied, giving gross CFR revenue, net FOB-equivalent revenue and revenue by product.
- Gross CFR and net FOB-equivalent realised prices
- Fe grade, lump premium and impurity penalty build
- Commercial and freight deductions (CFR sales)
- Revenue by product and per tonne metrics
10. Opex
A detailed operating cost model using real unit rates multiplied by physical drivers and escalated by inflation. It covers mining, processing, labour, energy, consumables, maintenance, site overheads, environmental and corporate costs, with an AUD exchange rate cost factor.
- Activity-based mining costs: drilling, blasting, loading, haulage
- Processing, labour, energy and consumables costs
- Fixed versus variable cost split
- Cash cost per tonne processed, saleable and FOB
11. Logistics
Models the full mine-to-port supply chain for iron ore exports. Rail, road and port costs are operating expenses, while Capesize ocean freight and insurance are deducted from CFR revenue. Capacity utilisation and take-or-pay infrastructure charges are included.
- Rail and road distances, tariffs and capacity
- Port handling, throughput, ship loading and demurrage
- Ocean freight with bunker adjustment and insurance
- Take-or-pay charges and logistics cost per tonne
Iron Ore Mine Production & Sales
12. Capex
A comprehensive capital expenditure schedule for an iron ore mine. Initial capex is phased on a construction S-curve, with sustaining, expansion, capitalised and closure capex, plus capex timing, contingency and a funding split between debt, grants and equity.
- Project development, mine, plant and infrastructure capex
- Contingency and capitalised interest during construction
- Sustaining, expansion and closure capex schedules
- Capex funding sources and capex per tonne metrics
13. Working Capital
Calculates receivables, inventories, payables and other current items using days-based drivers that work consistently across monthly and annual periods. It captures GST recovery on capex, ore and product inventories, accruals and the resulting working capital cash flow.
- Accounts receivable, inventory and payable days
- Raw ore, WIP, finished goods and consumables inventory
- GST, prepayments and accrued expenses
- Net working capital and cash flow impact
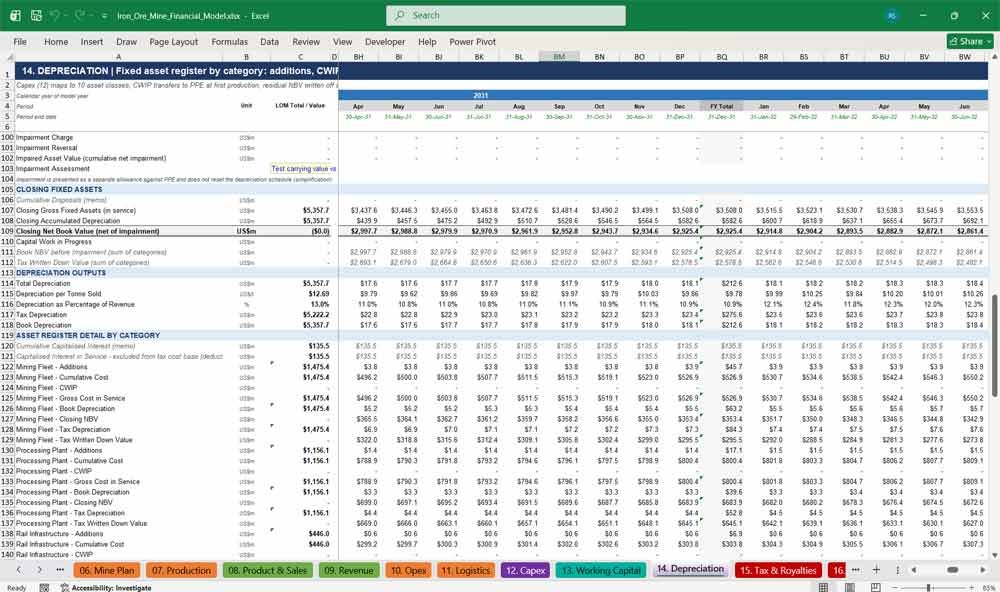
14. Depreciation
A full fixed asset register across ten asset classes. Capital work in progress transfers to service at first production, with straight-line or units-of-production book depreciation, separate tax depreciation, disposals, impairment and end-of-mine-life write-off.
- Ten asset categories with individual useful lives
- Straight-line or units-of-production methods
- Separate tax written down values
- Disposals, impairment and closing net book value
15. Tax & Royalties
Models Australian-style corporate income tax with loss carry-forward, interest deductibility limits and deferred tax. Western Australia–style ad valorem royalties, landowner royalties, minimum royalty, carbon costs and other government charges are calculated with payment lags.
- 30% corporate tax with loss utilisation
- Deferred tax assets and liabilities
- State, profit-based and landowner royalties
- Carbon, property, land and other government charges
16. Debt & Financing
A bankable project finance debt schedule with senior, subordinated and working capital facilities. Construction drawdowns, capitalised interest, straight-line or sculpted repayment, fees, DSCR, LLCR, covenant headroom and a full cash flow waterfall are included.
- Senior, subordinated and revolving facilities
- Straight-line or DSCR-sculpted repayment
- LTM DSCR, LLCR, ICR and net debt to EBITDA covenants
- Cash waterfall with sweep, lock-up and dividends
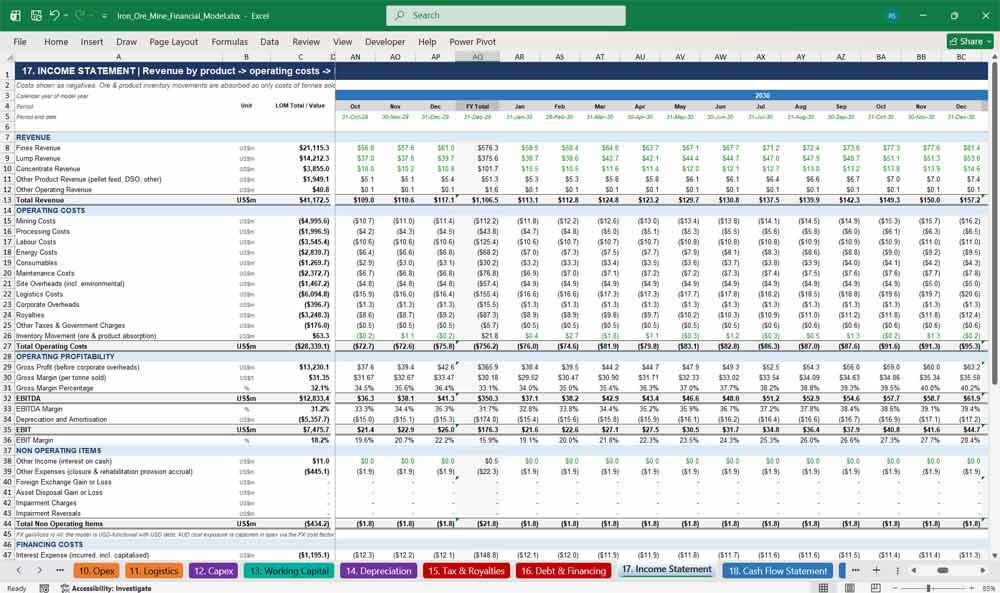
17. Income Statement
A fully linked profit and loss account from revenue by product through operating costs, EBITDA, depreciation, finance costs and tax to net profit. Inventory absorption ensures only the cost of tonnes sold reaches EBITDA, with margins and per-tonne metrics.
- Revenue by product and total operating costs
- Gross profit, EBITDA, EBIT and net profit
- Margins and per-tonne profitability metrics
- Finance costs and current and deferred tax
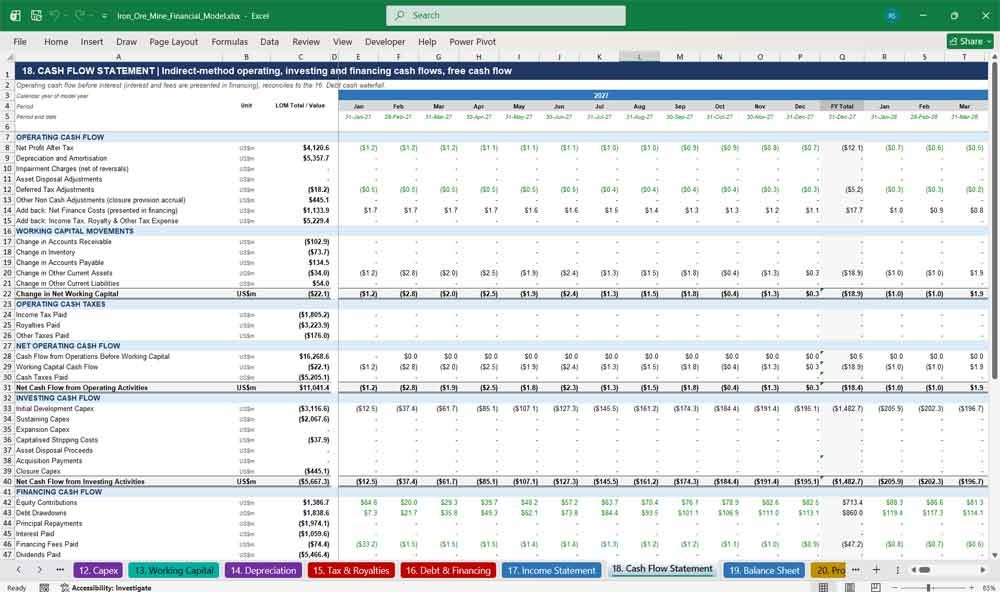
18. Cash Flow Statement
An indirect-method cash flow statement reconciling net profit to cash. It presents operating, investing and financing cash flows, working capital movements, cash taxes, unlevered and levered free cash flow, and ties exactly to the debt cash waterfall.
- Operating cash flow before and after working capital
- Investing cash flow by capex category
- Financing cash flow, dividends and grants
- Unlevered and levered free cash flow
19. Balance Sheet
A three-statement balance sheet that balances in every period. It shows cash, receivables, inventories, property plant and equipment, deferred tax, debt, closure and rehabilitation provisions, and equity, with a live balance sheet check and net debt.
- Current and non-current assets and liabilities
- Current portion of debt automatically classified
- Closure and rehabilitation provisions
- Balance sheet check, net debt and net working capital
Key Model Components For Mining Iron Ore
20. Project Valuation
Calculates unlevered post-tax free cash flow and discounts it from the valuation date using a mid-period or end-period convention. It delivers project NPV, IRR, MIRR, simple and discounted payback, NPV per tonne and full life-of-mine project economics.
- WACC or manual discount rate
- Unlevered tax with its own loss pool
- NPV, IRR, MIRR and payback periods
- NPV per tonne of reserves and capacity
21. Equity Returns
Analyses returns to shareholders using equity contributions and dividends from the cash waterfall. It calculates hold-to-maturity and exit-case equity IRR, equity multiple and NPV, a preferred return and promote waterfall, exit valuation and shareholder distributions.
- Gross and net equity IRR and equity multiple
- Exit valuation on an EBITDA multiple
- Preferred return, catch-up and sponsor promote
- Distributions by sponsor, co-investor and strategic investor
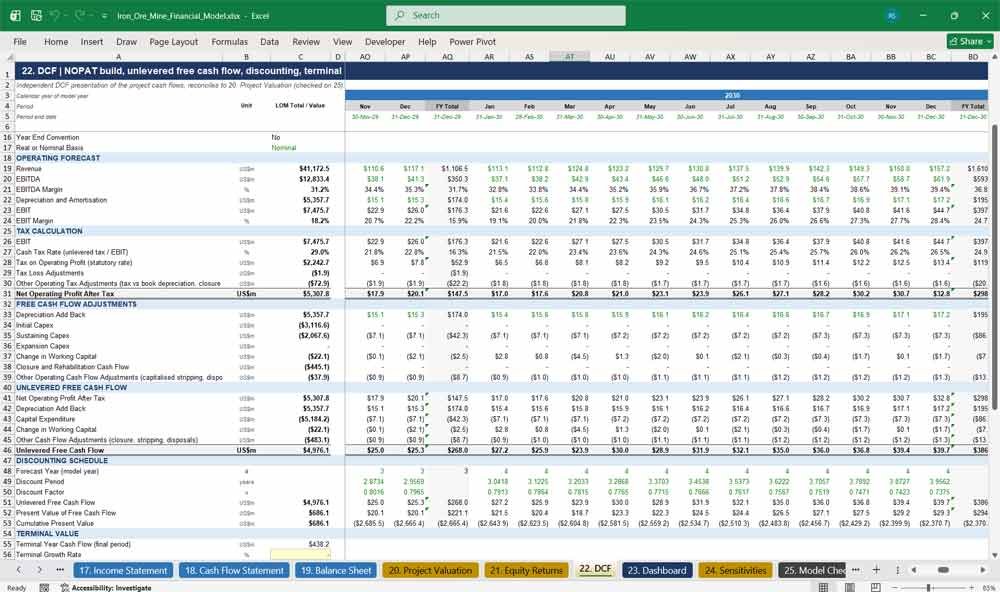
22. DCF
An independent discounted cash flow presentation that builds NOPAT, unlevered free cash flow and a discounting schedule. Optional Gordon growth or exit multiple terminal value feeds an enterprise value to equity value bridge, reconciled to the project valuation.
- NOPAT build with tax reconciliation
- Discount periods, factors and present values
- Optional terminal value methods
- Enterprise value to equity value bridge
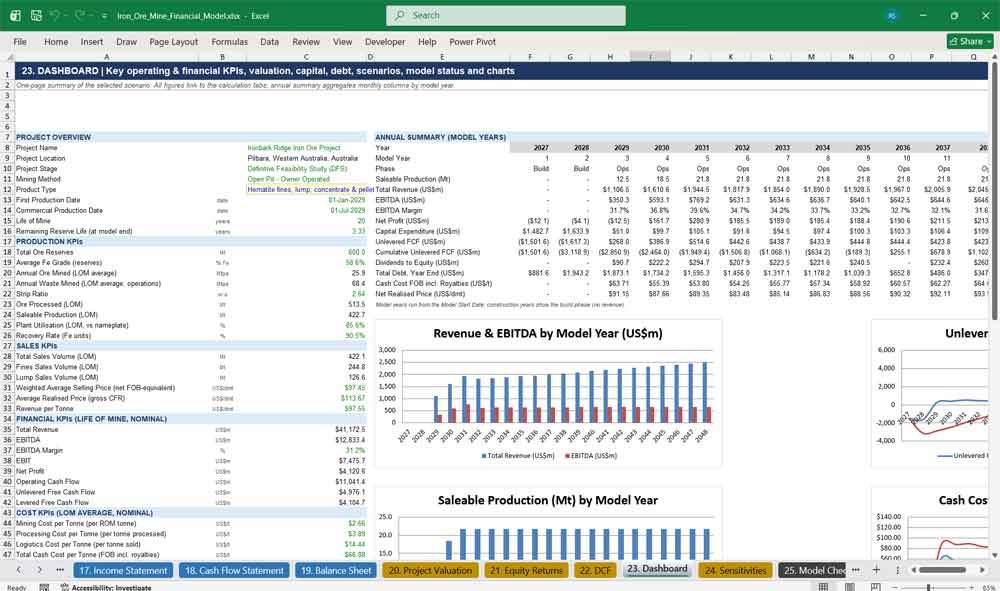
23. Dashboard
A one-page executive summary of the iron ore mine financial model. Key production, sales, cost, valuation, capital and debt KPIs sit alongside a 22-year annual summary, scenario results, model status flags and four automatically updating charts.
- Production, sales and financial KPIs
- Valuation, capital and debt KPIs
- Base, upside and downside scenario NPV and IRR
- Revenue, EBITDA, free cash flow and cost charts
24. Sensitivities
Stress-test the project instantly. Live flex inputs drive the full model, fast one- and two-variable tables cover price, opex, capex, FX, volume and discount rate, and Excel data tables test ramp-up, delays, mine life and financing terms.
- One-variable NPV, IRR and equity IRR tables
- Seven two-variable sensitivity grids
- Data tables for timing and financing levers
- Breakeven iron ore price, cash cost and volume
25. Model Checks
An audit layer that tests the integrity of every calculation, period by period. Resource, production, sales, revenue, cost, capex, tax, debt, financial statement, valuation and formula checks roll up into PASS or REVIEW flags shown on the cover.
- Over 60 reconciliation and integrity tests
- Period-by-period difference and breach flags
- Section and overall PASS / REVIEW status
- Formula error, missing input and timeline checks
Why Buy This Model?
Building a bankable iron ore mine financial model from scratch can take weeks of specialist work and still leave errors hidden in thousands of formulas. This template gives you a complete, fully linked, lender-style model on day one: 25 integrated tabs, a balanced three-statement forecast, project and equity valuation, debt sculpting and covenants, and more than 60 built-in checks. Every assumption sits in clearly marked input cells, every forecast cell is a formula, and the whole timeline re-dates from one start date. Whether you are preparing a feasibility study, raising debt or equity, valuing an acquisition or teaching mining finance, you can replace the illustrative inputs with your own data and produce credible, defensible results quickly.
Mining Company Frequently Asked Questions
Can I use this model for my own iron ore project?
Yes. All inputs are illustrative and clearly marked in blue on yellow cells. Replace them with your own resource, mine plan, cost, price and financing assumptions and the entire model recalculates automatically.
Is the model suitable for other commodities?
It is designed for iron ore, with Fe grade premiums, impurity penalties and CFR China pricing. The structure can be adapted to other bulk commodities, but pricing and product tabs would need editing.
What version of Excel do I need?
Microsoft Excel 2016 or later, including Microsoft 365, is recommended. The model uses standard functions such as XIRR, SUMIFS and INDEX/MATCH, with no macros or add-ins required.
Does the model contain macros or VBA?
No. It is a macro-free .xlsx file, so it opens safely without security warnings and works in corporate environments that block macros.
How long is the forecast period?
The model covers 22 years: a 24-month construction period shown monthly, operating years 1–5 shown monthly with annual totals, and operating years 6–20 shown annually.
Can I change the start date of the project?
Yes. Change the Model Start Date on the 02. Assumptions tab and every date, header, ramp-up flag and escalation index across all 25 tabs updates automatically.
Does the balance sheet balance?
Yes. The balance sheet balances in every period, and the 25. Model Checks tab confirms this alongside cash flow, debt, tax, depreciation and equity reconciliations.
Does it include project finance debt?
Yes. It includes senior, subordinated and working capital facilities with capitalised interest, grace periods, straight-line or DSCR-sculpted repayment, fees, cash sweep, dividend lock-up and DSCR and LLCR covenants.
Which valuation outputs are included?
Project NPV, IRR, MIRR, simple and discounted payback, NPV per tonne, enterprise value, equity value, equity IRR, equity multiple, exit-case returns and a preferred return and promote waterfall.
Can I run scenarios and sensitivities?
Yes. Select from five price scenarios, flex key inputs live, and use one- and two-variable sensitivity tables plus breakeven analysis for price, cost and production volume.
Why do some sensitivity tables need F9?
The timing and financing tables are Excel data tables, which recalculate the whole model. To keep the workbook fast, calculation is set to automatic except data tables, so press F9 to refresh them.
Can I model the project in real or nominal terms?
Yes. A single switch moves the model between nominal (with price escalation and cost inflation) and real terms (all values held at start-date prices).
Is the model unlocked and editable?
Yes. The model is fully unlocked, so you can review every formula, add line items or adapt the structure to your project.
Who is this model designed for?
Mining companies, project developers, investors, private equity, lenders, corporate finance advisers, consultants and students who need a professional iron ore mine valuation and project finance model.
Further Reading
Optimize your project valuation and forecasting with this professional Coal Mine Financial Model. Designed specifically for mining operators and investors, this comprehensive template includes pre-built tabs for production scheduling, capital expenditure tracking, and cash flow analysis to ensure accurate economic evaluations.
- Maximize your asset evaluation and investment analysis with this institutional-grade Copper Mine Financial Model. This specialized template features dynamic inputs for grade recovery, smelting and refining charges (TC/RCs), byproduct credits (like gold or molybdenum), and multi-scenario cash flow forecasting to accurately assess project economics.
Final Notes on the Financial Model
This 20 Year Iron Ore Mining Financial Model must focus on balancing capital expenditures with steady revenue growth from diversified commodity mining. By optimizing operational costs, power efficiency, and maximizing high-margin services, this model helps to ensure sustainable profitability and cash flow stability.