
Lithium Plant Financial Model Template
This Lithium Processing Plant Financial Model is a professional, fully formula-driven Excel template for evaluating a spodumene-to-lithium-chemicals conversion facility, from construction through 20 years of operations. Built for project developers, investors, lenders, consultants and corporate finance teams, it models battery-grade lithium hydroxide (LiOH·H₂O) and lithium carbonate (Li₂CO₃) production alongside by-products such as sodium sulfate. Construction is modelled monthly over three years, operating years 1–5 are modelled monthly with annual roll-up columns to capture the ramp-up, and years 6–20 are modelled annually, all in USD on a single horizontal timeline.
Financial Model for a Lithium Plant
This lithium refinery financial model links every stage of the value chain: the spodumene feedstock supply contract, plant capacity and availability, lithium mass balance and recovery, a lithium price deck, operating costs, construction capex with contingency and escalation, working capital, tax and depreciation. The engine flows into a fully integrated three-statement model (income statement, cash flow statement and balance sheet), a project finance debt schedule with DSRA, DSCR and LLCR, and a priority-of-payments cash waterfall. Change the start date on the Control tab and every date, label and escalation index across all 27 tabs updates automatically.
Decision-makers get investment-grade outputs: unlevered DCF valuation, project NPV and IRR, equity IRR, MOIC, payback, peak funding and breakeven lithium prices. Four built-in scenarios (Base, Upside, Downside and Severe Downside), live sensitivity flex inputs, tornado and two-way sensitivity tables, unit economics per tonne of LCE, a dashboard with charts and a 17-point integrity checks tab make this a lender-ready lithium project feasibility model. You can adapt it for a new lithium conversion plant, a brownfield expansion, a tolling arrangement or a battery-materials investment case.
Model Tabs
01. Dashboard
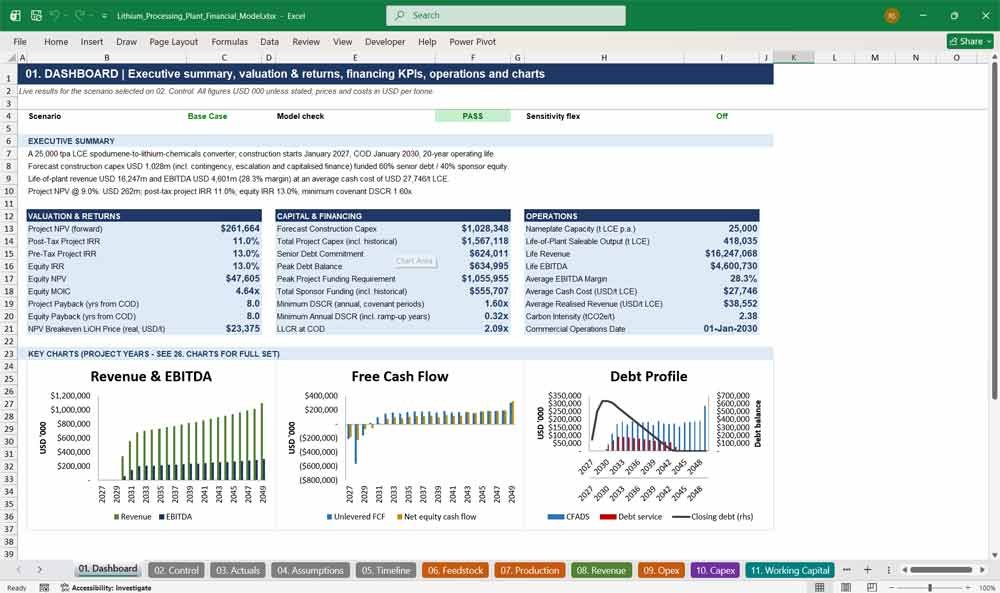
The Dashboard gives investors and lenders an instant executive summary of the lithium processing project. Dynamic text describes the plant, capex, funding and returns, while KPI panels show project NPV, IRR, equity IRR, MOIC, DSCR, LLCR, payback and breakeven price. Six charts visualise revenue, EBITDA, free cash flow, debt and unit margins.
- Auto-updating executive summary written in plain English
- Valuation, financing and operations KPI panels
- Six charts covering revenue, EBITDA, cash flow, debt, production and margins
- Live model-check status and scenario indicator
02. Control
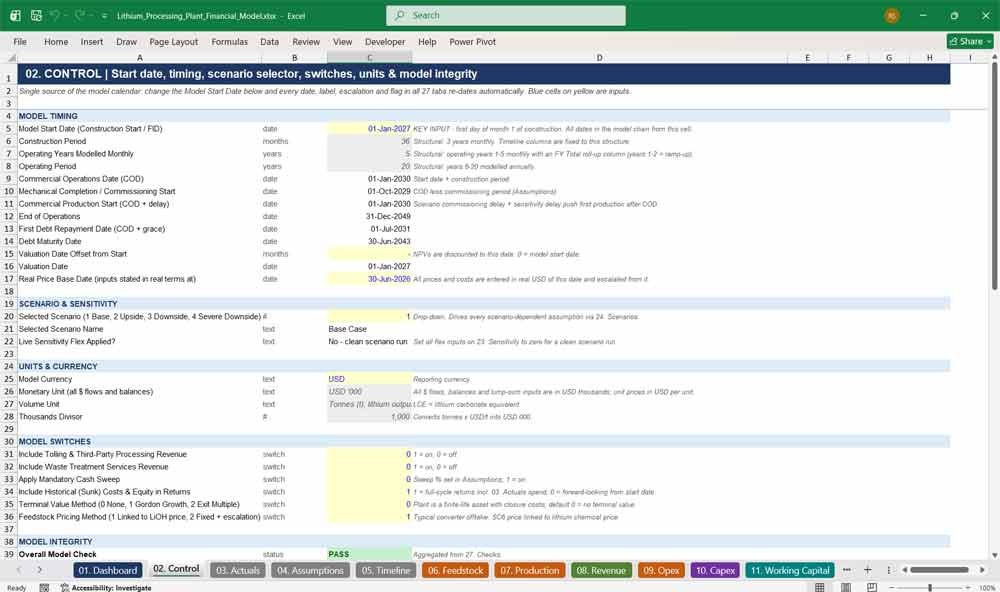
The Control tab is the command centre of the lithium refinery financial model. Set the model start date once and the entire 116-column timeline re-dates automatically. Select one of four scenarios from a drop-down, set the valuation date, toggle tolling, waste services, cash sweep and terminal value, and view overall model integrity.
- Single start-date input drives every date in the model
- Scenario selector (Base, Upside, Downside, Severe Downside)
- Switches for tolling, waste treatment, cash sweep, sunk costs and terminal value
- Hyperlinked tab index and colour-coded input legend
Lithium Plant Revenues & Opex
03. Actuals
The Actuals tab captures historical project expenditure before the forecast begins, so the model reflects real money already spent. Enter quarterly spend on studies, FEED engineering, permitting, land and early works, plus sponsor funding and construction progress. Closing balances automatically form a balanced opening balance sheet for the forecast.
- Eight historical quarters dated automatically from the start date
- Development capex, funding and progress tracking
- Automatic opening cash, land, CIP, payables and equity
- Opening balance sheet check
04. Assumptions
The Assumptions tab holds every operating, commercial, financial, tax, inflation and market input in one place, entered in real terms and escalated in the model. It includes a 40-year lithium hydroxide and lithium carbonate price deck, a seven-product portfolio table and a 26-line construction capex budget with S-curve timing.
- Lithium price deck for LiOH, Li₂CO₃ and SC6 reference prices
- Product mix, LCE conversion factors and pricing premiums
- Feedstock, technical, reagent, energy, labour and overhead inputs
- Debt, equity, tax, working capital and valuation assumptions
05. Timeline
The Timeline tab is the master calendar for the entire lithium project finance model. It defines 36 construction months, 60 monthly operating periods with FY totals, and 15 annual periods. Phase flags, COD, commissioning delay, ramp-up timing, escalation indices and a colour-coded construction Gantt schedule all flow from it.
- Key project dates: start, mechanical completion, COD, debt maturity, closure
- Construction, operations, ramp-up and final-period flags
- CPI, labour, electricity, reagent and capex escalation indices
- Visual construction activity schedule
06. Feedstock
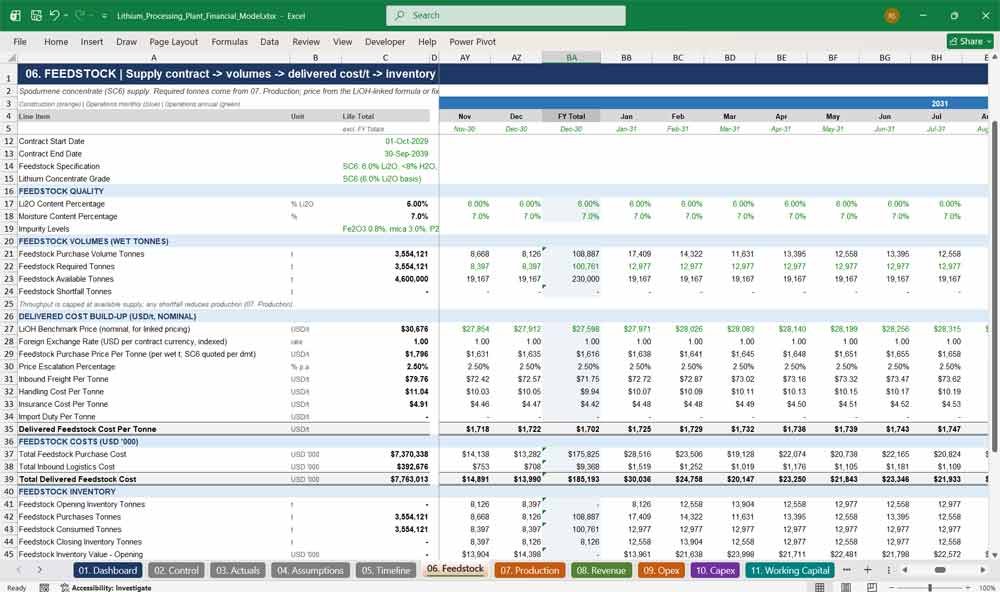
The Feedstock tab models the spodumene concentrate (SC6) supply chain that drives most of a lithium converter’s cost. It covers the contract register, Li₂O grade and moisture, required versus available tonnes, linked or fixed pricing, freight, handling, insurance and duty, and feedstock inventory valued at weighted average cost.
- Contract register: supplier, location, term and specification
- Spodumene price linked to the lithium hydroxide price, or fixed with escalation
- Delivered cost per tonne build-up
- Inventory corkscrew with supply shortfall detection
07. Production
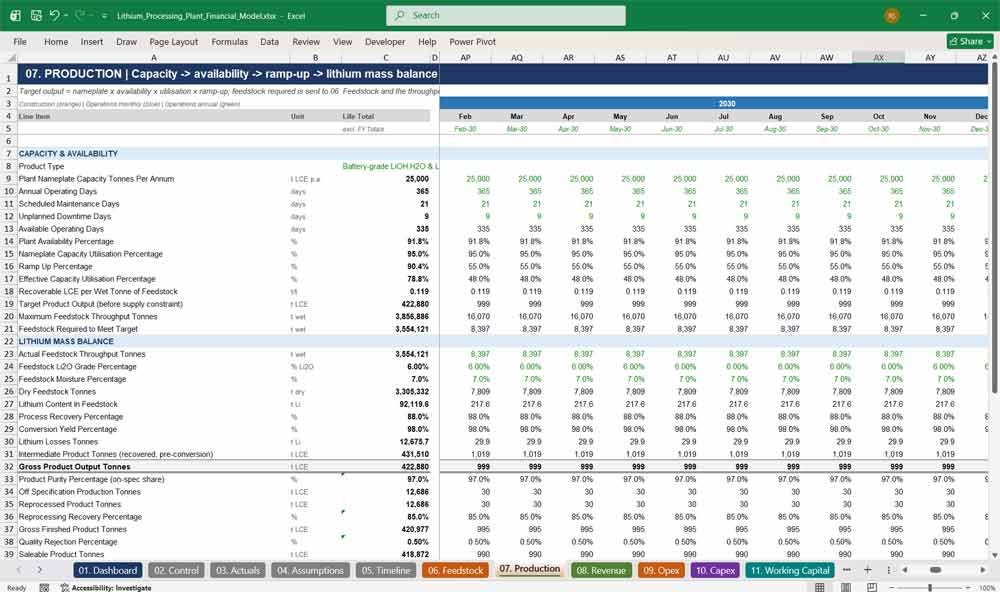
The Production tab converts nameplate capacity into saleable lithium output through availability, utilisation and ramp-up, then runs a full lithium mass balance. It tracks dry feed, lithium content, process recovery, conversion yield, off-spec and reprocessed product, quality rejections and finished-goods inventory in tonnes of lithium carbonate equivalent (LCE).
- Capacity, availability, utilisation and ramp-up profile
- Lithium mass balance with recovery and losses
- Off-spec, reprocessing and quality rejection logic
- Reagent, electricity and water intensity per tonne
08. Revenue
The Revenue tab builds lithium sales from the price deck and production volumes. It covers lithium carbonate, lithium hydroxide, concentrate, chloride, metal, niobate and phosphate, plus potassium and sodium sulfate by-products, tolling fees and waste treatment services. Premiums, discounts, quality adjustments and freight recoveries complete realised revenue.
- Seven lithium products with volume × realised price
- By-product revenue for sodium sulfate, potassium sulfate and residues
- Optional tolling and waste treatment revenue
- Price adjustments and realised revenue per tonne LCE
09. Opex
The Opex tab provides a detailed lithium plant operating cost build-up. Variable costs (sulfuric acid, sodium hydroxide, soda ash, lime, electricity, gas, water and waste) are driven by production, while fixed costs (labour, maintenance, insurance, HSE, logistics and overheads) escalate from COD. It reports cash operating cost per tonne of LCE.
- More than 50 cost lines matching industry practice
- Reagent and energy costs driven by consumption factors
- Fixed vs variable cost split
- Cash operating cost per tonne of product
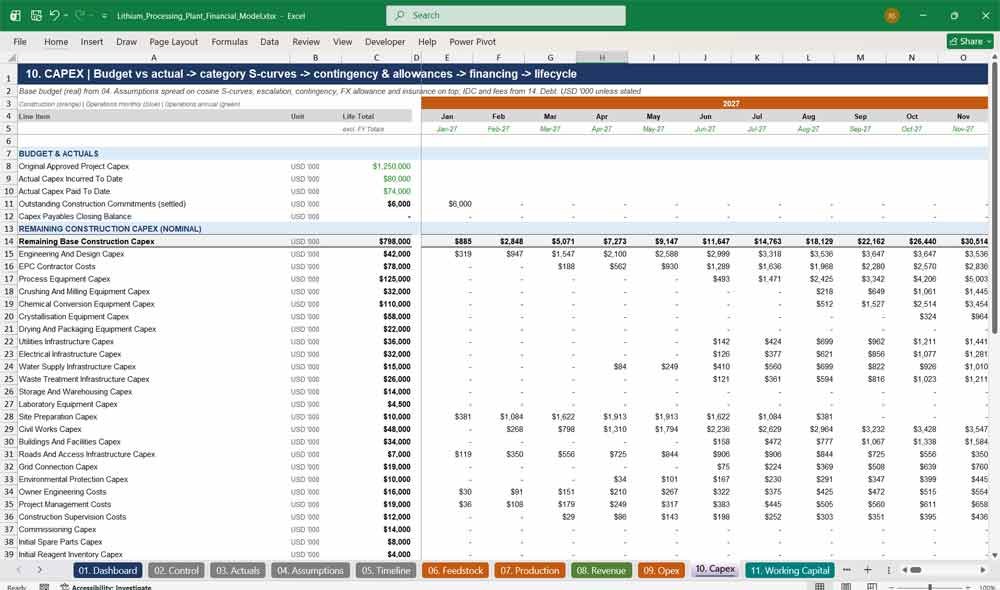
10. Capex
The Capex tab models the full construction budget for a lithium hydroxide refinery: 26 categories, from engineering and EPC to crystallisation, utilities and commissioning, spread on cosine S-curves. It adds contingency, escalation, FX allowance, construction insurance, capitalised interest and fees, and covers sustaining, major maintenance, closure and salvage.
- Budget vs actual and variance to approved capex
- S-curve spend profiles per category
- Contingency, escalation and FX allowances
- Sustaining, replacement, expansion, closure and salvage capex
Lithium Plant Financial Statements
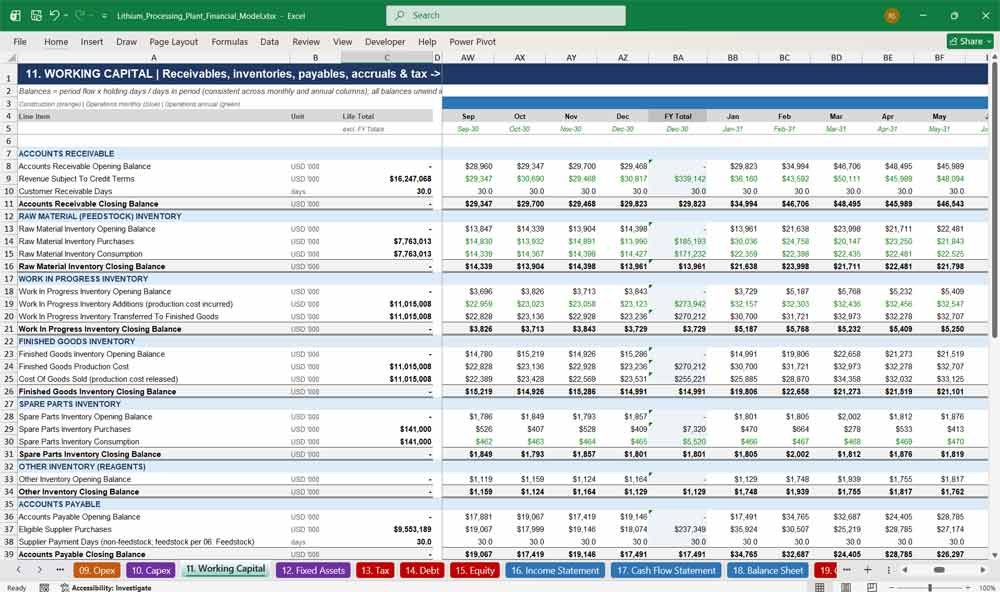
11. Working Capital
The Working Capital tab calculates receivables, raw material, WIP, finished goods, spare parts and reagent inventories, payables, accruals and taxes payable using holding days. The same logic works for monthly and annual columns, and all balances unwind at the end of life for accurate cash flows.
- Days-based receivables, inventories and payables
- Separate feedstock and supplier payment terms
- Net working capital and change in working capital
- Working capital funding and release
12. Fixed Assets
The Fixed Assets tab accumulates construction cost in CIP and transfers it to buildings, process plant, utilities and other assets at COD. Straight-line depreciation runs by asset class, sustaining capex is added over the operating life, and residual value is written off at closure to deliver a clean net book value schedule.
- CIP with capitalised interest and financing fees
- Asset class allocation from the capex budget
- Depreciation by class with useful lives
- End-of-life impairment and NBV reconciliation
13. Tax
The Tax tab computes corporate income tax for the lithium project, with tax depreciation, loss carry-forward and a utilisation cap, credits, investment tax credits, production incentives, tax holidays and minimum tax. It also models a cash tax payment lag, deferred tax assets and liabilities, royalties and government levies.
- Taxable income with loss carry-forward
- Investment and production tax credit options
- Cash tax payable with payment lag
- Deferred tax, royalties, levies and effective tax rate
14. Debt
The Debt tab is a full project finance senior debt schedule. It covers commitment sizing, pro-rata drawdown with equity, interest during construction, commitment and arrangement fees, a grace period and amortisation, optional cash sweep, DSRA funding and release, and DSCR, LLCR, interest cover and covenant tests, with no circular references.
- Debt sizing by gearing with IDC rolled up
- Repayment schedule, cash sweep and refinancing inputs
- Debt service reserve account
- DSCR, LLCR, ICR, debt/EBITDA and covenant breach flags
15. Equity
The Equity tab tracks sponsor funding by purpose: construction, cost overruns, working capital, DSRA and cash shortfalls. Funding is split between share capital, share premium and shareholder loans with PIK interest. It also tracks retained earnings, dividends, return of capital and distributions to two sponsors with configurable ownership.
- Equity funding by purpose
- Shareholder loans with interest and repayment
- Retained earnings and dividend capacity
- Sponsor A and B contributions and distributions
16. Income Statement
The Income Statement presents lithium plant profitability from revenue by product through cost of goods sold, gross profit, operating expenses and EBITDA to net income. It includes inventory movement, depreciation, impairment, interest income and expense, shareholder loan interest, current and deferred tax, and margin analysis.
- Revenue by lithium product and by-product
- COGS grouped by cost category
- EBITDA, EBIT and net income with margins
- Capitalised interest memo line
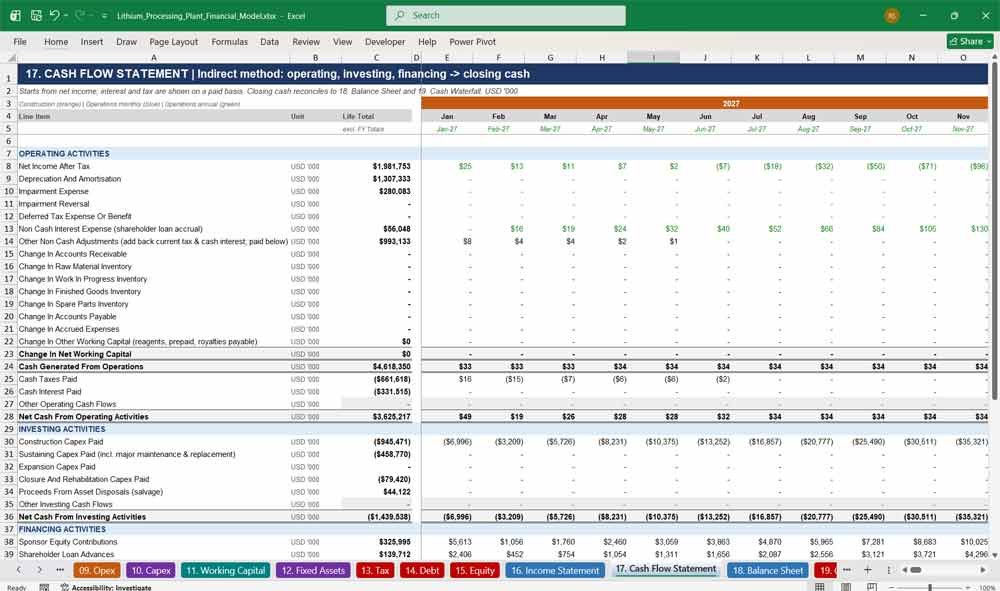
17. Cash Flow Statement
The Cash Flow Statement uses the indirect method to convert net income into operating, investing and financing cash flows. It shows working capital movements, cash taxes and interest paid, construction and sustaining capex, debt and equity flows, DSRA movements and distributions, and reconciles closing cash to the balance sheet and cash waterfall.
- Indirect operating cash flow
- Capex, salvage and closure in investing activities
- Debt, equity, shareholder loan and dividend flows
- Cash reconciliation check
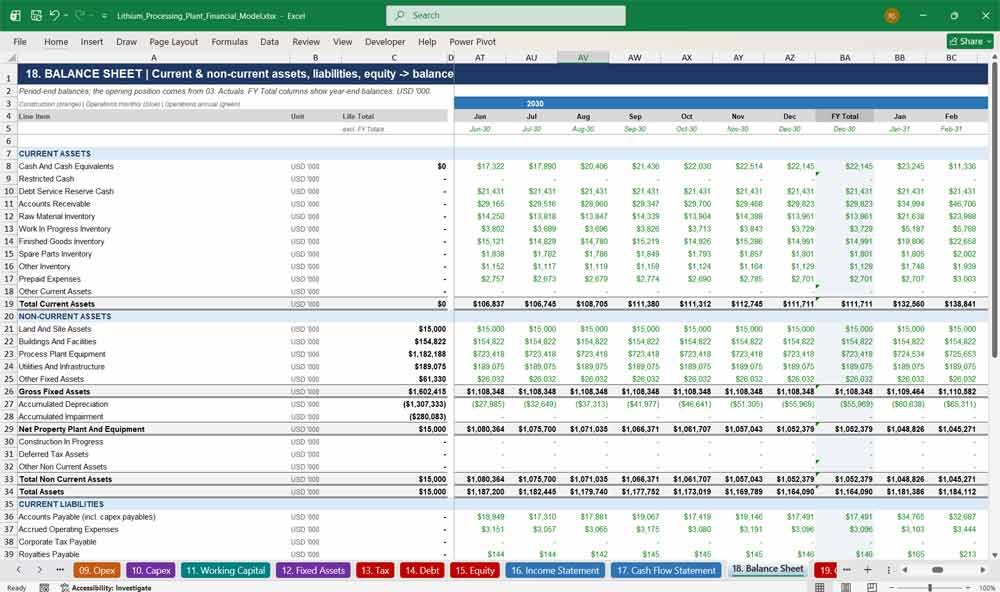
18. Balance Sheet
The Balance Sheet reports assets, liabilities and equity at every period end, starting from the opening position in Actuals. It covers cash, DSRA, working capital, fixed assets, CIP, deferred tax, current and long-term debt, shareholder loans and shareholders’ equity. A balance check is built in and passes in every period.
- Full current and non-current classification
- Current portion of debt calculated automatically
- Share capital, premium and retained earnings
- Balance check in every period
19. Cash Waterfall
The Cash Waterfall applies a lender-style priority of payments: operating cash, capex, funding, interest and principal, cash sweep, DSRA and reserves, then distributions. Sponsor equity covers any shortfall below the minimum cash balance, and distributions are only paid when the DSCR lock-up test passes.
- Priority of payments each period
- Minimum cash and operating reserve
- DSCR lock-up for distributions
- CFADS and cash sweep calculations
Key Financial Metrics for a Lithium
20. DCF
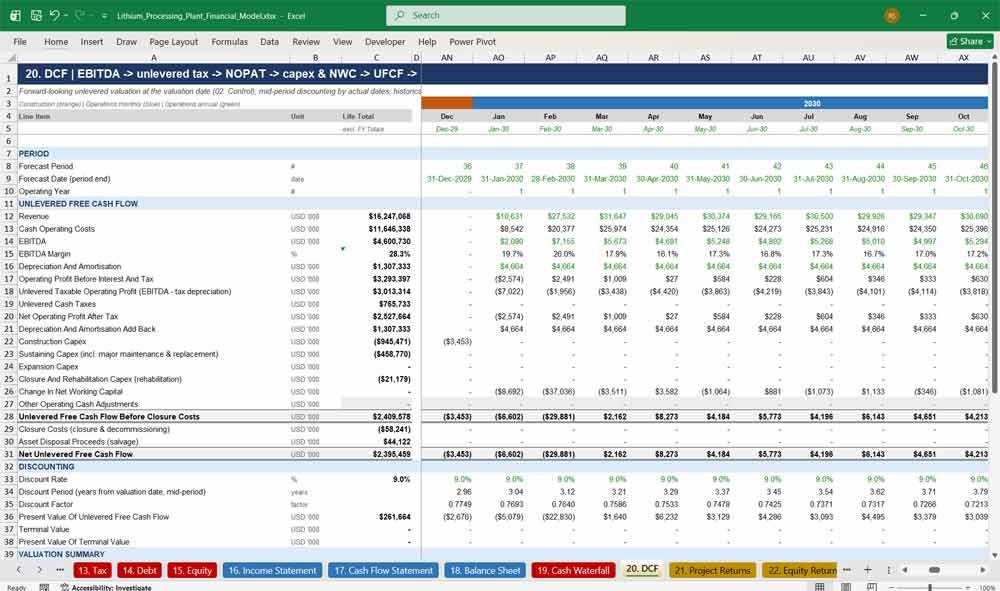
The DCF tab produces an unlevered discounted cash flow valuation of the lithium processing plant. It derives NOPAT, adds back depreciation, deducts capex, working capital and closure costs, and discounts free cash flow by actual dates. Optional Gordon growth or exit-multiple terminal values and discount-rate sensitivities are included.
- Unlevered free cash flow build-up
- Date-based mid-period discounting
- Optional terminal value (Gordon growth or exit multiple)
- Project NPV, enterprise value and implied value
21. Project Returns
The Project Returns tab measures project economics: pre-tax and post-tax project IRR using XIRR, NPV, payback and discounted payback, peak funding requirement, profitability index, return on invested capital and average margins. A switch lets you include or exclude sunk historical costs for full-cycle or forward-looking returns.
- Pre-tax and post-tax project IRR
- Payback and discounted payback from COD
- Peak funding and profitability index
- NPV vs XNPV reconciliation check
22. Equity Returns
The Equity Returns tab shows the sponsor’s perspective: equity and shareholder loan contributions against dividends, return of capital and loan repayments. It calculates levered equity IRR, sponsor IRR, equity NPV at the cost of equity, MOIC, cash yield, payback and peak equity requirement.
- Levered equity IRR and sponsor IRR
- MOIC and cash yield on equity
- Equity payback and peak equity funding
- Reconciliation to waterfall distributions
23. Sensitivity
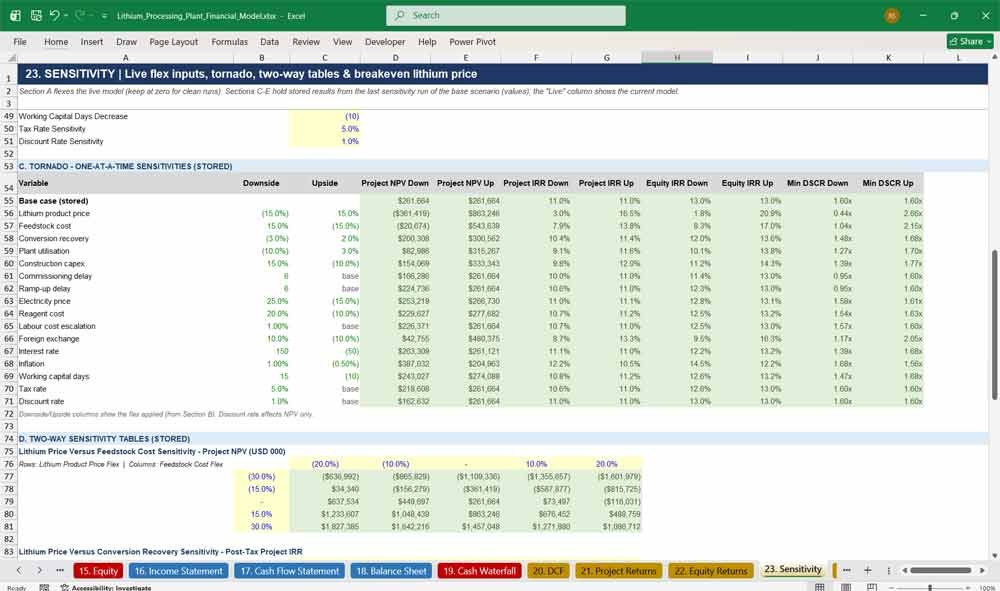
The Sensitivity tab stress-tests the lithium project. Sixteen live flex inputs (lithium price, feedstock cost, recovery, utilisation, capex, delays, energy, FX, interest rates, inflation, working capital, tax and discount rate) apply instantly across the model. It also includes a tornado, four two-way tables and breakeven lithium prices.
- 16 live flex inputs applied model-wide
- Tornado for NPV, IRR, equity IRR and DSCR
- Two-way tables, e.g. lithium price vs feedstock cost
- NPV and IRR breakeven lithium hydroxide prices
24. Scenarios
The Scenarios tab holds Base, Upside, Downside and Severe Downside assumption sets across 25 drivers, including lithium price, feedstock price and availability, grade, recovery, ramp-up, capex, delay, energy, interest rates, gearing, tax and closure costs. Live results are shown next to stored results for all four cases.
- Four complete scenario sets selectable from Control
- 25 scenario drivers
- Side-by-side outputs: revenue, EBITDA, IRR, NPV, DSCR, peak funding
- Comparison check flags when stored results need refreshing
25. Unit Economics
The Unit Economics tab breaks the lithium plant into per-tonne metrics: revenue, feedstock, reagent, energy, labour, maintenance and logistics cost per tonne, C1-style cash cost and all-in cost per tonne of LCE, EBITDA per tonne, capital intensity, breakeven prices, energy use and carbon emissions per tonne.
- Cost per tonne by category
- Cash cost and total cost per tonne of LCE
- Cash and EBITDA breakeven prices
- Energy, water and CO₂ intensity
26. Charts
The Charts tab aggregates the monthly and annual engine into a clean 23-year annual summary and six presentation-ready charts: production, revenue and EBITDA, free cash flow, debt profile with CFADS and debt service, cumulative project and equity cash flow, and unit margin per tonne of LCE.
- Annual summary by project year
- Six charts ready for investment memos
- Annual DSCR and EBITDA margin
- Updates automatically with every input
27. Checks
The Checks tab gives auditors and lenders confidence in every number. It aggregates 17 integrity checks into a single PASS/REVIEW flag: balance sheet, cash and waterfall reconciliations, debt corkscrew, sources and uses, lithium mass balance, inventory balances, tie-outs and calendar continuity. Commercial warnings are reported separately.
- 17 integrity checks with per-period status
- Overall PASS/REVIEW flag linked to Control and Dashboard
- Mass balance and funding checks
- Commercial warnings, e.g. covenant breaches and funding gaps
Why Buy This Model
Building a bankable lithium processing financial model from scratch takes weeks of specialist time and still carries the risk of hidden errors. This template gives you a complete, integrated and fully checked model from day one. Its 27 tabs cover feedstock, production, a lithium mass balance, revenue, opex, capex, three financial statements, project finance debt, a cash waterfall, valuation, returns, scenarios and sensitivities. It follows lender and investor formatting conventions: colour-coded inputs, formula-only forecasts, a single date-driven timeline and a dedicated checks tab. Every assumption is clearly labelled and editable, so you can adapt it to your own spodumene converter, lithium hydroxide refinery or carbonate plant and produce credible, investor-ready outputs in hours rather than weeks.
Lithium Plant Frequently Asked Questions
Can I use this model for my own lithium project, not just a spodumene converter?
Yes. The default case is a 25,000 tpa LCE spodumene-to-hydroxide converter, but capacity, product mix, feedstock grade, recovery, prices, costs and capex are all inputs. Seven lithium products and several by-products are included, so you can model hydroxide-only, carbonate-only or mixed plants.
What version of Excel do I need?
Microsoft 365 or Excel 2019 and later is recommended, because the model uses MINIFS, MAXIFS and XIRR. No macros or add-ins are required.
Does the model contain macros or circular references?
No. It is a standard .xlsx file with no VBA. Interest is calculated on opening balances, so there are no circular references and no need for iterative calculation.
How do I change the project start date?
Enter a new Model Start Date on the 02. Control tab. Every date, header, escalation index, debt date and chart label across all 27 tabs updates automatically.
Why are operating years 1–5 monthly and years 6–20 annual?
Construction and ramp-up are when cash flow, funding and covenant risk is greatest, so monthly detail matters most then. Once the plant reaches steady state, annual periods keep the model fast and readable. FY Total columns roll up each monthly year.
Are the default numbers real project data?
They are illustrative assumptions for a generic converter. The 2026 prices reference published benchmark assessments, and later years are an assumed price path. You should replace them with your own feasibility study, contract and market data before relying on the outputs.
How is the spodumene feedstock priced?
You can choose between pricing linked to the lithium hydroxide benchmark (a percentage of the LiOH price, adjusted for grade) and a fixed contract price with escalation. Freight, handling, insurance, duty, spot purchases and FX are all included.
Does it include project finance features that lenders expect?
Yes. It covers debt sizing by gearing, interest during construction, commitment and arrangement fees, grace period and amortisation, optional cash sweep, DSRA, DSCR, LLCR, interest cover, covenant tests and a priority-of-payments cash waterfall with distribution lock-up.
Can I run different scenarios?
Yes. Select Base, Upside, Downside or Severe Downside from the drop-down on 02. Control and the whole model recalculates. The Scenarios tab shows the live result next to stored results for all four cases.
How do the sensitivity tables work?
The 16 flex inputs on 23. Sensitivity apply live across the model, so you can test any change instantly. The tornado, two-way tables and breakeven prices are stored results from the base case, and a status check flags when inputs have changed since they were generated.
Does it calculate both project and equity returns?
Yes. It reports pre-tax and post-tax project IRR, NPV, payback, peak funding, profitability index and ROIC, as well as levered equity IRR, sponsor IRR, equity NPV, MOIC, cash yield and equity payback.
How do I know the model is error-free?
The 27. Checks tab runs 17 integrity checks every period: balance sheet, cash reconciliation, debt, sources and uses, mass balance, inventories and tie-outs. They combine into one PASS/REVIEW flag shown on the Control and Dashboard tabs.
Can I include costs already spent before construction?
Yes. Enter historical spend and funding on 03. Actuals; these form the opening balance sheet. A switch lets you include or exclude these sunk costs in the returns calculations.
Is it suitable for investor presentations and bank submissions?
Yes. The Dashboard and Charts tabs provide presentation-ready KPIs and visuals, and the formatting follows professional financial modelling standards that banks, investors and due diligence advisors recognise.
Further Reading
Streamline your project valuation and fundraising efforts with this specialized Lithium Mine Financial Model. Built specifically for the battery metals sector, this comprehensive template includes pre-configured structures for chemical processing costs, carbonate or hydroxide pricing premiums, grade recovery rates, and long-term cash flow forecasting to ensure an institutional-grade economic evaluation.
Final Notes on the Financial Model
This 20 Year Lithium Plant Financial Model must focus on balancing capital expenditures with steady revenue growth from diversified subscription-based services. By optimizing operational costs and power efficiency and maximizing high-margin services like Lithium Carbonate and Hydroxide Sales, this model ensures sustainable profitability and cash flow stability.
Download Link On Next Page
Download Link On Next Page