
Bauxite Mine Financial Model Excel Template
The Bauxite Mine Financial Model is a professional, bank-ready Excel template built for mining investors, project developers, lenders and consultants evaluating a greenfield open pit bauxite project. It covers the full mine life cycle in one integrated workbook: three years of monthly construction, five years of monthly operations with annual roll-ups, and annual projections out to a 35-year life of mine. Every schedule – mining, processing, logistics, workforce, CAPEX, tax, debt and returns – links back to a single set of assumptions, so you can test a bauxite mining investment case in minutes, not weeks.
25-Year Financial Model for a Bauxite Mine
What makes this bauxite financial model different is its switchable commercial strategy. With one selector you can compare a raw bauxite export scenario (mine to rail, port and ocean freight on a CIF basis), a domestic alumina refinery supply scenario, or a blended sales mix. Pricing, quality premiums and penalties, logistics costs, export duties, royalties and working capital all update automatically. This lets you answer the key question for any bauxite project: is it worth more to ship the ore overseas or to sell it to a local refinery?
The template follows lender-grade modelling standards: colour-coded inputs, formulas and links, a single master start date that re-dates the whole model, and 28 built-in integrity checks covering the balance sheet, cash flow, debt, production and reserve reconciliations. Outputs include a full three-statement financial model (income statement, balance sheet and cash flow statement), project and equity IRR, NPV, payback, DSCR and LLCR, a DCF valuation with WACC, live sensitivity tables and an executive dashboard with charts. It is ready for feasibility studies, investment committee papers and project finance discussions.
Model Tabs
01. Cover & Navigation
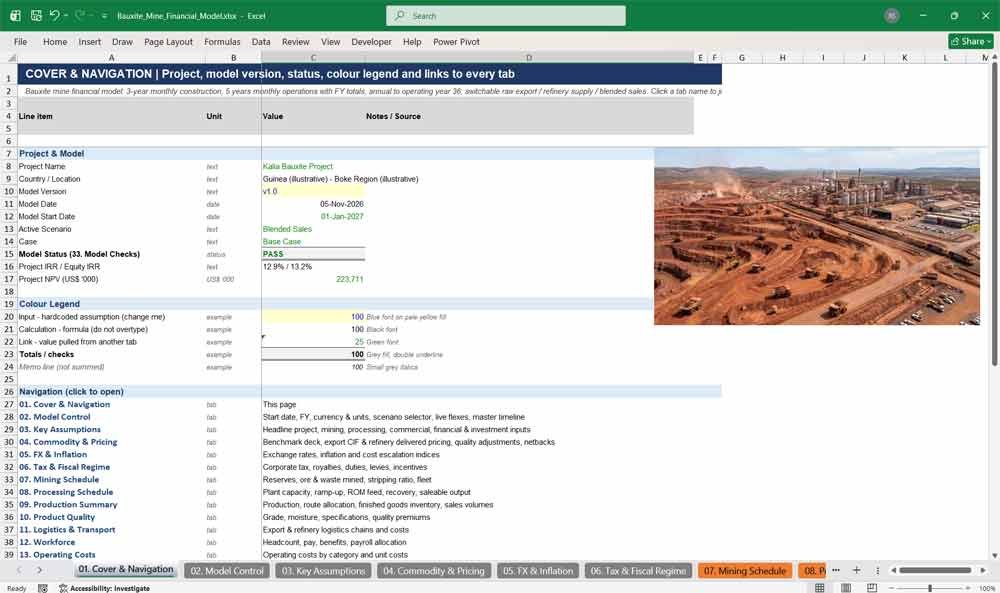
The cover page summarises the bauxite mine financial model at a glance: project name, model version, model date, active scenario, live IRR and NPV, and overall model status. Clickable navigation links take users directly to all 33 tabs, while a colour legend explains how inputs, formulas and links are formatted.
- Live project IRR, equity IRR and NPV headline
- One-click hyperlinks to every tab
- Model status pulled from the integrity checks
- Clear colour-coding legend for users and reviewers
02. Model Control
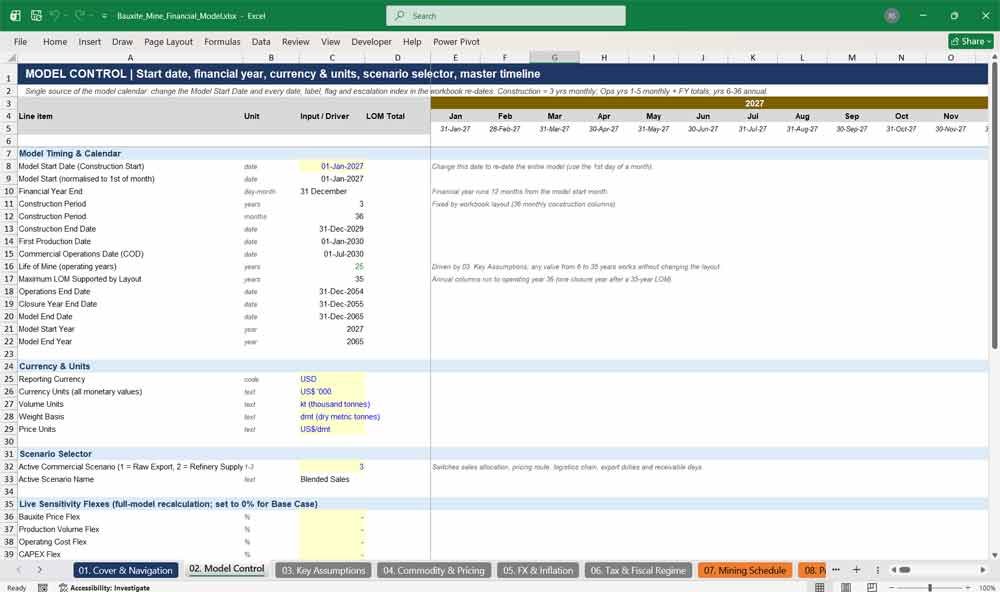
Model Control is the engine room of this mining financial model. Enter one model start date and every date, header, flag and escalation index re-dates automatically. Choose the commercial scenario, set currency and units, and apply live price, volume, OPEX, CAPEX and FX flexes for instant full-model scenario testing.
- Single master start date drives the whole workbook
- Raw Export / Refinery Supply / Blended scenario selector
- Live sensitivity flexes with base-case indicator
- Master timeline with construction, operations and closure flags
Bauxite Mine Production & Capex
03. Key Assumptions
The Key Assumptions tab holds every headline input for the bauxite project: project information, model configuration, infrastructure categories, resources and reserves, mining and processing parameters, commercial terms, operating, financial and investment assumptions. Detailed tabs link back here, so investors and analysts can review the full investment case on one page.
- Resources, proven and probable reserves and mineable reserves
- Plant capacity, availability, utilisation, recovery and yield
- Project category switches (rail, port, power, water, washing plant)
- Nominal and real discount rates, tax and royalty headlines
04. Commodity & Pricing
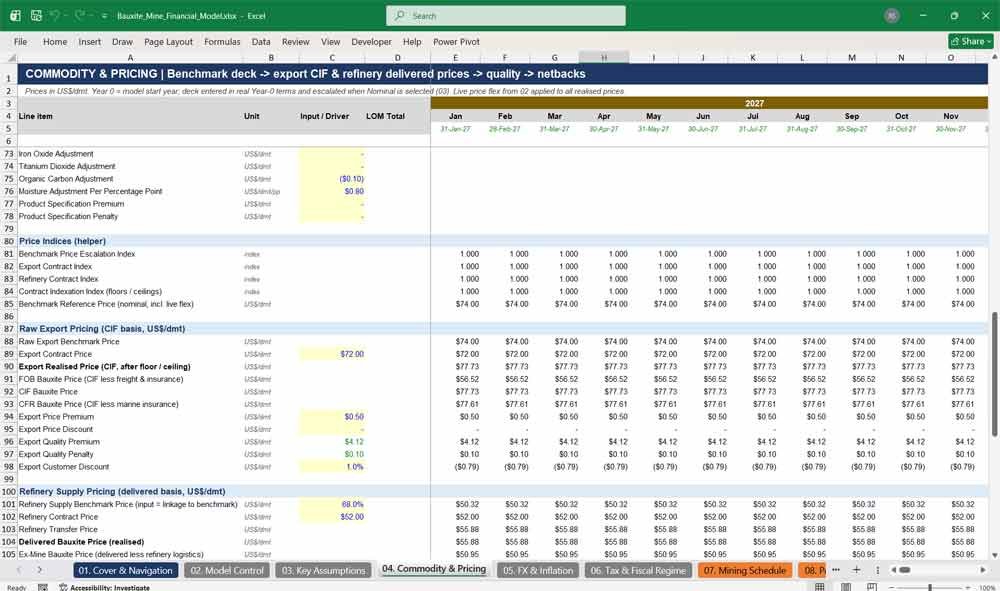
This bauxite pricing tab builds export CIF and refinery delivered prices from a benchmark price deck. It includes Guinea, Australian, global and Chinese import benchmarks, fixed or benchmark-linked contracts, price floors and ceilings, quality premiums and penalties, and FOB, CFR and CIF prices, as well as export and refinery netbacks.
- Year 0–5 and long-term bauxite price deck
- Export CIF, CFR and FOB price build-up
- Refinery transfer, delivered and ex-mine prices
- Alumina, silica and moisture quality adjustments
05. FX & Inflation
The FX and inflation tab converts local-currency operating costs at forecast exchange rates and builds escalation indices for every cost category. Switch between nominal and real modelling, enter annual inflation and FX forecasts, and see how currency depreciation or appreciation affects mining operating costs and project returns.
- Local currency, USD, EUR, GBP, AUD and CNY rates
- Annual FX and inflation forecasts plus long-term rates
- Category escalation indices for mining, labour, fuel and CAPEX
- Nominal versus real methodology switch
06. Tax & Fiscal Regime
This tab captures the mining fiscal regime in detail: corporate income tax, tax holidays and exemption periods, minimum tax, ad valorem and production royalties, export duties and levies, import duties, withholding taxes, VAT, tax depreciation rules, investment incentives and annual fiscal compliance fees for licences, land and community obligations.
- Tax holiday and exemption period modelling
- Ad valorem, production-based and minimum royalties
- Export duty, levy and per-tonne customs charges
- Import duty exemptions and tax stabilisation inputs
07. Mining Schedule
The mining schedule models ore and waste movement against the reserve base. Scheduled production is capped by remaining reserves, mining losses and dilution are tracked, and pre-stripping is capitalised. Stripping ratios, mining hours, productivity and the equipment fleet (excavators, haul trucks, dozers and drill rigs) are calculated automatically.
- Ore mined, waste mined and stripping ratio by period
- Reserve depletion and reserve reconciliation check
- Pre-production ore stockpiling and pre-stripping
- Automatic fleet sizing from material movement
08. Processing Schedule
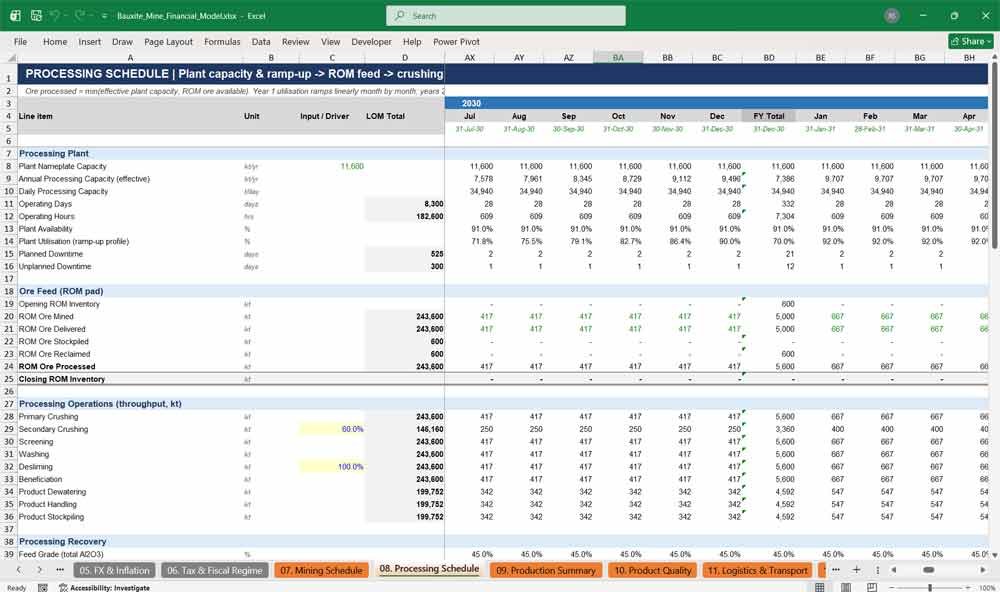
The processing schedule converts ROM ore into saleable washed bauxite. It models plant nameplate capacity, availability and a month-by-month Year 1 ramp-up, then ROM stockpile movements, crushing, screening, washing and desliming throughput, alumina recovery, mass yield, rejects, tailings and plant consumption of power, diesel, water and reagents.
- Monthly Year 1 plant ramp-up profile
- ROM pad stockpile and reclaim logic
- Recovery, yield, reject and tailings rates
- Electricity, diesel, water and reagent consumption
09. Production Summary
The production summary brings mining and processing together. It shows saleable bauxite production on a wet and dry basis, allocates output between raw export, refinery supply and domestic sales, and manages finished goods inventory with a target stock days policy. Production and stockpile reconciliations confirm that every tonne is accounted for.
- Wet and dry metric tonne production
- Route allocation driven by the scenario selector
- Finished goods inventory and sales volumes
- Life of mine and ramp-up production summaries
10. Product Quality
The product quality tab models bauxite chemistry from ROM feed grade through to the washed product. It calculates product total and available alumina, reactive silica, moisture and impurities, tests compliance against export and refinery specifications, and feeds quality premiums and penalties directly into the pricing tab.
- Al2O3, reactive silica, Fe2O3 and TiO2 grades
- Washing upgrade and silica rejection
- Export and refinery specification compliance
- Automatic quality premiums and penalties
11. Logistics & Transport
The logistics tab compares the full export chain – mine haulage, road, rail or conveyor to port, port handling and storage, ocean freight, demurrage and marine insurance – against direct refinery delivery. Unit costs per wet and dry tonne, capacity utilisation and the logistics bottleneck are all calculated for each scenario.
- Road, rail or conveyor transport mode selector
- Port charges, ocean freight and demurrage
- Refinery delivery and handling costs
- Logistics capacity and bottleneck analysis
12. Workforce
The workforce tab builds headcount by department – management, mining, processing, logistics and support – with a Year 1 ramp-up. It calculates salaries, wages, overtime, allowances, medical, pension, social security, bonuses, payroll tax, training and recruitment, plus expatriate and local splits, turnover and labour productivity.
- Headcount by role across five departments
- Full compensation and benefits build-up
- Turnover, new hires and headcount roll-forward
- Payroll cost allocation to operating costs
13. Operating Costs
The operating costs tab provides a detailed bauxite mining OPEX build-up covering mining, processing, fuel and energy, water and consumables, maintenance, logistics, workforce, G&A, environmental and social, and other site costs. Unit costs per wet, dry and saleable tonne are reported, with costs classified for inventory valuation and sensitivity analysis.
- Unit-rate driven mining and processing costs
- Diesel and electricity costs from consumption
- Operating cost per wet and dry tonne
- Fixed and variable cost classification
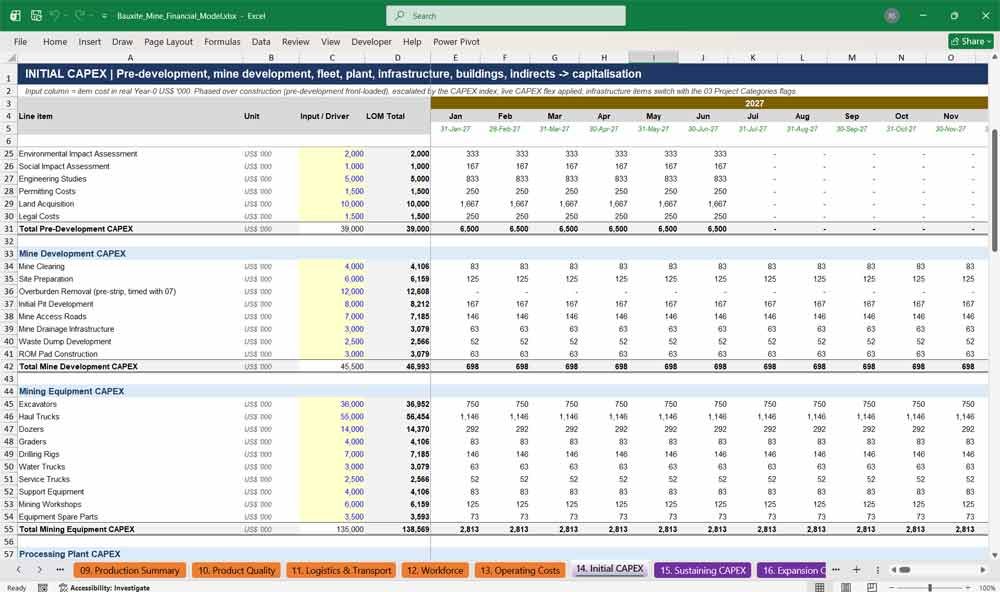
14. Initial CAPEX
The initial CAPEX tab builds the construction budget line by line: pre-development studies, mine development, mining fleet, processing plant, rail, port, power and water infrastructure, buildings, EPCM, owner’s costs, import duties and contingency. Spend is phased monthly across construction, escalated, and capitalised with pre-production costs and capitalised interest.
- Over 80 itemised capital cost lines
- Monthly construction phasing and escalation
- Infrastructure items switch with project categories
- Capitalisation summary and CAPEX timing check
15. Sustaining CAPEX
The sustaining CAPEX tab models fleet replacement on configurable cycles plus annual allowances for plant replacement, infrastructure upgrades, plant improvements, IT, safety and camp assets. Capital intensity metrics show sustaining capital per tonne, as a percentage of revenue and relative to initial investment.
- Fleet replacement by cycle (excavators, trucks, rigs)
- Plant, infrastructure and upgrade allowances
- Sustaining CAPEX per tonne and per cent of revenue
- No spend in the final two operating years
16. Expansion CAPEX
The expansion tab models an optional Phase 2 capacity increase. Switch it on to raise mining and plant capacity from a chosen year, with phased spend across mining, processing, infrastructure and commercial capacity. Indicative incremental production, revenue, EBITDA, cash flow and an incremental expansion IRR support the investment decision.
- Expansion on/off switch and timing
- Phased mining, processing and logistics spend
- Additional saleable production and revenue
- Incremental cash flow and expansion IRR
17. Rehabilitation & Closure
The closure tab estimates mine rehabilitation and closure costs: land rehabilitation, water management, infrastructure decommissioning, social closure, post-closure monitoring and contingency. A closure provision accrues over the mine life and is utilised as closure cash is spent, giving lenders a clear view of environmental liabilities.
- Itemised closure cost estimate
- Progressive rehabilitation during operations
- Closure provision build-up and utilisation
- Discounted closure liability memo
Bauxite Mine Financial Statements
18. Depreciation
The depreciation tab tracks twelve asset classes through capital work in progress, additions, straight-line or units-of-production depreciation, net book value and disposal at closure. A separate tax depreciation pool with initial and accelerated allowances calculates the book-tax difference for deferred tax.
- 12 fixed asset classes with individual useful lives
- Straight-line or units-of-production methods
- CWIP transfer at first production
- Tax written-down value and capital allowances
19. Revenue Build-up
The revenue tab multiplies sales volumes by realised prices for each route: raw export, refinery supply and domestic sales. It applies spot pricing effects, rejection allowances and rebates to reach net revenue, then reports realised prices per wet and dry tonne and export versus refinery revenue mix.
- Revenue by route: export, refinery and domestic
- Quality, moisture and customer discount detail
- Net revenue after rebates and adjustments
- Weighted average realised selling price
20. Working Capital
The working capital tab calculates receivables by customer route, consumables and finished goods inventory, supplier and contractor payables, payroll accruals, prepayments and VAT receivable and payable. Net working capital movements flow directly into the cash flow statement, capturing construction VAT and operating cash timing.
- Separate export and refinery receivable days
- Finished goods valued at production cost
- VAT receivable on construction and operating spend
- Net working capital and cash flow impact
21. Income Statement
The income statement presents revenue, cost of sales, gross profit, operating expenses, royalties and duties, EBITDA, depreciation, EBIT, finance costs, tax and net income for every period, with margins. An EBITDA tie-out check confirms consistency with the operating cost and revenue builds.
- Monthly and annual income statement
- Gross, EBITDA, EBIT and net income margins
- Royalties, export duties and closure charges
- Current and deferred tax expense
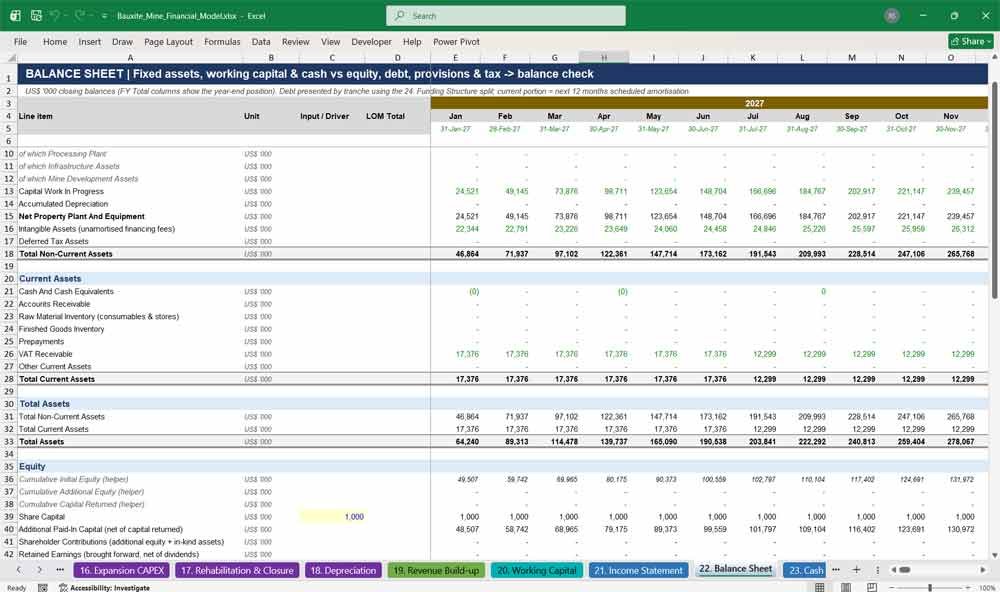
22. Balance Sheet
The balance sheet shows fixed assets, CWIP, intangible financing costs, deferred tax, cash, receivables, inventory and VAT against equity, debt by tranche, closure and rehabilitation provisions, payables and tax. A balance check confirms that assets equal liabilities plus equity in every period.
- Full balance sheet for every period
- Debt split by senior, subordinated, equipment and shareholder loans
- Closure and rehabilitation provisions
- Built-in balance sheet check
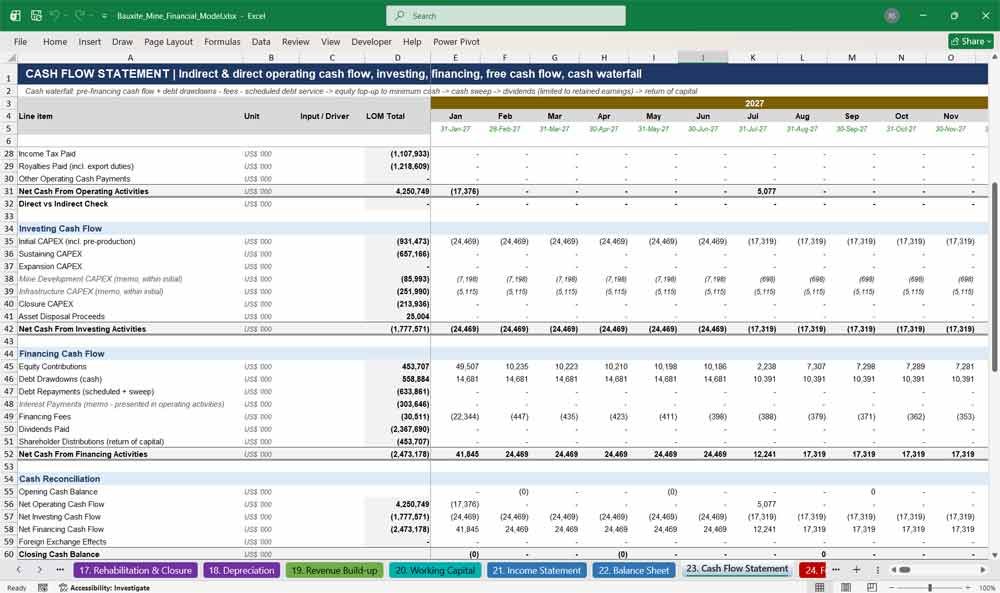
23. Cash Flow Statement
The cash flow statement includes operating cash flow on both the indirect and direct methods, investing and financing flows, free cash flow and a full cash waterfall. The waterfall handles debt service, equity top-ups to minimum cash, cash sweep, dividends limited to retained earnings and return of capital.
- Direct and indirect operating cash flow reconciliation
- Unlevered and levered free cash flow
- Cash waterfall with sweep and distributions
- Minimum cash balance management
24. Funding Structure
The funding structure tab sets out sources and uses for construction: development and construction CAPEX, pre-production costs, working capital, financing fees and capitalised interest, funded by sponsor and strategic equity and senior, subordinated, DFI, commercial bank, equipment and shareholder debt. A reconciliation confirms sources equal uses.
- Sources and uses of funds
- Gearing, debt-to-equity and leverage checks
- Arrangement, commitment, upfront and advisory fees
- Sponsor and strategic investor equity split
Key Model Components For A Bauxite Mine
25. Debt Schedule
The debt schedule models drawdowns, capitalised interest during construction, cash interest, grace period, straight-line or bullet amortisation and a cash sweep. It tests covenants and reports interest cover, DSCR, minimum and average DSCR, LLCR, debt payback and financing fee amortisation – the metrics project finance lenders expect.
- Construction drawdowns and capitalised interest
- Grace period, amortisation profile and cash sweep
- DSCR, LLCR and interest cover
- Covenant headroom and breach indicator
26. Tax Calculation
The tax calculation tab moves from accounting profit to taxable income through tax depreciation, non-deductible items, interest limits and closure timing, then applies losses, the tax holiday and exemption periods, minimum tax and investment credits. It also calculates royalties, export duties, cash tax and deferred tax.
- Tax loss carryforward, utilisation and expiry
- Effective tax rate with holiday and exemption
- Royalty and export duty calculations
- Deferred tax assets and liabilities
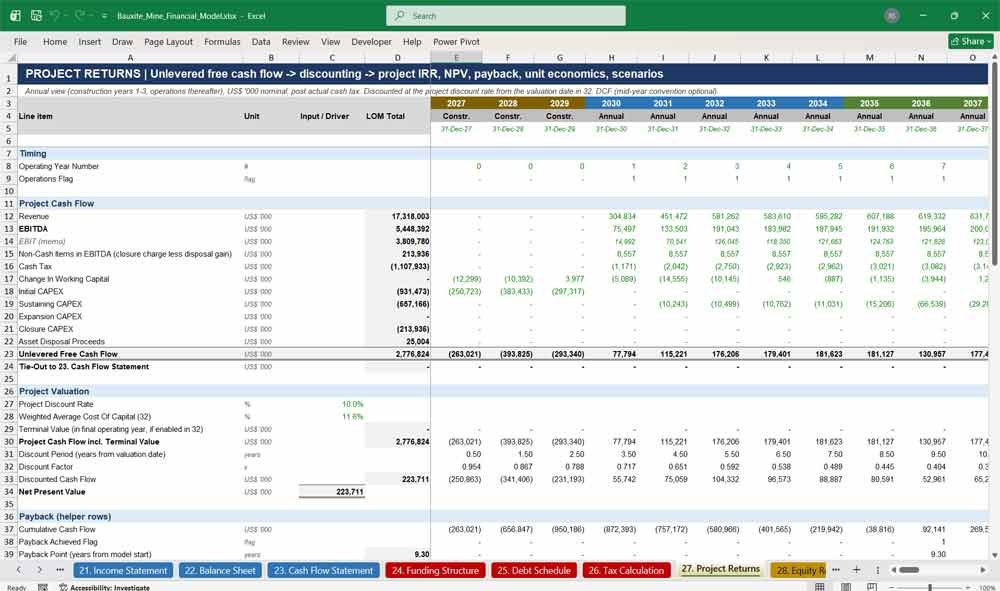
27. Project Returns
The project returns tab presents unlevered free cash flow on an annual basis and calculates project IRR, NPV, payback and discounted payback. It adds life of mine economics, unit economics per dry metric tonne, capital intensity and investment metrics, plus side-by-side returns for each commercial scenario.
- Project IRR, NPV and payback
- Revenue, cost and EBITDA per DMT
- NPV-to-CAPEX and capital efficiency
- Raw export vs refinery vs blended returns
28. Equity Returns
The equity returns tab calculates equity cash flows from contributions, dividends and capital returns net of withholding tax. It reports equity IRR, NPV at the cost of equity, payback, cash-on-cash return, multiple on invested capital, sponsor and investor returns, and equity returns for each commercial scenario.
- Equity IRR and MOIC
- Sponsor and strategic investor returns
- Dividend yield and return on equity
- Scenario equity IRR and NPV
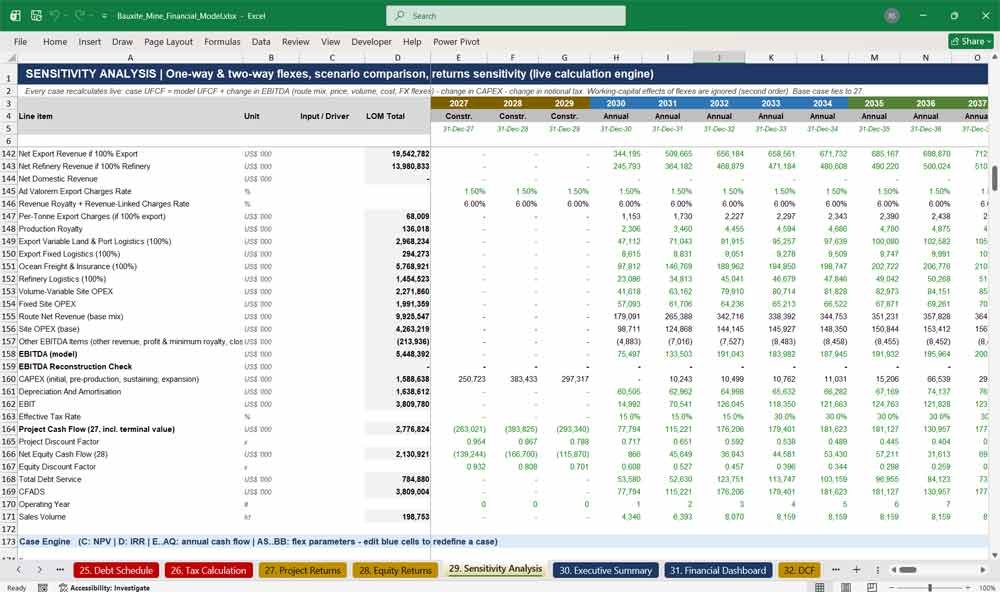
29. Sensitivity Analysis
The sensitivity tab runs a live calculation engine with no macros or data tables. It covers one-way sensitivities on price, production, CAPEX, OPEX, FX, logistics and route pricing, seven two-way NPV grids, returns sensitivity for IRR, NPV, EBITDA, payback and DSCR, and a full raw export versus refinery scenario comparison.
- Over 200 live sensitivity cases
- Seven two-way NPV sensitivity grids
- Scenario comparison including payback and cost per tonne
- No macros or Excel data tables required
30. Executive Summary
The executive summary condenses the bauxite investment case onto one page for boards and investment committees: project overview, description, reserves, production, commercial and financial highlights, investment returns, funding, scenario comparison, a key risk register with mitigants, and live investment highlights that update with the model.
- One-page investment case summary
- Key risk ratings and mitigants
- Preferred commercial scenario identified automatically
- Live, text-driven investment highlights
31. Financial Dashboard
The financial dashboard presents KPIs for production, revenue, profitability, cash flow, capital, funding and valuation, plus 14 charts covering ore and waste mined, production, reserves, revenue, EBITDA, free cash flow, CAPEX, debt and export versus refinery comparisons. Model monitoring shows every check status at a glance.
- 60+ live KPIs
- 14 production, financial and scenario charts
- Export versus refinery comparison charts
- Model monitoring status panel
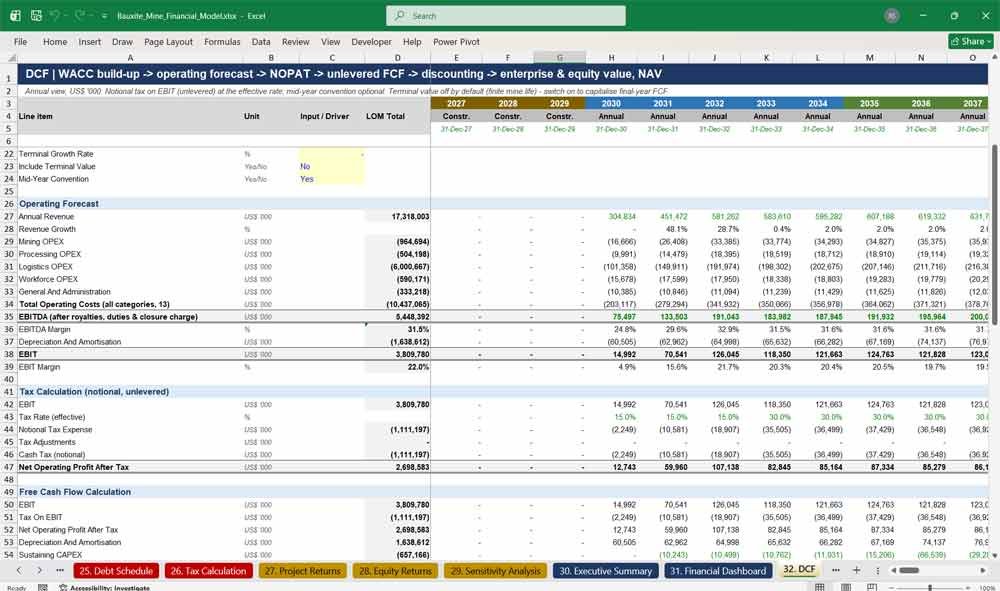
32. DCF
The DCF tab builds a full unlevered discounted cash flow valuation: WACC from risk-free rate, beta, equity and country risk premiums and cost of debt; NOPAT and free cash flow; optional terminal value; mid-year convention; enterprise value, equity value and net asset value, with EV per annual tonne and per reserve tonne.
- WACC and cost of equity build-up
- Enterprise value, equity value and NAV
- Mid-year convention and terminal value options
- EV per annual tonne and per reserve tonne
33. Model Checks
The model checks tab aggregates 28 integrity tests – balance sheet, cash, debt, production, ROM, reserve, inventory, tax, revenue and cost reconciliations, plus input validation and commercial warnings – into a PASS or REVIEW status for each period and an overall model status shown on the cover and dashboard.
- 28 automated integrity checks
- Period-by-period PASS / REVIEW status
- Covenant, capacity and take-or-pay warnings
- Overall model status feeding cover and dashboard
Why Buy This Model?
Building a bankable bauxite mine financial model from scratch can take weeks of specialist time and still leave hidden errors. This template gives you a fully integrated, lender-grade Excel model that is ready to use straight away. It covers mining, processing, product quality, logistics, workforce, CAPEX, closure, tax, project finance and valuation, and lets you compare raw bauxite export against refinery supply with a single switch. Every number flows from clearly marked inputs, the whole timeline re-dates from one start date, the mine life flexes from 6 to 35 years without restructuring, and 28 built-in checks give you and your lenders confidence in the results. It is ideal for feasibility studies, investor presentations, debt raising, due diligence and strategic decisions on how to monetise a bauxite deposit.
Bauxite Mining Frequently Asked Questions
Q: I’m evaluating a bauxite deposit in West Africa. Will this model work for my project?
A: Yes. The model is built for open pit bauxite projects and comes populated with illustrative assumptions for a generic West African project. Every assumption – reserves, grades, prices, costs, tax and royalties – is an editable input, so you can tailor it to any jurisdiction, including Guinea, Ghana, Sierra Leone, Australia, Brazil, India or Indonesia.
Q: Can I compare exporting raw bauxite with supplying a local alumina refinery?
A: Yes – this is a core feature. One selector switches between Raw Export, Refinery Supply and a Blended split. Prices, logistics, duties, royalties and working capital all update automatically, and the sensitivity tab shows IRR, NPV, EBITDA, payback and cost per tonne for each scenario side by side.
Q: What time periods does the model cover?
A: Three years of monthly construction, five years of monthly operations with annual totals, then annual periods. The layout supports a life of mine of up to 35 years plus a closure year.
Q: How hard is it to change the project start date?
A: Very easy. Change the start date on the Model Control tab and every date, year header, flag and escalation calculation across the workbook updates automatically.
Q: Can I change the mine life without rebuilding the model?
A: Yes. Enter any mine life from 6 to 35 years. Production, depreciation, debt, closure timing and returns all adjust automatically, and a check warns you if your reserves don’t support the selected life.
Q: Does it include a full three-statement financial model?
A: Yes. It includes a fully linked income statement, balance sheet and cash flow statement for every period, with a balance sheet check and direct-versus-indirect cash flow reconciliation.
Q: Is the model suitable for project finance and presenting to banks?
A: Yes. It includes a funding structure with sources and uses, a debt schedule with capitalised interest, grace period, amortisation and cash sweep, plus DSCR, LLCR, interest cover and covenant testing – the metrics lenders and DFIs typically ask for.
Q: What returns and valuation outputs will I get?
A: Project IRR and NPV, equity IRR and NPV, payback and discounted payback, MOIC, cash-on-cash return, and a full DCF with WACC, enterprise value, equity value and net asset value, as well as EV per tonne metrics.
Q: Do I need macros or special add-ins?
A: No. The model is built entirely with standard Excel formulas, with no VBA, macros or data tables, so it is transparent and easy to audit. Even the sensitivity analysis recalculates live.
Q: How do I know which cells I can change?
A: The model uses standard colour coding: blue text on a pale yellow background is an input, black is a formula and green is a link from another tab. A legend on the cover page explains the convention.
Q: Can I model royalties, export duties and tax holidays?
A: Yes. The Tax & Fiscal Regime tab covers ad valorem, production-based, profit-based and minimum royalties, export duties, levies and per-tonne charges, import duties, tax holidays, exemption periods, minimum tax, investment credits and tax loss rules.
Q: Does the model handle product quality premiums and penalties?
A: Yes. It calculates washed product grade from feed grade, recovery and yield, tests it against export and refinery specifications, and applies alumina premiums, silica and moisture penalties to the prices automatically.
Q: Can I include a future expansion?
A: Yes. An optional Phase 2 expansion can be switched on with a chosen start year. It increases mining and plant capacity, phases the expansion CAPEX, and reports indicative incremental cash flow and an incremental IRR.
Q: How do I check the model is working correctly after I change inputs?
A: The Model Checks tab runs 28 integrity tests every time the model recalculates and shows PASS, REVIEW or WARNING. The overall status is also shown on the cover page and dashboard.
Q: Can I run sensitivities and stress tests?
A: Yes. The Sensitivity Analysis tab includes over 200 live cases covering price, production, CAPEX, OPEX, FX, transport and freight, as well as seven two-way NPV grids. You can also apply live flexes on the Model Control tab to re-run the full model.
Q: Which currency and units does the model use?
A: By default it reports in US$ ‘000, with volumes in thousand dry metric tonnes and prices in US$ per dmt. Local-currency costs are converted using forecast exchange rates, and the currency labels can be edited.
Q: Will it work in my version of Excel?
A: The model is designed for Microsoft Excel 2010 or later on Windows or Mac and uses standard functions throughout. It also opens in LibreOffice.
Q: Are the numbers in the model real project data?
A: No. The model ships with illustrative placeholder assumptions to show how it works. Replace them with your own study data, market forecasts and fiscal terms before using the results for decisions.
Further Reading
-
Maximize your asset evaluation and investment analysis with this institutional-grade Copper Mine Financial Model. This specialized template features dynamic inputs for grade recovery, smelting and refining charges (TC/RCs), byproduct credits (like gold or molybdenum), and multi-scenario cash flow forecasting to accurately assess project economics.
- Accelerate your project analysis and investment decisions with this comprehensive Iron Ore Mining Financial Model. This production-ready template streamlines your evaluation process with integrated modules for grade-tonnage curves, logistical shipping costs, life-of-mine forecasting, and detailed NPV/IRR calculations
- Maximize your investment accuracy with a professional Aluminum Smelter financial model. This comprehensive tool provides detailed forecasting for capital expenditures, energy consumption, and global market pricing, allowing developers and commodity investors to project precise project returns and evaluate operational viability effortlessly.
Final Notes on the Financial Model
This 25 Year Baauxite Mine Financial Model Template must focus on balancing capital expenditures with steady revenue growth from diversified commodity mining. By optimizing operational costs, power efficiency, and maximizing high-margin services, this model helps to ensure sustainable profitability and cash flow stability.