
Aluminum Smelter Financial Model Template
This Excel financial model is built for greenfield primary aluminum smelters and is ready for investors, lenders and developers to use. It covers a three-year monthly construction period and 25 years of operations. The first five operating years run monthly with annual roll-ups, and the rest are annual. You get integrated financial statements, a full project finance debt schedule, a DCF valuation and project and equity IRR. Every figure comes from transparent, formula-driven inputs, so the aluminium smelter economics can be audited from potline to net income.
25-year Financial Model for an Aluminum Smelter
Physical drivers are kept separate from financial assumptions, which makes the model easy to audit and gives meaningful sensitivity analysis. Production is built up from potline capacity, availability, utilization, ramp-up and operating days. Power demand comes from kWh per tonne and alumina demand from tonnes per tonne of aluminum. Carbon anode demand follows gross consumption, butt returns and the coke and pitch recipe. Prices, tariffs and escalation are then applied to these physical quantities, giving clear cost curves for electricity, alumina, carbon and other raw materials.
The model is built to bankable standards: color-coded inputs, a single master start date that re-dates the whole workbook, no circular references and no macros. It also includes 16 automated integrity checks. A scenario selector and a 12-driver tornado analysis let you test LME aluminum price, electricity price, alumina price, capex, FX, construction delay, ramp-up and interest rate. You’ll see the effect on project IRR, equity IRR, NPV and DSCR straight away.
Model Tabs
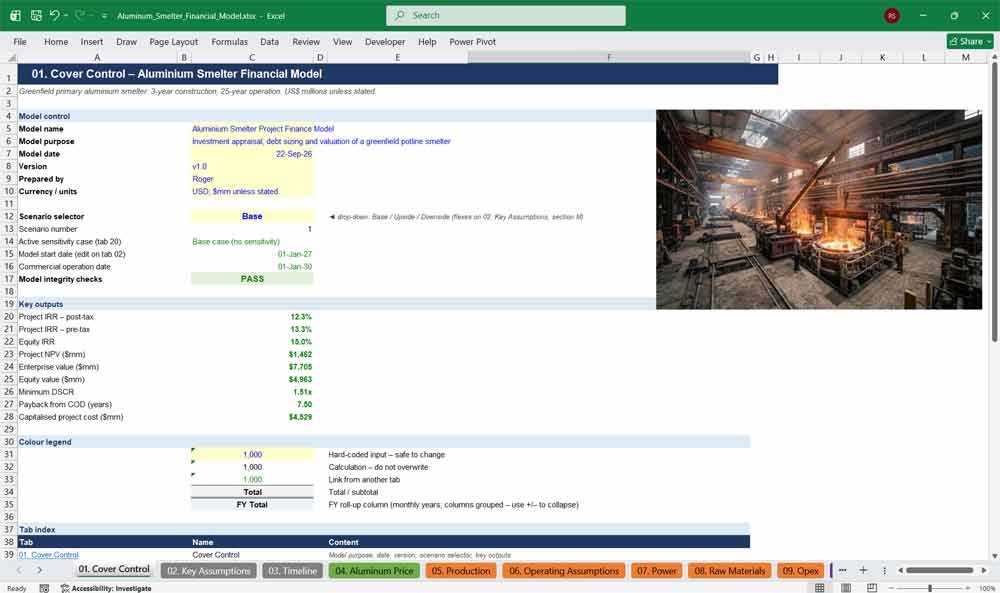
01. Cover Control
The Cover Control tab is the model’s command center. It sets out the model’s purpose, date and version and holds the Base, Upside and Downside scenario selector. It also shows live headline outputs and the model integrity status, with a hyperlinked index to all 22 tabs.
- Drop-down scenario selector (Base / Upside / Downside)
- Headline IRR, NPV, EV, DSCR and payback at a glance
- Overall integrity check status (PASS / REVIEW)
- Color legend and hyperlinked tab index
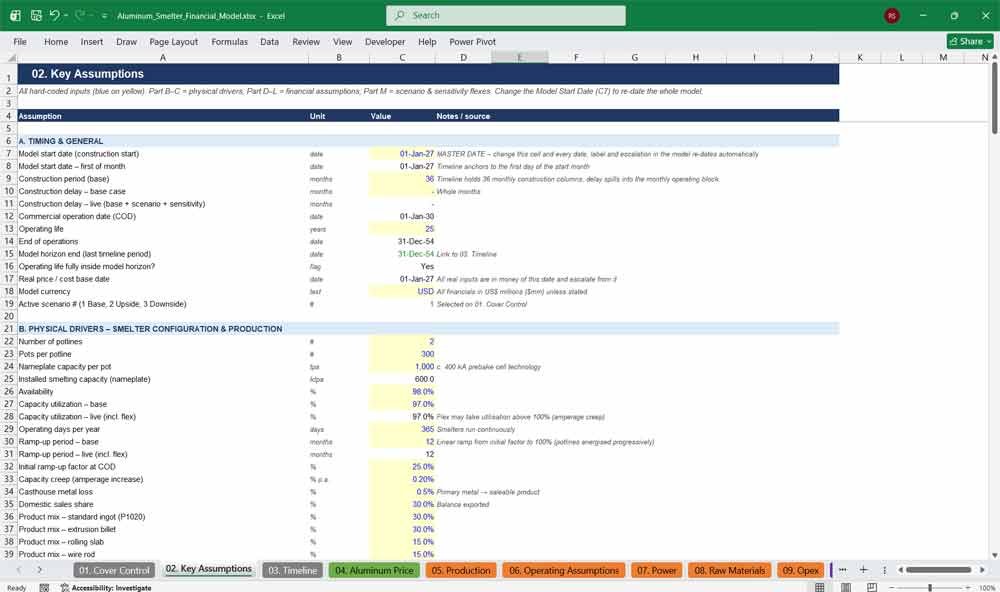
02. Key Assumptions
This tab holds every input for the aluminum smelter model in one place. Physical drivers are grouped separately from financial assumptions. It covers timing, potline configuration, unit consumption, LME price deck, tariffs, operating costs, capex, working capital, tax, financing, valuation and scenario flexes.
- One master start date re-dates the entire workbook
- Physical drivers and financial assumptions in separate sections
- Real price deck with CPI escalation to nominal
- Scenario and sensitivity flexes combined into live values
Aluminum Smelter Expenses
03. Timeline
The master timeline drives every calculation: 36 monthly construction periods, 60 monthly operating periods with FY roll-ups, and 20 annual periods. Date-driven flags for construction, operations, COD and final periods keep the model accurate if dates or delays change.
- Horizontal timeline labeled by year (2027, 2028, and so on)
- Construction, operations, COD and end-of-life flags
- Year fractions and mid-period dates for accurate discounting
- CPI escalation index from the real base date
04. Aluminum Price
The Aluminum Price tab converts a real LME aluminum price deck into nominal prices. It then adds regional premiums, product premiums and export logistics discounts. The result is a transparent realized-price build-up, the most important revenue driver in any smelter valuation or feasibility study.
- LME price deck, real to nominal
- Regional / physical premium (e.g. Midwest, Rotterdam, MJP)
- Product premiums for billet, slab, rod and alloys
- Realized price = LME + premiums – discounts
05. Production
This tab calculates primary aluminum output from potlines, pots per line, nameplate capacity per pot, availability, utilization, ramp-up factor and operating days. Capacity creep from amperage increases is included, giving a realistic smelter production profile from first metal to full output.
- Installed capacity (ktpa) built up from pots and potlines
- Linear ramp-up from an initial factor to 100% over a set number of months
- Capacity creep and effective utilization tracking
- Annual production growth on roll-up columns
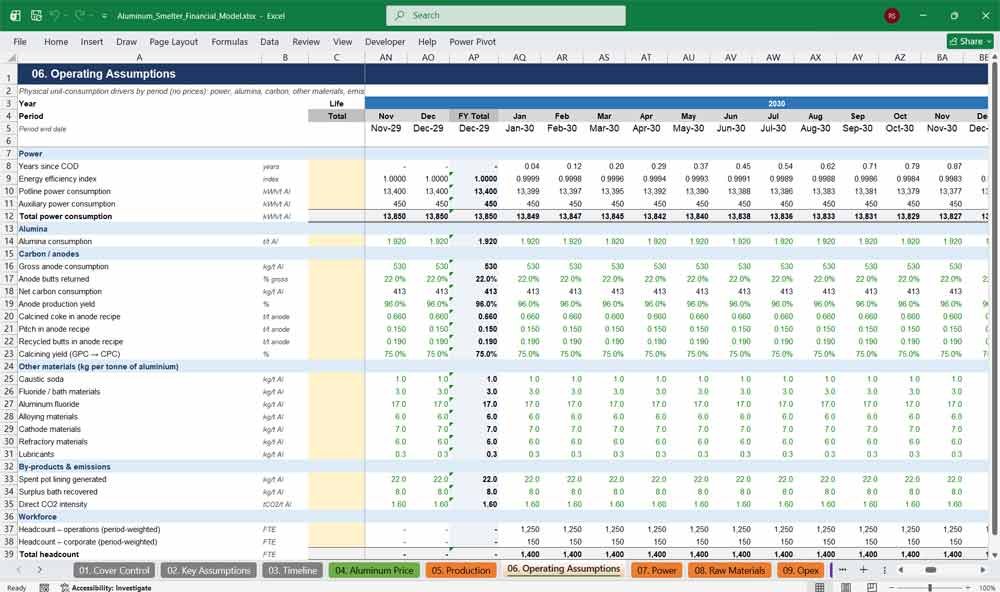
06. Operating Assumptions
Operating Assumptions sets out the physical unit-consumption drivers by period, with no prices mixed in. It covers power (kWh/t), alumina ratio, gross and net anode consumption, anode recipe, other materials, spent pot lining, CO₂ intensity and headcount, keeping the smelter’s physical economics fully auditable.
- Potline and auxiliary power consumption with efficiency gains
- Alumina ratio and carbon anode recipe (coke, pitch, butts)
- Consumption rates in kg/t for fluoride, cathode, refractory and other materials
- CO₂ intensity and workforce headcount
07. Power
The Power tab turns aluminum tonnes into electricity demand in GWh, MWh and average MW load. It then applies the PPA energy charge, network charges, tariff escalation and sensitivity flex. Electricity is typically a smelter’s largest cost, so this tab shows power cost in $mm and $/t clearly.
- Tonnes × kWh/t → MWh required
- MWh × $/MWh → electricity cost
- PPA energy and transmission charges with escalation
- Average smelter load in MW
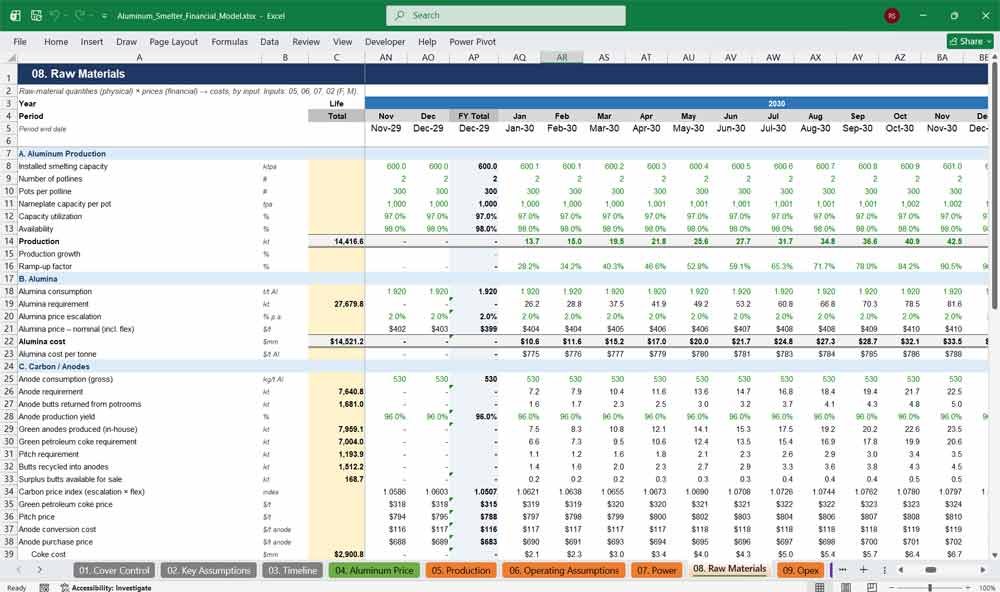
08. Raw Materials
Raw Materials models alumina, carbon anodes, electricity and other consumables through clear quantity-times-price logic. An in-house anode switch changes the carbon cost basis from purchased anodes to green petroleum coke, pitch and conversion costs, with a full raw material cost per tonne summary.
- Alumina requirement and cost, fixed or LME-linked pricing
- In-house anode economics: GPC, pitch, butts, yield
- Other materials: AlF₃, cryolite, cathodes, refractories
- Total raw material cost, $/t and % of revenue
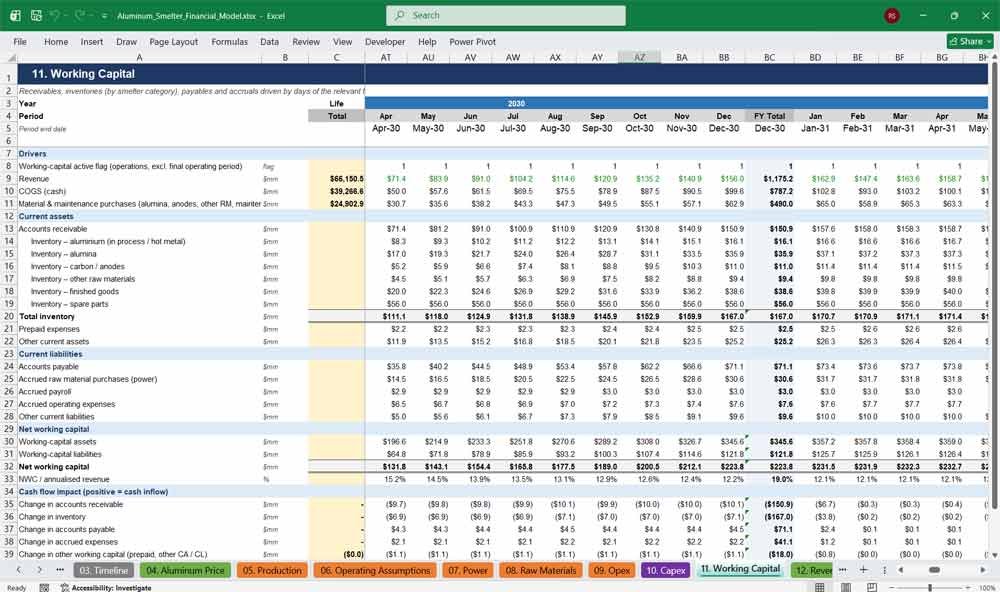
09. Opex
The Opex tab covers labor, maintenance, manufacturing and operating expenses, split into fixed and variable costs. Local-currency labor is converted at the live FX rate, and carbon costs, closure accruals and end-of-service provisions are included, so the cash cost of the smelter is comprehensive.
- Headcount-based labor with wage escalation and FX conversion
- Fixed and variable maintenance and manufacturing costs
- SG&A, insurance, environmental, R&D and carbon pricing
- End-of-service / pension provision roll-forward
10. Capex
This tab models initial construction capex across seven asset classes using an S-curve spend profile. It also covers owner’s costs, contingency, technology licence, sustaining and expansion capex, closure provisions, the fixed-asset register, depreciation by asset class and IFRS 16 lease accounting.
- S-curve construction spend with escalation and delay overruns
- Construction in progress transferred to PP&E at COD
- Depreciation by asset class plus vintage sustaining capex
- Closure / environmental provisions and IFRS 16 leases
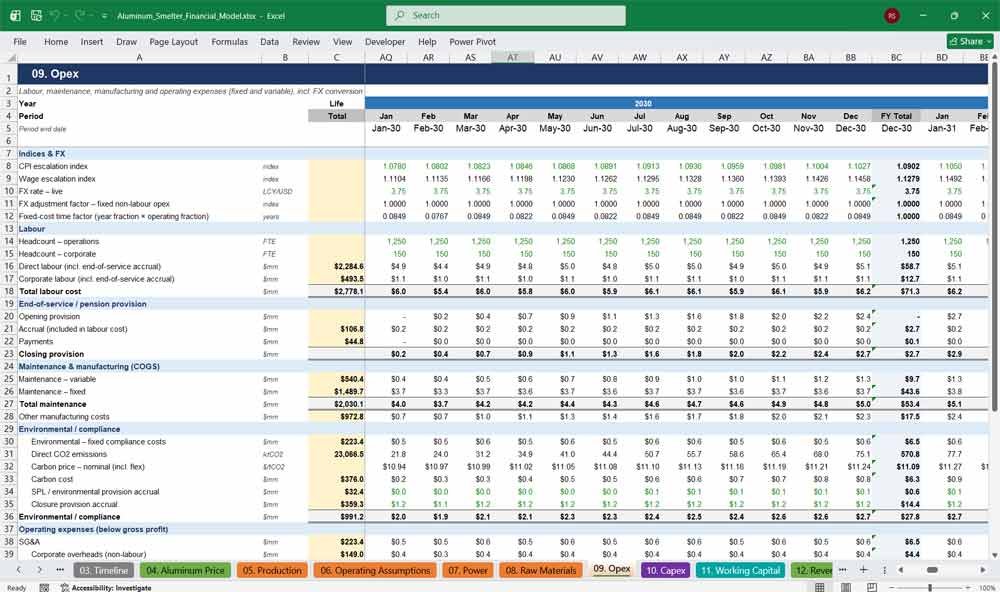
11. Working Capital
Working Capital calculates receivables, payables, accruals and inventory using days-based drivers. Inventory is split into categories specific to a smelter: aluminum, alumina, carbon, other raw materials, finished goods and spare parts. Balances release at end of life, giving accurate cash flow timing.
- Days-based AR, AP and accrual balances
- Separate inventory lines for each major smelter input
- Strategic spare parts held as a percentage of capex
- Reconciled cash flow impact of NWC changes
Aluminum Smelter Financial Statements
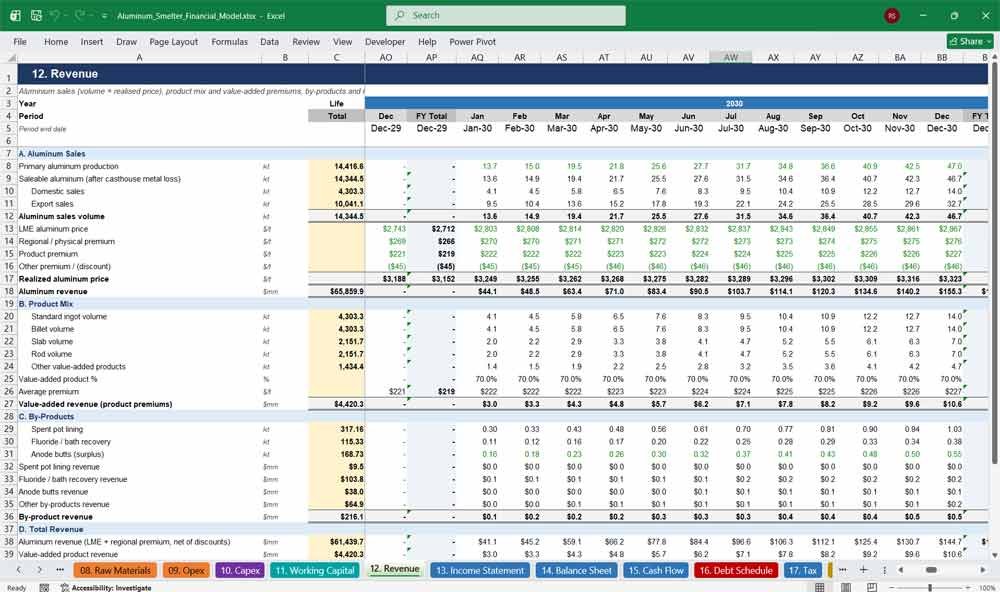
12. Revenue
The Revenue tab builds aluminum sales from saleable volume and realized price, with domestic and export splits. It also covers product mix (ingot, billet, slab, rod, alloys), value-added premiums and by-product revenue from spent pot lining, bath recovery and anode butts.
- Saleable volume after casthouse metal loss
- Domestic vs export sales volumes
- Value-added product mix and premium revenue
- By-product revenue and revenue per tonne
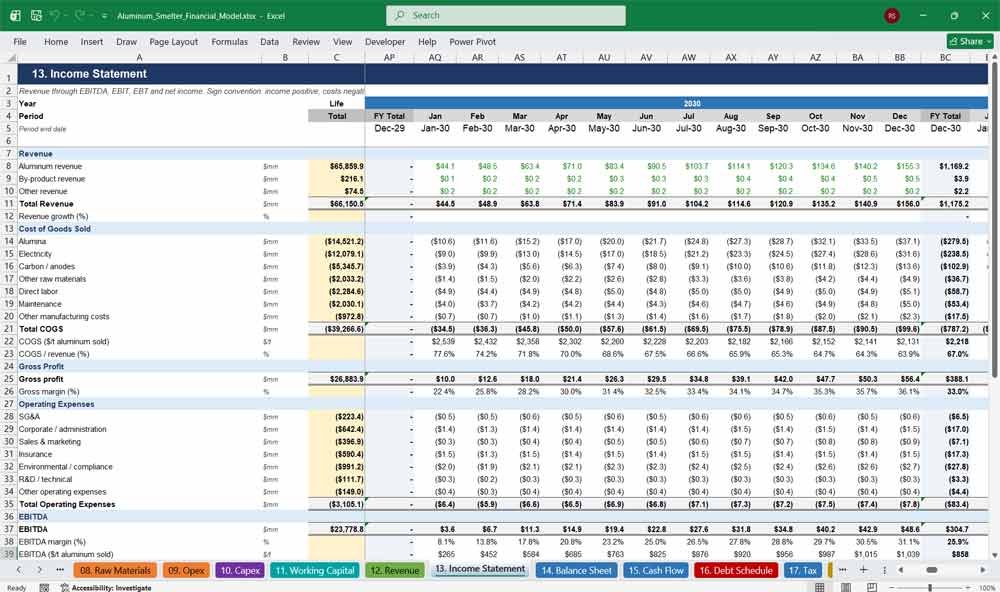
13. Income Statement
A full income statement running from revenue through COGS, gross profit, operating expenses, EBITDA, D&A, EBIT, non-operating items, EBT, tax and net income. Margins and per-tonne metrics make it easy to benchmark the smelter against industry cost curves and peers.
- Detailed COGS: alumina, power, carbon, labor, maintenance
- EBITDA, EBIT and net margins
- COGS and EBITDA per tonne of aluminum
- Capitalized interest excluded during construction
14. Balance Sheet
A fully integrated balance sheet with PP&E by asset class, construction in progress, intangibles and deferred tax. It includes inventory by category, project debt, shareholder loans, leases, closure provisions and equity. A balance check confirms that assets equal liabilities plus equity in every period.
- PP&E split: land, buildings, potlines, power, anode plant, casting
- Inventory split into six smelter categories
- Current and non-current debt and lease portions
- Balance check in every period
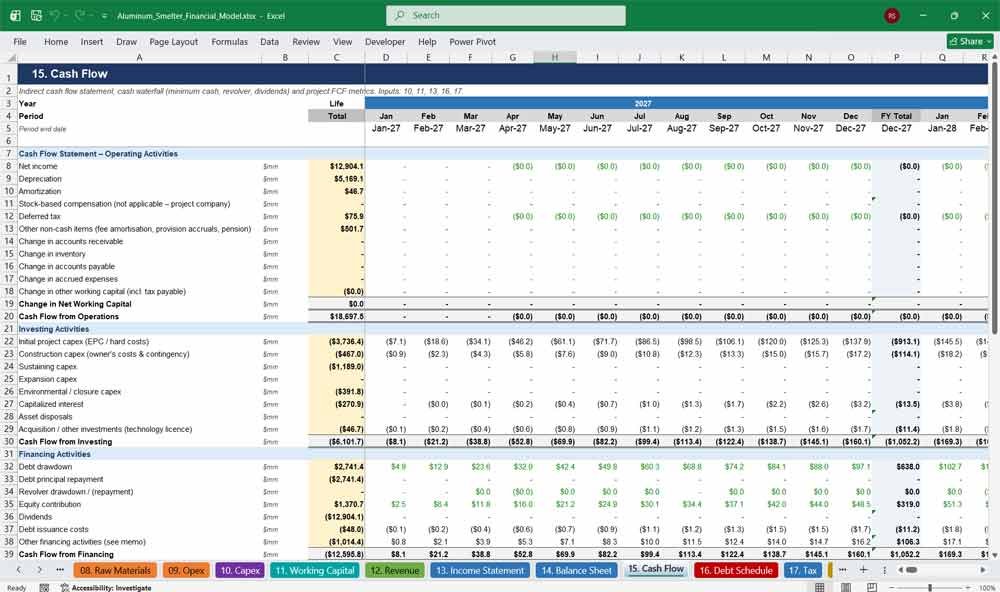
15. Cash Flow
The indirect cash flow statement reconciles net income to cash across operating, investing and financing activities. A cash waterfall handles minimum cash, revolver draws, dividends restricted to retained earnings, and capital repatriation, alongside free cash flow metrics for the project.
- CFO, CFI and CFF with full reconciliation
- Cash waterfall: minimum cash, revolver, dividends
- Capitalized interest shown in investing
- FCF, FCF/revenue and FCF/EBITDA
16. Debt Schedule
The project finance debt schedule covers sources and uses, pro-rata senior debt drawdowns, and interest during construction. It also includes upfront fees, grace period, amortization, DSRA, shareholder loan with PIK interest and a working-capital revolver, with CFADS-based DSCR calculated for every repayment period.
- Sources = uses check during construction
- Senior debt, DSRA and shareholder loan schedules
- Self-balancing revolver for ramp-up liquidity
- DSCR and net debt / EBITDA
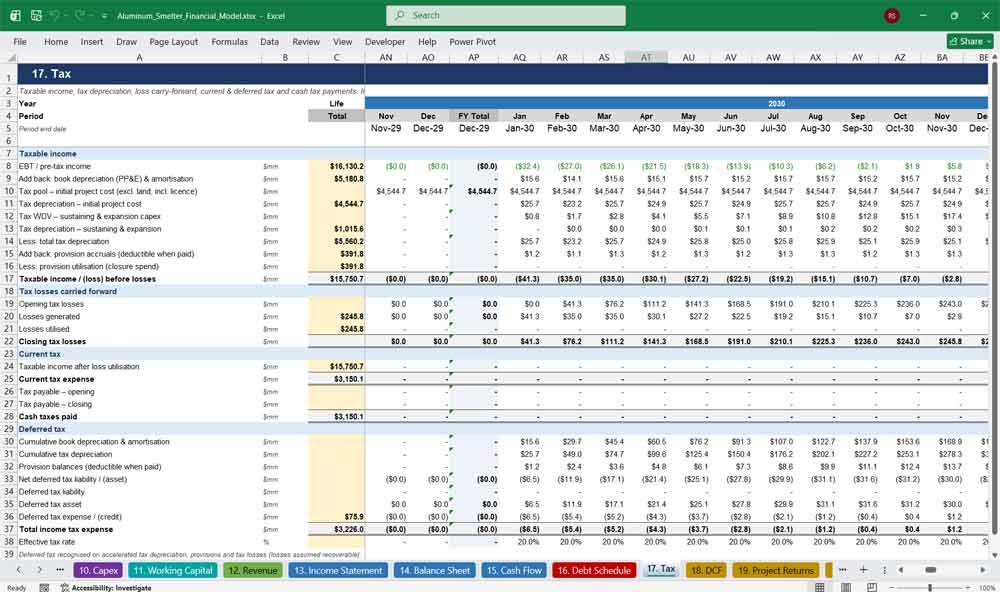
17. Tax
The Tax tab calculates taxable income using separate tax depreciation lives. It tracks loss carry-forwards with utilization caps, current and deferred tax, and cash tax payments with a lag. Temporary differences from provisions and accelerated tax depreciation drive a proper deferred tax asset and liability.
- Tax depreciation separate from book depreciation
- Tax loss carry-forward with utilization cap
- Current, deferred and cash taxes
- Effective tax rate by period
Key Financial Metrics For Your Aluminum Smelter
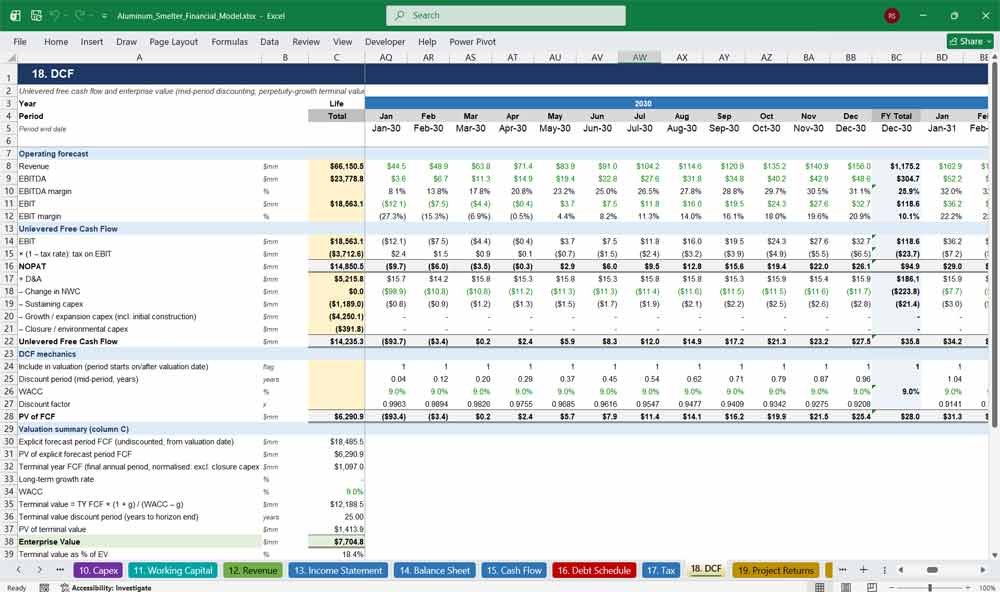
18. DCF
The DCF tab derives unlevered free cash flow from EBIT, NOPAT, D&A, working capital and capex. It discounts at WACC with mid-period timing and adds a perpetuity-growth terminal value. It then bridges enterprise value to equity value and implied value per share.
- NOPAT-based unlevered free cash flow
- Mid-period discounting from a selectable valuation date
- Perpetuity-growth terminal value (can be switched off)
- EV to equity value bridge and value per share
19. Project Returns
Project Returns calculates pre-tax and post-tax project IRR, equity IRR, NPV, payback and equity multiple. XIRR on actual period dates handles the mixed monthly and annual timeline exactly. Minimum and average DSCR, peak debt and capital intensity are also reported.
- Project and equity IRR using XIRR on actual dates
- Project and equity NPV
- Payback period and equity multiple (MOIC)
- DSCR statistics and capital intensity ($/t)
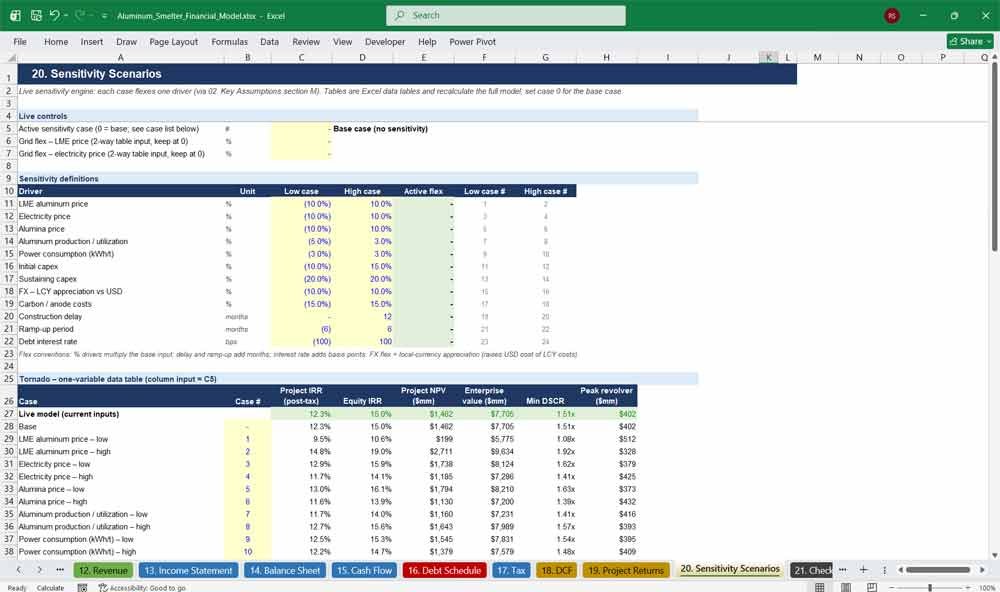
20. Sensitivity Scenarios
This tab runs 12 key smelter sensitivities through live Excel data tables. It produces a sorted tornado chart of NPV impact and a two-way LME price versus electricity price IRR grid, showing exactly which risks drive project value.
- 12 drivers: LME, power, alumina, utilization, kWh/t, capex, FX and more
- Construction delay, ramp-up and interest rate sensitivities
- Sorted tornado chart of NPV impact
- Two-way IRR table: LME × electricity price
21. Checks
The Checks tab runs 16 integrity checks in every period and flags four warnings. Checks cover balance sheet balancing, cash reconciliation, sources and uses, debt repayment and revenue ties, among others. An overall PASS/REVIEW status feeds the Cover and Dashboard, giving reviewers and lenders confidence in the numbers.
- Balance sheet, cash and retained earnings checks
- Debt, CIP and revenue reconciliation checks
- DSCR lock-up and revolver warnings
- Overall PASS / REVIEW status
22. Dashboard
The Dashboard presents headline returns, debt metrics and a 28-year annual summary. It includes charts for production, realized price, revenue, EBITDA margin, cash cost build-up, senior debt, DSCR and free cash flow, so it’s ready to use in investor presentations and board papers.
- KPI tiles for IRR, NPV, EV, DSCR and payback
- Annual summary table by calendar year
- Cash cost build-up chart vs realized price
- Debt, DSCR and free cash flow charts
Why Buy This Model
Building a bankable aluminum smelter financial model from scratch takes weeks of specialist time, and a single broken link can undermine a lender’s confidence. This model gives you a complete, integrated and fully checked framework from day one. It covers potline physics, power and alumina economics, carbon anode costs, project finance debt, tax, DCF valuation and sensitivities. Physical drivers are kept separate from prices, so you can audit every tonne and every dollar. There are no macros and no circular references, and a single start date re-dates the entire model. Whether you are screening a greenfield smelter, preparing a bank case or testing LME and power price risk, you can replace the illustrative inputs with your project data and have investment-grade outputs in hours, not weeks.
Aluminum Smelting Frequently Asked Questions (Faq)
Can I use this model for my own smelter project?
Yes. All inputs sit on the Key Assumptions tab: potline count, pot capacity, power consumption, tariffs, alumina price, capex, financing and more. Replace the illustrative values with your project data and every tab updates automatically.
Does it work if my construction starts on a different date?
Yes. Change the single master start date and every date, year label, escalation index and flag across all 22 tabs updates automatically. If you start mid-year, each model year is labeled by the year in which it ends.
Is the model suitable for bank or lender review?
It’s built to bankable standards: color-coded inputs, consistent formulas, separate physical and financial drivers, a full sources-and-uses reconciliation, DSCR calculations and 16 integrity checks with an overall PASS/REVIEW flag. Lenders can trace any number back to its inputs.
Does the model contain macros or circular references?
No. Interest is calculated on opening balances, so there are no circular references, and the file contains no VBA macros. It works in standard Excel with automatic calculation.
Can it model a smelter that produces its own anodes?
Yes. A switch lets you choose between in-house anode production and purchased anodes. With the in-house option, the model calculates green petroleum coke, pitch, recycled butts, anode yield and conversion costs, rather than using a single anode price.
Which sensitivities are included?
The model covers twelve: LME aluminum price, electricity price, alumina price, production/utilization, power consumption (kWh/t), initial capex, sustaining capex, FX, carbon/anode costs, construction delay, ramp-up period and debt interest rate. Results appear in a tornado chart and a two-way IRR table.
Can I run Base, Upside and Downside scenarios?
Yes. Select a scenario from the drop-down on the Cover Control tab. Each scenario applies its own flexes to prices, costs, capex, delay and ramp-up, and all outputs update instantly.
What financial outputs does the model produce?
It produces an integrated income statement, balance sheet and cash flow statement, plus project IRR (pre- and post-tax), equity IRR, NPV, payback, equity multiple, DSCR, enterprise value, equity value and value per share. It also calculates cash cost per tonne and EBITDA per tonne.
How is the debt structured?
Senior project debt is drawn pro-rata with sponsor equity during construction. It has capitalized interest, upfront fees, a grace period and straight-line amortization, plus a DSRA. The model also includes a shareholder loan with PIK interest and an automatic working-capital revolver for ramp-up liquidity. All terms can be changed.
Can I see the model in annual rather than monthly view?
Yes. The monthly columns are grouped, so you can collapse them with one click and see only the FY roll-up and annual columns. The Dashboard also shows a clean 28-year annual summary.
What currency is the model in, and can it handle local costs?
The model is in US dollars. Local-currency labor and a configurable share of fixed costs are converted at a live FX rate, so you can test the effect of currency movements on operating costs.
Are the default assumptions real market data?
No. The default inputs are illustrative placeholders chosen to produce a realistic smelter profile. Replace them with your own price forecasts, capex estimates and power contract terms before making any decisions.
Does it include closure and environmental costs?
Yes. Closure and decommissioning costs are accrued over the operating life and paid at the end. Spent pot lining provisions, carbon emissions costs and environmental compliance costs are also modeled.
Which version of Excel do I need?
Any modern desktop version of Excel (Microsoft 365, 2019 or 2021) is recommended. The sensitivity data tables need calculation set to Automatic.
Final Notes on the Financial Model
This 25 Year Aluminum Smelter Financial Model must focus on balancing capital expenditures with steady revenue growth from reliable revenue services. By optimizing operational costs, and power efficiency, and maximizing high-margin services like ingot sales, this model ensures sustainable profitability and cash flow stability.
Download Link On Next Page