
Upstream Oil Gas Financial Model Template
Financial Model for an Upstream Oil & Gas Company
What sets this E&P financial modeling template apart is its multi-asset architecture. Rather than forcing every field into a single set of assumptions, the model supports multiple fields and assets side by side — mature producing assets, offshore developments, gas and condensate plays, projects still ramping up, and pre-development exploration and appraisal opportunities — each with its own production profile, cost structure, and fiscal regime. Whether your portfolio runs on royalty and tax terms, a production sharing contract (PSC), or a mix of both, the model’s built-in fiscal toggle lets you switch regimes per asset without rebuilding a single formula, making it a genuinely flexible oil and gas valuation model rather than a one-off spreadsheet.
From production and pricing through operating costs, capital expenditure, depletion, working capital, fiscal terms, and corporate financial statements, every driver flows logically into the next — and ultimately into a full discounted cash flow (DCF) valuation, complete with separate Project DCF and Corporate DCF waterfalls, NPV and IRR analysis, net asset value (NAV), enterprise and equity value, and per-share output. Built-in scenario switching, sensitivity grids, and automated balance and reserve checks mean the model isn’t just a calculator — it’s a live decision-support tool for oil and gas investment analysis, portfolio planning, and corporate valuation.
Who This Upstream Oil & Gas Financial Model Is Built For
This Excel-based upstream oil and gas financial model is built for anyone who needs to turn reserves and production data into a defensible valuation. E&P corporate development and business development teams use it to screen new ventures, evaluate farm-in opportunities, and rank capital projects across a portfolio; investment bankers and equity research analysts use it to build oil and gas company valuations and support M&A and comparable transaction analysis; commercial banks and reserve-based lenders use it to stress-test borrowing-base assumptions against oil price, production, and fiscal downside cases; and private equity, infrastructure, and institutional investors use it to underwrite acquisitions spanning mixed royalty-and-tax and PSC portfolios. Because every driver — from decline curves to fiscal terms to the DCF waterfall — is transparent and fully linked, the model also doubles as a hands-on training tool for analysts and students learning oil and gas financial modeling from first principles.
Frequently Asked Questions About This Oil & Gas Financial Model
Do I need special software or add-ins to run it? No — this is a native Microsoft Excel financial model template with no macros, plug-ins, or third-party add-ins required, so it opens, calculates, and updates on any standard installation of Excel. Can it model more than five fields or assets? Yes — the assumptions, production, and fiscal architecture are designed to be copied and extended, so adding new fields, basins, or countries doesn’t mean rebuilding the model from scratch. Does it support both fiscal regimes at once? Yes — royalty-and-tax and production-sharing-contract terms run side by side in the same portfolio, switched per field with a single toggle, so mixed-regime, multi-country assets are modeled correctly rather than approximated. Can I use my own numbers? Absolutely — every figure is a live formula rather than a hardcoded value, so replacing the illustrative reserves, production, price, and cost assumptions with your own data produces a fully working, audit-ready oil and gas valuation model in minutes, not weeks.
Further Reading
Midstream Model: Are you looking to evaluate infrastructure assets, project pipeline cash flows, or pitch to energy investors? Master your valuation with this Institutional-Grade Midstream Oil & Gas Financial Model—fully dynamic, pre-structured for tariff revenue, and built to handle complex volumetric forecasting..
- Downstream Version: Maximize your returns and pitch with confidence using the industry’s most trusted Downstream Oil & Gas Financial Model, engineered specifically to streamline refinery valuations, petrochem forecasting, and supply chain margins.
- LNG Terminal Model: Looking to secure funding or evaluate the returns of a multi-billion dollar energy project? Download this comprehensive, investor-ready LNG Terminal Financial Model to instantly project capital expenditures, liquefaction and regasification revenues, charter rates, and debt-scoping metrics with institutional-grade accuracy.
Oil & Gas Cost Models: Read about all major metrics: Cost per Barrel (or boe/d) benchmark. Lease Operating Expenses (LOE), Well Detail & Maintenance, Field Netback, and how they affect finances.
- Petrochemical Engineering Company: Maximize your valuation and secure investor funding with this production-ready Petrochemical Engineering Company financial model. It delivers dynamic forecasting for refining capacities, complex chemical yield margins, and multi-year capital expenditure (CapEx) schedules. Click here to download the fully customizable Excel template and confidently project your plant’s internal rate of return (IRR) today.
20 Tab Model Highlight Breakdown
Cover Control
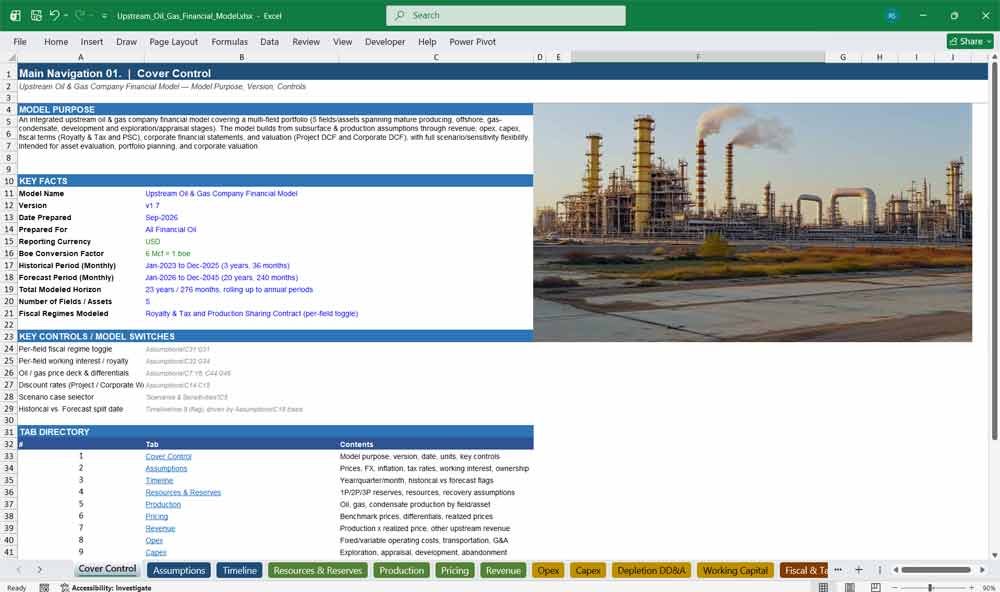
The Cover Control tab is the command center of the oil and gas financial model, giving every user — from a first-time analyst to a reviewing partner — instant context on what the model does, how it’s built, and where to find what they need. As the front door to a multi-tab upstream valuation model, it anchors version control, reporting units, and navigation in one place, so the model stays auditable as it’s updated, shared, and reused across deal teams and reporting cycles.
- Clear statement of model purpose, scope, and intended use (asset evaluation, portfolio planning, corporate valuation)
- Version control, preparation date, and reporting currency/units documented at a glance
- One-click hyperlinked directory to all 20 tabs for fast navigation
- Summary of key model controls and switches (fiscal regime, discount rates, scenario case) with direct cell references
- Sets the professional, audit-ready tone expected of an institutional-grade E&P financial model
Assumptions
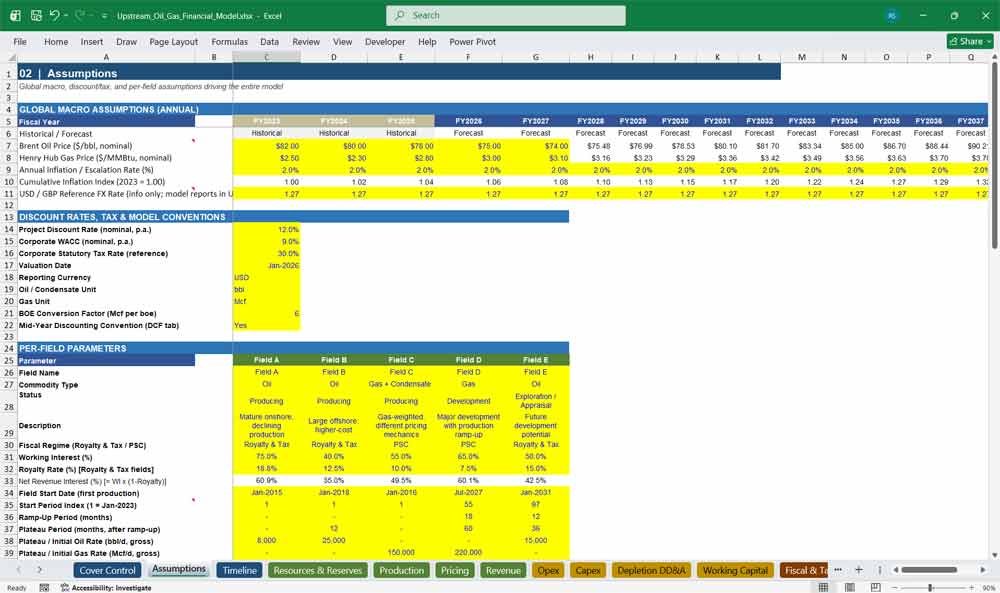
The Assumptions tab is the single source of truth behind this oil and gas financial model, centralizing every price deck, cost input, ownership interest, and fiscal parameter that drives the workbook. Instead of scattering hardcoded numbers across dozens of sheets, every hypothesis about prices, inflation, working interest, and tax lives in one transparent, color-coded location — the hallmark of a well-controlled financial modeling best practice and exactly what due diligence teams look for in an oil and gas Excel model.
- Global macro assumptions: Brent and Henry Hub price decks, inflation/escalation rates, and FX reference rates
- Discount rates, statutory tax rate, valuation date, and unit conventions (bbl, Mcf, boe) in one control panel
- Full per-field assumption set: working interest, royalty/NRI, decline rates, plateau and ramp-up periods, price differentials
- Per-field fiscal regime toggle (Royalty & Tax vs. PSC) plus PSC cost-recovery and profit-split terms
- Annual capex plan by field and category (exploration, appraisal, development, abandonment)
- Colour-coded inputs (blue) vs. formulas (black) vs. cross-sheet links (green) for instant auditability
Upstream Oil and Gas Timeline
Every robust oil and gas forecasting model needs a single, unambiguous time axis, and the Timeline tab is exactly that — a monthly calendar spanning three years of history and twenty years of forecast that every other tab references. By centralizing the historical-versus-forecast logic, period indexing, and calendar mechanics in one sheet, this tab keeps a 276-month upstream production and cash flow model internally consistent and easy to extend.
- 36 months of historical periods (2023–2025) plus 240 months of forecast (2026–2045) on one continuous axis
- Automated calendar logic: year, month number, quarter, and days-in-month calculated from a single anchor date
- Explicit Historical vs. Forecast flag driving formatting and formula logic throughout the model
- Sequential period index used by every decline-curve, ramp-up, and cash flow formula in the workbook
- Fully formula-driven — extend the forecast horizon by editing the axis once, not tab by tab
4. Resources & Reserves
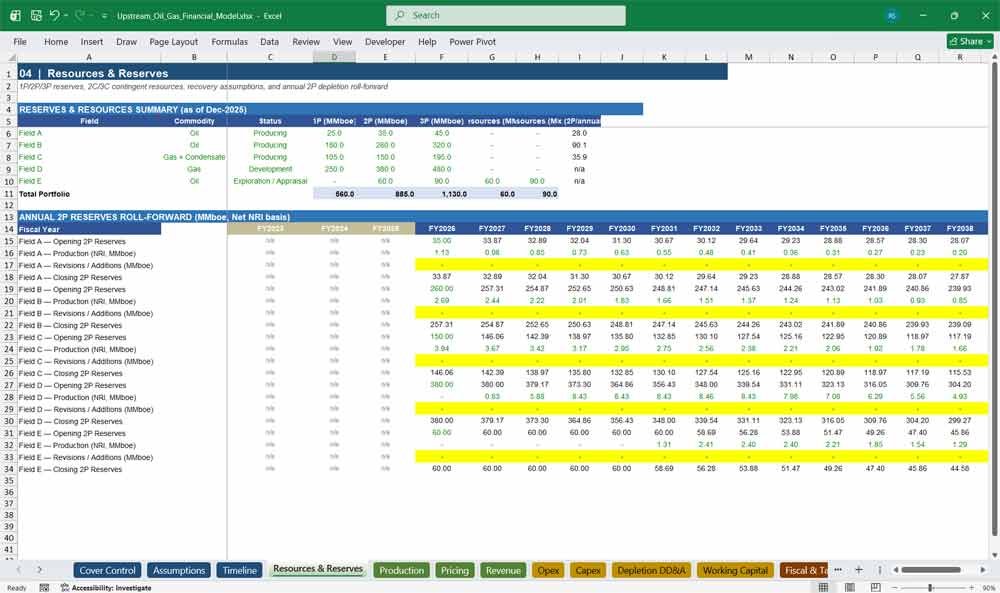
Reserves and resources are the foundation of any credible upstream oil and gas valuation, and this tab gives every asset a transparent, auditable reserves base. Presenting 1P, 2P, and 3P reserves alongside 2C/3C contingent resources for pre-development assets, the Resources & Reserves tab ties directly into the production forecast so that reserve depletion, reserve life index, and annual roll-forwards are never disconnected from what the model actually produces.
- Full 1P/2P/3P reserves and 2C/3C contingent resources summary by field and portfolio total
- Reserve life index calculated automatically from annualized production run-rates
- Annual 2P reserves roll-forward: opening balance, production, revisions/additions, closing balance
- Direct linkage to the Production tab so reserves depletion reflects actual forecast volumes
- Supports both producing assets and pre-FID exploration/appraisal projects within the same framework
5. Production
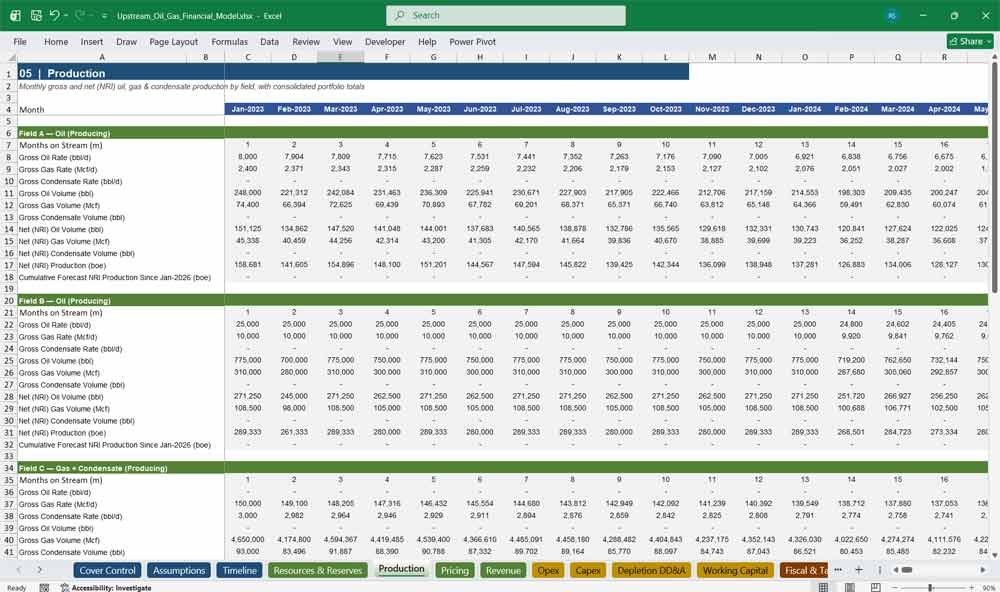
The Production tab is where subsurface assumptions become a real oil, gas, and condensate production forecast — the engine room of any serious E&P financial model. Built on flexible decline-curve mathematics that handle ramp-up, plateau, and decline phases for every asset type, it converts gross field volumes into the net, working-interest and net-revenue-interest volumes that flow straight into revenue, fiscal, and reserves calculations.
- Field-by-field monthly production build: gross oil, gas, and condensate rates and volumes
- Configurable ramp-up, plateau, and decline-curve logic supporting mature, developing, and pre-production assets
- Automatic conversion between gross, working-interest, and net-revenue-interest volumes
- Boe-equivalent production and cumulative forecast production tracked for reserves and depletion calculations
- Portfolio-level consolidation across all fields and asset types for at-a-glance production trends
7. Upstream Oil and Gas Revenue
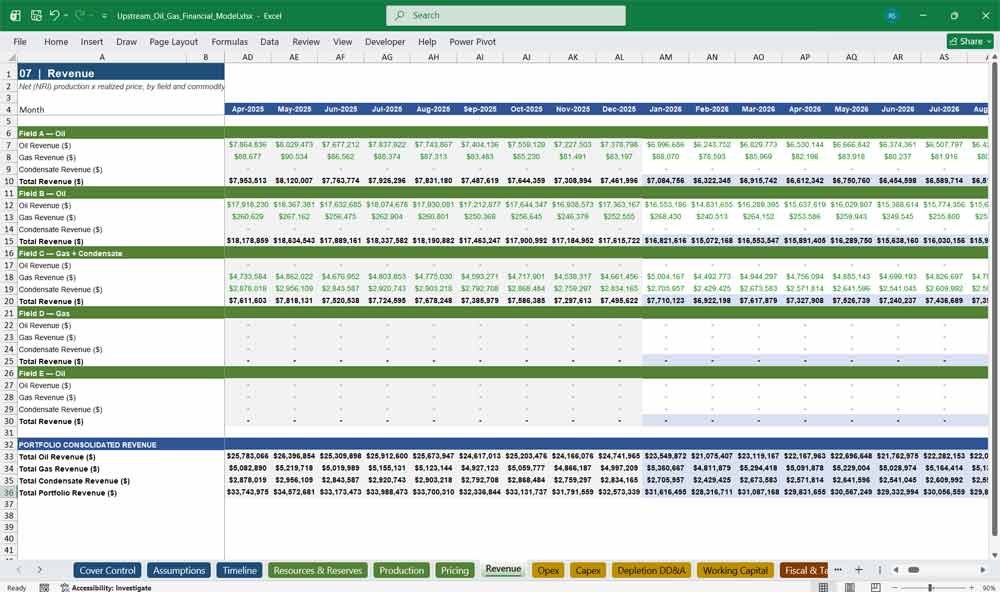
Revenue is where production and price meet cash, and this tab delivers a clean, fully auditable oil and gas revenue model by commodity and by field. Every dollar of oil, gas, and condensate revenue is traceable back to a specific volume and price assumption, giving finance teams and investors the transparency they need to trust the top line of the valuation.
- Revenue calculated as net (NRI) production multiplied by realized price, by commodity and by field
- Separate oil, gas, and condensate revenue lines with field-level and portfolio-level totals
- Fully linked to the Production and Pricing tabs — no hardcoded revenue figures anywhere
- Monthly granularity rolling up cleanly into annual revenue for financial statement reporting
- Portfolio consolidation makes it easy to see which assets are driving top-line growth or decline
9. Capex
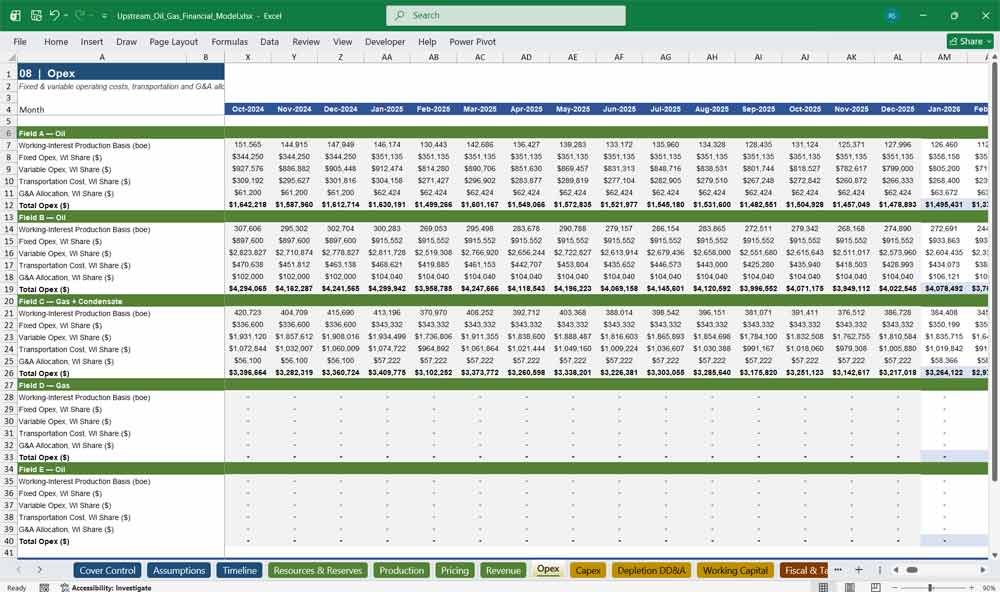
Capital discipline drives returns in the oil and gas business, and the Capex tab models exploration, appraisal, development, and abandonment spend with the granularity investors expect from a professional oil and gas capex model. An annual capex plan by category is automatically spread into the monthly operating model, keeping the capital program fully aligned with the production and reserves build it’s funding.
- Exploration, appraisal, development, and abandonment capex tracked separately by field
- Annual capex plans automatically phased into the monthly cash flow model
- Supports simultaneous, overlapping capital programs across a multi-asset portfolio
- Abandonment/decommissioning costs explicitly scheduled at end-of-field-life
- Portfolio-level capex consolidation for capital allocation and funding analysis
10. Depletion DD&A
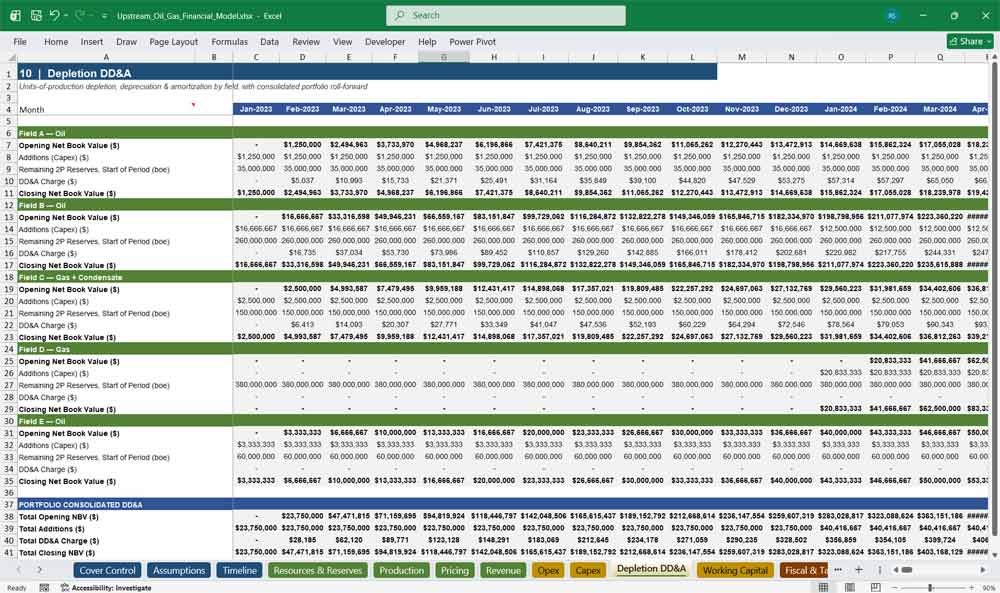
Depreciation, depletion, and amortization is often the most misunderstood line in an upstream financial statement model, and this tab applies a rigorous units-of-production methodology tied directly to reserves. By linking the DD&A charge to each field’s remaining 2P reserves and current-period production, the model produces a depletion profile that actually reflects how the asset is being consumed — not a generic straight-line estimate.
- Units-of-production DD&A calculated from opening net book value, capex additions, and remaining 2P reserves
- Field-by-field net book value roll-forward: opening balance, additions, depletion charge, closing balance
- Fully dynamic — DD&A responds automatically to changes in production, reserves, or capex assumptions
- Feeds directly into taxable income calculations and the corporate income statement
- Portfolio consolidation supports fixed-asset reporting for the balance sheet
11. Working Capital
Working capital is easy to overlook and expensive to get wrong, and this tab brings receivables, payables, and inventory into the cash flow picture using standard, defensible day-count assumptions. For an oil and gas cash flow model that’s meant to tie out to a real balance sheet, tracking the change in net working capital — not just the balance — is what makes the cash flow statement trustworthy.
- Accounts receivable, accounts payable, and inventory modeled on configurable days-outstanding assumptions
- Net working capital calculated and rolled forward monthly across the full forecast horizon
- Change in net working capital isolated as its own line for direct use in the cash flow statement
- Portfolio-level (consolidated) working capital view appropriate for corporate reporting
- Fully formula-driven, so working capital assumptions can be stress-tested in seconds
Reporting For Oil And Gas
14. Corporate Financials
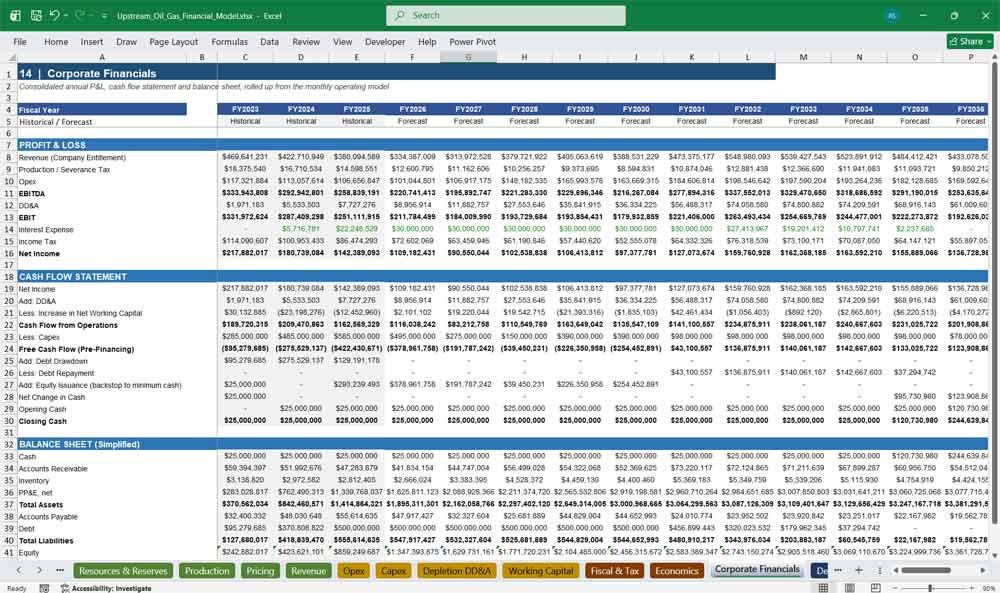
For teams that need more than an asset-level view, the Corporate Financials tab consolidates every field into a full corporate P&L, cash flow statement, and balance sheet — the centerpiece of any company-level oil and gas financial model. Built on an annual cadence with automated balance checks, this tab is what turns a production and reserves model into a genuine corporate financial statement package suitable for lenders, boards, and investors.
- Consolidated annual income statement: revenue, production tax, opex, EBITDA, DD&A, EBIT, interest, tax, net income
- Full indirect cash flow statement including working capital movements, capex, and financing activity
- Simplified balance sheet: cash, receivables, inventory, net PP&E, payables, debt, and equity roll-forward
- Automated balance check confirms assets equal liabilities plus equity every year, out of the box
- Equity issuance backstop logic ensures the model never shows an unrealistic negative cash balance
15. Debt Financing
Financing strategy matters as much as the underlying assets, and the Debt Financing tab models a realistic revolving credit facility with drawdowns, repayments, and a disciplined cash-sweep mechanism. Designed to avoid the circular-reference headaches that plague many oil and gas debt models, interest is calculated cleanly on the opening balance, keeping the model stable, transparent, and easy to audit.
- Revolving facility with automatic cash-sweep drawdowns and repayments based on free cash flow
- Interest expense calculated on the opening balance — no circular references, no iterative calculation required
- Facility cap and undrawn headroom tracked every year so financing capacity is always visible
- Fully integrated with Corporate Financials so financing flows straight into net income and the balance sheet
- Supports sensitivity testing of leverage capacity against different production and price scenarios
16. Valuation
The Valuation tab distills the entire model into the numbers a boardroom actually wants to see: net asset value, equity value, value per share, and trading multiples. By summing risked, field-level project NPVs into a portfolio NAV and bridging to equity value after net debt and corporate overhead, this tab delivers the kind of clean oil and gas NAV valuation summary used in equity research, M&A, and reserve-based lending discussions.
- Net asset value (NAV) build-up as the sum of risked, per-field project NPVs
- Full bridge from Core NAV to Equity Value, adjusting for net debt and unallocated corporate G&A
- Automatic value-per-share calculation based on shares outstanding
- Key valuation multiples: EV/2P reserves ($/boe) and EV/EBITDA
- One-click link through to the full DCF waterfall and sensitivity analysis for deeper diligence
17. Scenarios & Sensitivities
No oil and gas financial model is complete without the ability to stress-test its own assumptions, and the Scenarios & Sensitivities tab makes that possible with a single input cell. Selecting Low, Base, or High instantly re-prices oil and gas, rescales production, capex, opex, and even the effective fiscal take across every tab in the workbook — turning a static model into a live decision-support tool for oil and gas scenario analysis.
- Live Low/Base/High case selector that re-flows the entire model from one input cell
- Configurable multipliers for oil price, gas price, production, capex, opex, FX, and fiscal/tax take
- Transparent case-definition table so every scenario assumption is visible and editable
- Live read-out of key valuation outputs (NAV, equity value, value per share) under the selected case
- Purpose-built for board presentations, lender stress tests, and investment committee “what-if” discussions
Value Your Oil & Gas Company With A DCF
18. Discounted Cash Value (DCF)
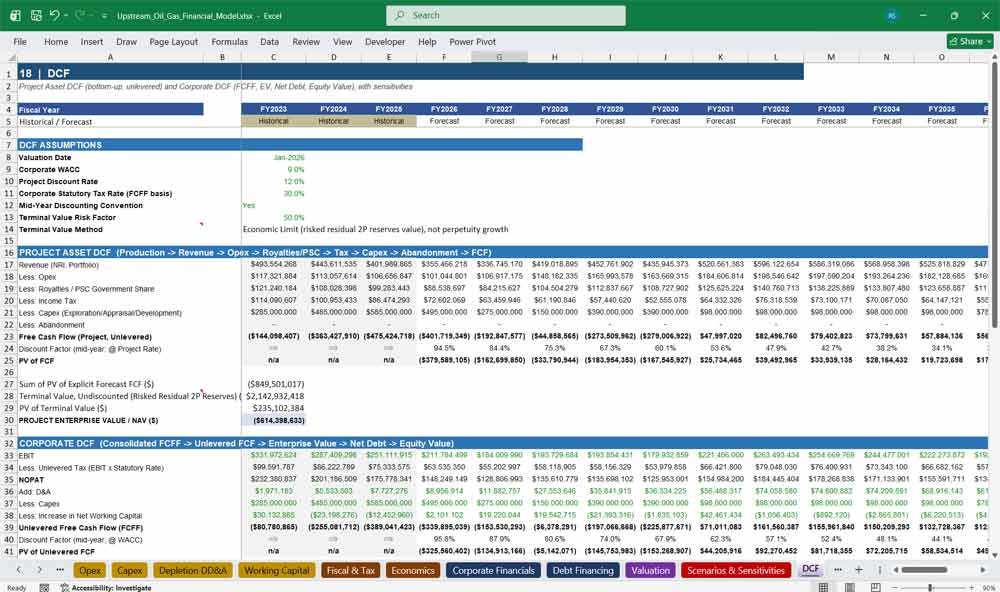
The DCF tab is the analytical heart of the model, and it deliberately keeps two distinct valuation lenses side by side: a bottom-up Project (Asset) DCF — production through revenue, opex, royalties/PSC, tax, capex, and abandonment to free cash flow — and a top-down Corporate DCF built on the classic FCFF framework of EBIT, tax, D&A, capex, and working capital. With mid-year discounting, a reserves-based “economic limit” terminal value instead of an unrealistic perpetuity growth assumption, and built-in WACC and oil-price sensitivity grids, this tab delivers the rigor expected of an institutional oil and gas DCF valuation model.
- Separate, clearly labeled Project Asset DCF and Corporate DCF waterfalls in one tab
- Project DCF: Production → Revenue → Opex → Royalties/PSC → Tax → Capex → Abandonment → FCF → NPV/IRR
- Corporate DCF: FCFF (EBIT, tax, D&A, capex, change in NWC) → Unlevered FCF → Enterprise Value
- Mid-year discounting convention applied consistently to every discount factor and present value
- Economic-limit terminal value based on risked residual 2P reserves — not a generic perpetuity-growth assumption
- Full bridge from Enterprise Value to Net Debt to Equity Value to per-share/stake value
- Two live sensitivity grids: WACC × oil price and WACC × terminal value risk factor
19. Checks
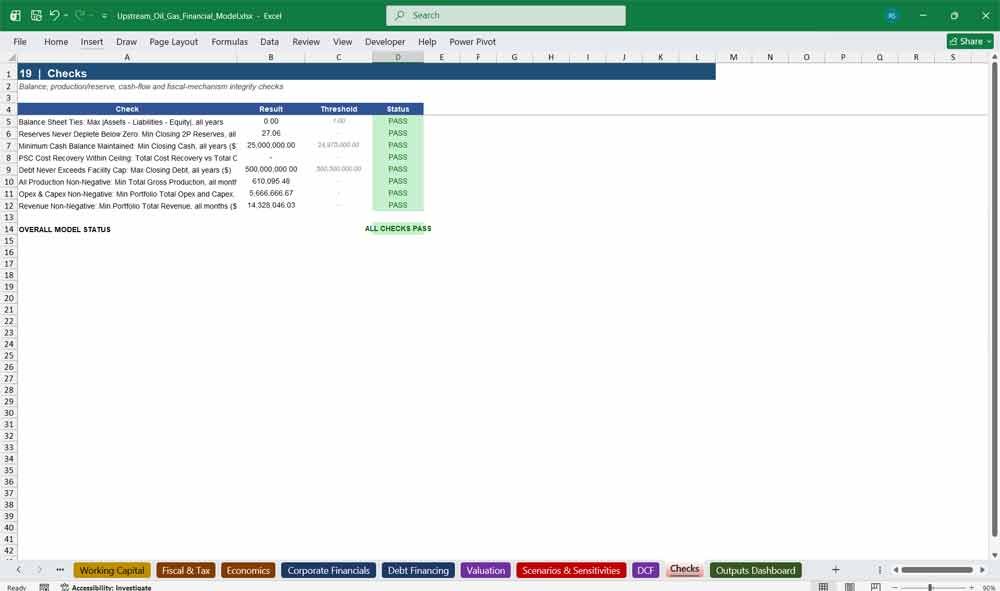
Trust in a financial model comes from what it verifies, not just what it calculates, and the Checks tab runs a full suite of automated integrity tests across the entire workbook. From balance sheet ties to reserves depletion limits to PSC cost-recovery ceilings, this tab is what turns a complex, multi-tab oil and gas Excel model into one a reviewer, lender, or auditor can actually sign off on.
- Balance sheet integrity check confirming assets equal liabilities plus equity in every forecast year
- Reserves check ensuring cumulative production never depletes 2P reserves below zero
- Minimum cash balance and debt facility cap checks validated across the full 23-year horizon
- PSC cost-recovery-within-ceiling check validating the fiscal mechanics are working as designed
- Non-negativity checks on production, revenue, opex, and capex, with automated color-coded PASS/FAIL status
- Single “Overall Model Status” indicator for an instant model health check
20. Outputs Dashboard
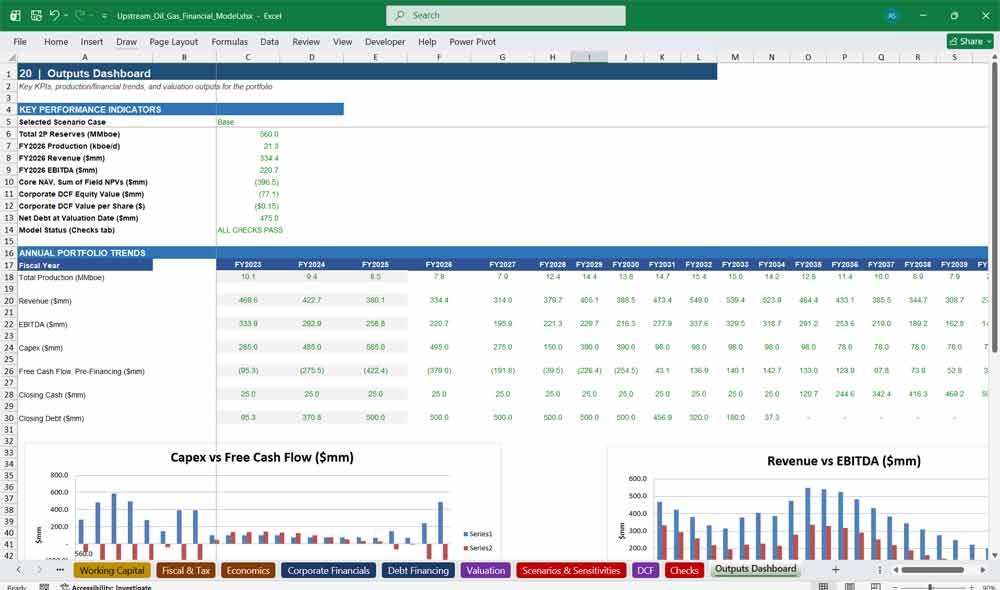
The Outputs Dashboard is the executive summary of the entire upstream oil and gas financial model — the tab a CFO, investor, or board member actually opens first. Combining headline KPIs with visual trend charts for production, revenue, EBITDA, capex, cash, and debt, this dashboard turns 86,000-plus underlying formulas into a handful of numbers and charts that tell the portfolio’s story at a glance.
- Headline KPI panel: 2P reserves, production rate, revenue, EBITDA, NAV, equity value, and value per share
- Live scenario case and overall model health status displayed prominently
- Annual trend table covering production, revenue, EBITDA, capex, free cash flow, cash, and debt
- Native Excel charts: production trend, revenue vs. EBITDA, capex vs. free cash flow, cash vs. debt
- Designed as a standalone investor-ready summary that still links back to every supporting tab
Final Notes on the Financial Model
- Scenario Analysis: Create best-case, base-case, and worst-case projections.
- Break-even Analysis: Determine sales volume required to cover fixed & variable costs.
- Sensitivity Analysis: Assess how changes in raw material costs, pricing, or demand impact profitability.
This structured 36 months of historical (2023–2025) plus 240 months of forecasting helps any Upstream Oil and Gas Company address a broad market spectrum, offering the right balance between cost, production capacity, support, and customization at each level.
Download Link On Next Page