
Midstream Oil Financial Model Template (Excel)
This midstream oil and gas financial model template is a fully-integrated, investment-banking-grade Excel template built for analysts, private equity associates, lenders, and energy investors who need a bankable way to underwrite pipeline, gathering & processing, storage, and terminal assets. Structured around the same flow institutional deal teams use — capacity through throughput, utilization, tariff, revenue, opex, EBITDA, capex, depreciation, EBIT, tax, unlevered free cash flow, debt, and equity returns — this financial model turns a static spreadsheet into a dynamic decision tool. Every driver lives in one Assumptions tab, every formula chains forward automatically, and a single Model Start Date input re-dates the entire 18-year timeline (3 years of historical monthly data plus a 15-year operating forecast) with zero manual rework.
15-year Financial Model for a Midstream Oil & Gas Facility
Built for real-world midstream economics, the model captures the segments that actually drive revenue in this sector: crude, refined products, natural gas, and NGL transportation tariffs; gathering, processing, treating, and compression fees; tank, cavern, and seasonal storage revenue; import/export terminal and dockage fees; and ancillary blending, logistics, and marketing income. Contracted versus uncontracted (spot) volumes, minimum-volume-commitment (MVC) deficiency payments, commodity price sensitivity on processing margins, and customer/contract-level revenue allocation are all modeled explicitly — not approximated — so the output holds up to lender and investment-committee scrutiny.
Beyond the operating build, this Excel financial model delivers everything a full underwriting package needs in one workbook: a three-statement model (P&L, balance sheet, cash flow) that ties out automatically, a revolving-credit and term-debt schedule with covenant and liquidity testing, a tax module with depreciation, interest cap, and NOL tracking, a DCF valuation with mid-year convention and dual terminal-value methods, a levered/unlevered returns analysis with IRR and MOIC, live sensitivity grids, and a one-page executive dashboard with charts. Whether you’re pressure-testing an acquisition, preparing a financing package, or teaching yourself midstream modeling mechanics, this template is ready to plug in your numbers and go live.
Tab-by-Tab Guide
Each summary is ~40 words, written for search and for a buyer scanning the product page. Highlight bullets follow each one.
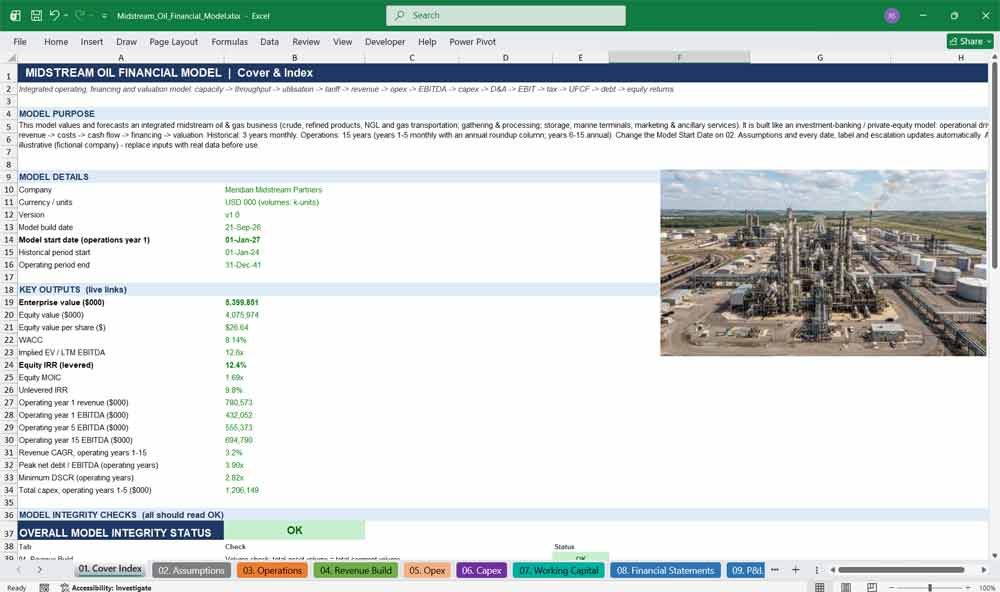
01. Cover Index
A professional cover page anchoring the entire midstream financial model — company details, key output metrics, an integrity-check status panel, covenant test summary, full clickable tab index, and a color-coding legend so any reviewer can navigate the workbook in seconds.
- One-click navigation to all 17 tabs via a linked index
- Live pass/fail integrity-check and covenant-status banners
- Key valuation and returns metrics surfaced at a glance
- Color-code legend (inputs, formulas, links) for fast onboarding
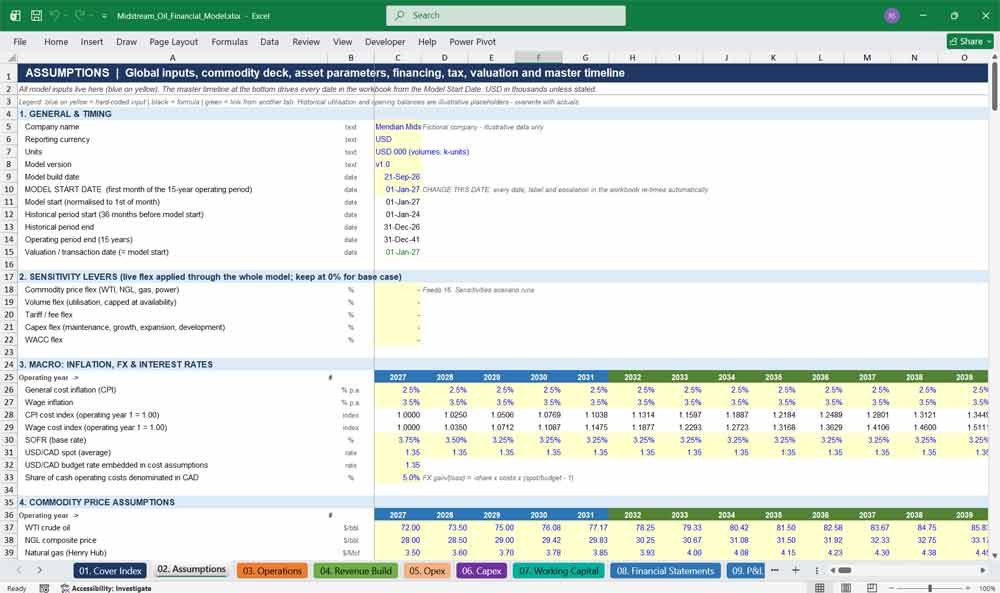
02. Assumptions
The single driver tab powering this Excel oil and gas model — macro, commodity price, asset-level tariff and capacity, opex, capex, working capital, financing, tax, and valuation inputs, all feeding a master timeline that re-dates every tab from one Model Start Date cell.
- One input drives the full 18-year model timeline
- Commodity price deck (WTI, NGL, natural gas, power)
- Asset-by-asset capacity, tariff, and escalation assumptions
- Built-in sensitivity flex levers for scenario testing
Midstream Oil & Gas Revenues
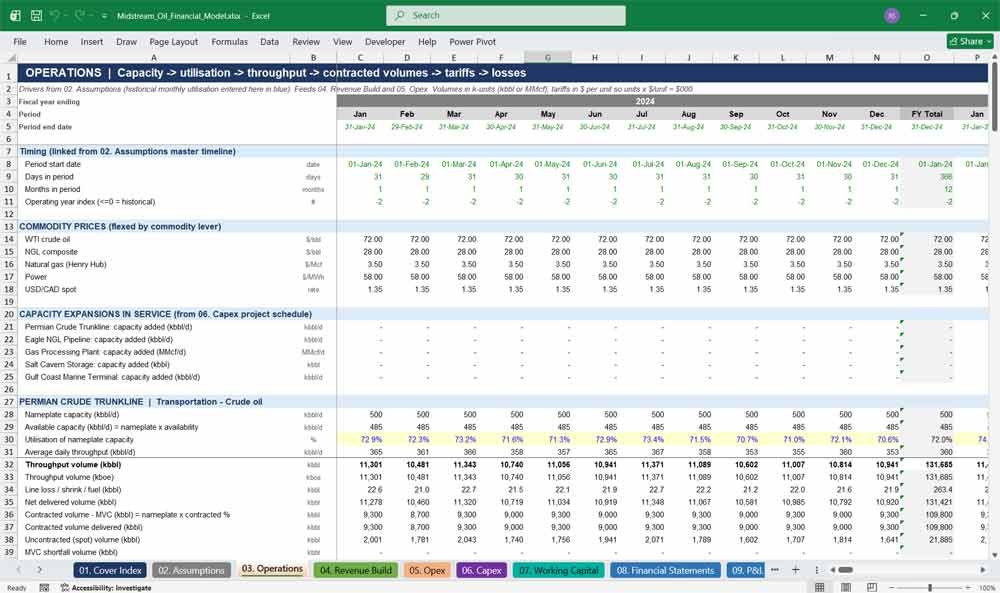
03. Operations
The operating engine translating capacity into throughput — monthly and annual utilization by asset, contracted-versus-spot volume splits, and historical actuals feeding forward into the Revenue Build, so every downstream number traces back to a physical operating assumption.
- Monthly detail for years 1–5, annual thereafter through year 15
- Historical utilization carried for full three-statement continuity
- Contracted vs. uncontracted volume tracking by asset
- Feeds tariff and revenue calculations directly, with no manual links
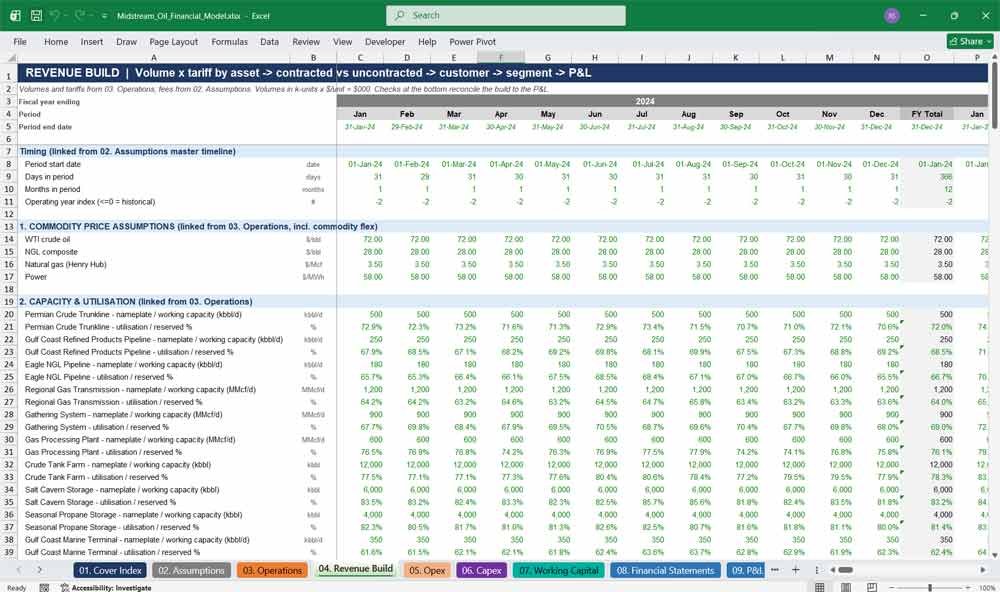
04. Revenue Build
A granular, segment-level revenue build covering transportation, gathering & processing, storage, terminals, and ancillary income — with commodity-linked processing economics, contracted/spot tariff logic, and nine built-in reconciliation checks tying every dollar back to the P&L.
- Revenue modeled by asset, customer/contract, and segment
- Processing build: inlet gas, NGL yield, POP fee economics
- Storage and terminal throughput, injection/withdrawal, and dockage fees
- Nine bottom-of-tab checks with a prominent OK/ERROR flag
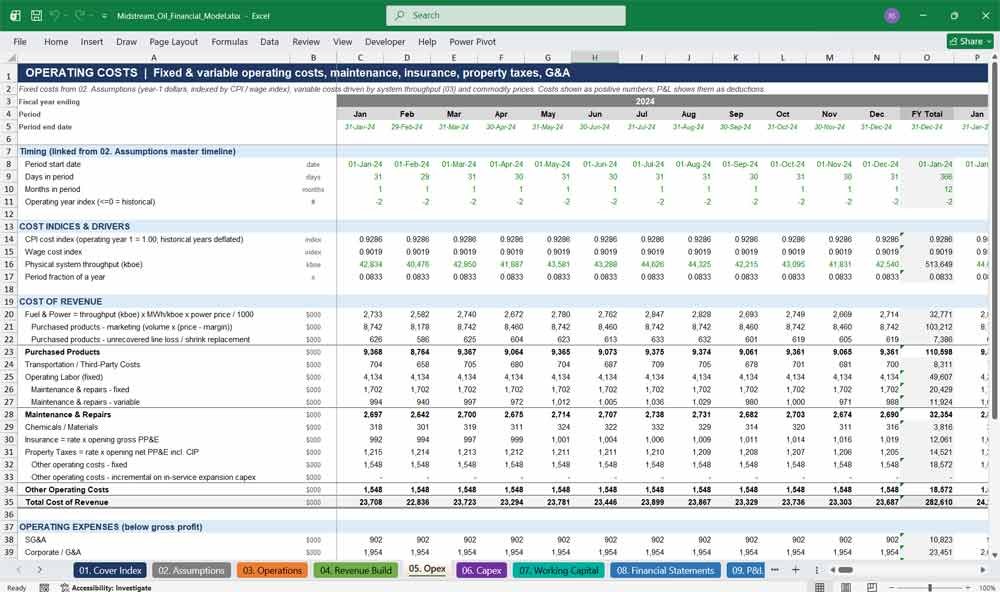
05. Opex
A fully formula-driven operating expense schedule spanning fixed and variable costs, escalated by CPI and wage indices from Assumptions, giving lenders and investors a transparent, auditable view of the cost structure behind midstream EBITDA margins.
- Opex escalated automatically via linked inflation indices
- Fixed vs. variable cost segmentation by asset
- Fully consistent formulas across every historical and forecast period
- Direct feed into the EBITDA build on the P&L
06. Capex
A capital expenditure schedule covering maintenance, growth, and development capex with project-level in-service dates and capacity additions — the same modeling logic PE and infrastructure investors use to underwrite midstream expansion and greenfield development projects.
- Maintenance capex scaled to asset base
- Named expansion and development projects with in-service timing
- Feeds the fixed-asset roll-forward and depreciation schedule
- Fully flexible via the capex sensitivity lever on Assumptions
Midstream Oil and Gas Financial Statements
07. Working Capital
A working capital schedule driving receivables, payables, and other operating balances off days-based assumptions, integrated directly into the cash flow statement so unlevered and levered free cash flow reflect real timing, not just accrual profit.
- Days-based receivables, payables, and accrual modeling
- Opening balances seeded from historical actuals
- Feeds the indirect cash flow statement automatically
- Consistent formula logic across the full 18-year timeline
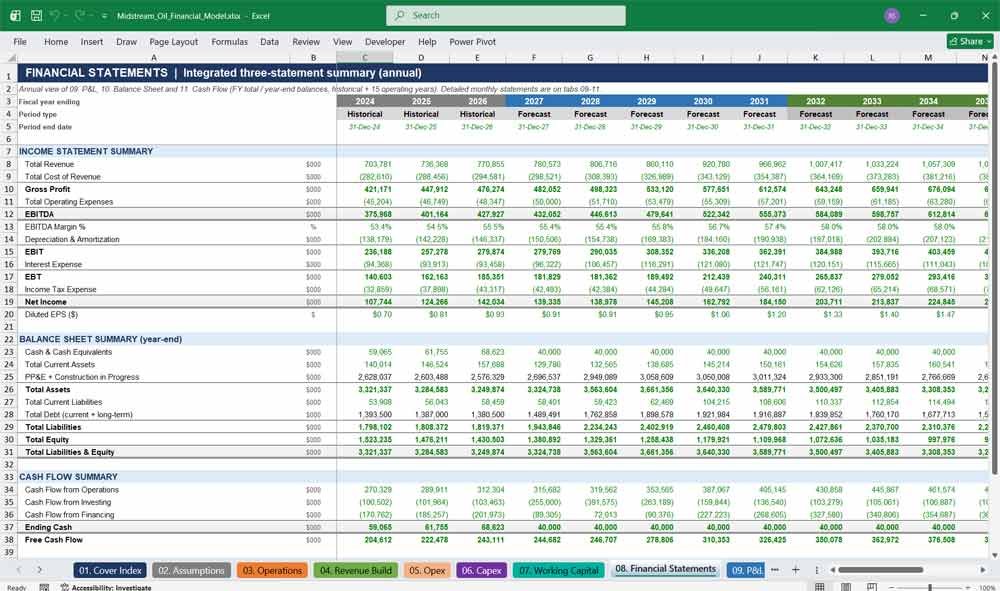
08. Financial Statements
An annual summary tab consolidating the P&L, balance sheet, and cash flow into one at-a-glance view across all three historical years and fifteen operating years — the fastest way to review the full financial picture without tab-hopping.
- One-page annual roll-up of tabs 09, 10, and 11
- Historical-to-forecast continuity in a single view
- Ideal for lender presentations and IC memos
- Pulls live from the underlying statements, never hardcoded
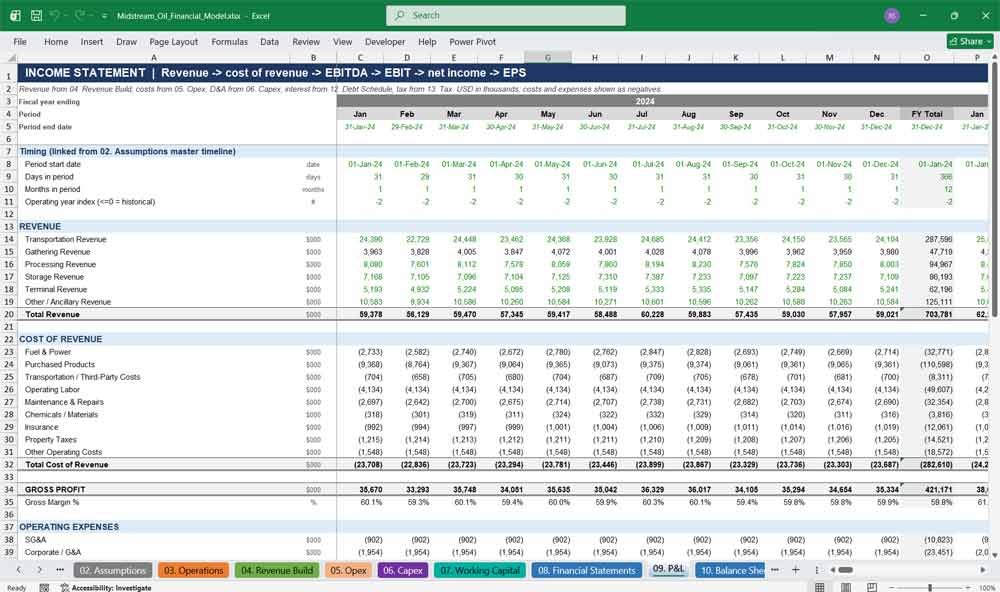
09. Income Statement (P&L)
A complete income statement from revenue through net income, including a dedicated free cash flow section with margin, conversion, and yield metrics — giving investors the profitability and cash-generation lens they need to underwrite a midstream asset or platform.
- Revenue through EBITDA, EBIT, tax, and net income
- FCF section with margin, conversion, and yield analysis
- Monthly detail for years 1–5, annual for years 6–15
- Fully linked to Revenue Build, Opex, D&A, and Tax tabs
10. Balance Sheet
A fully-integrated balance sheet that ties out to the penny every period, with retained earnings flowing from net income and distributions, and debt balances linked live to the Debt Schedule — the tie-out test every lender checks first.
- Assets = Liabilities + Equity in every period, automatically
- Retained earnings roll-forward from net income and distributions
- Debt balances linked live from the Debt Schedule tab
- Built-in balance check flags any discrepancy instantly
11. Cash Flow
An indirect-method cash flow statement bridging net income to the change in cash, capturing working capital movements, capex, financing activity, and distributions — the backbone that keeps the three-statement model fully dynamic and error-free.
- Indirect method from net income to ending cash
- Working capital, capex, and financing fully integrated
- Feeds the revolver sizing and minimum cash test
- Reconciles automatically to the balance sheet cash balance
12. Debt Schedule
A credit-ready debt schedule with revolver and term-tranche mechanics, average-balance interest to avoid circularity, mandatory and cash-sweep amortization, and built-in covenant and liquidity tests — exactly the structure lenders expect in a financeable midstream credit model.
- Revolver auto-sizes off a minimum cash target
- Interest on average balances avoids circular formulas
- Leverage, coverage, and DSCR covenant tests included
- Separate OK/BREACH status keeps covenant flags distinct from errors
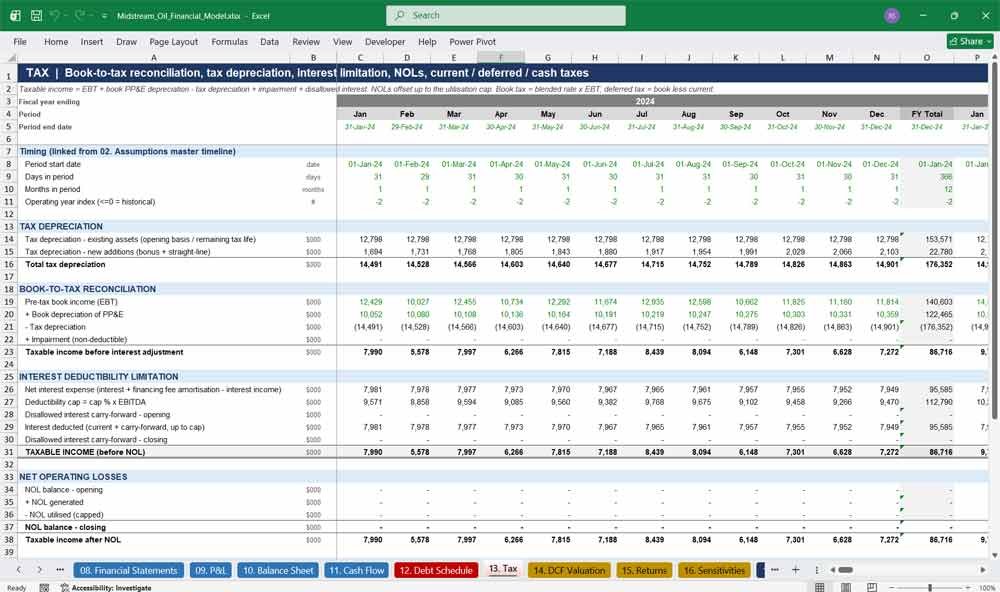
13. Tax
A full tax provision build with tax depreciation and bonus depreciation, an interest expense cap, net operating loss (NOL) carryforward tracking, and a deferred tax roll-forward — the detail a real acquisition model needs beyond a flat tax-rate assumption.
- Tax vs. book depreciation with bonus depreciation modeled
- Interest expense cap and NOL carryforward tracking
- Deferred tax computed as book-minus-current tax
- Taxes payable scheduled on a realistic payment lag
Key Midstream Ratios & Metrics
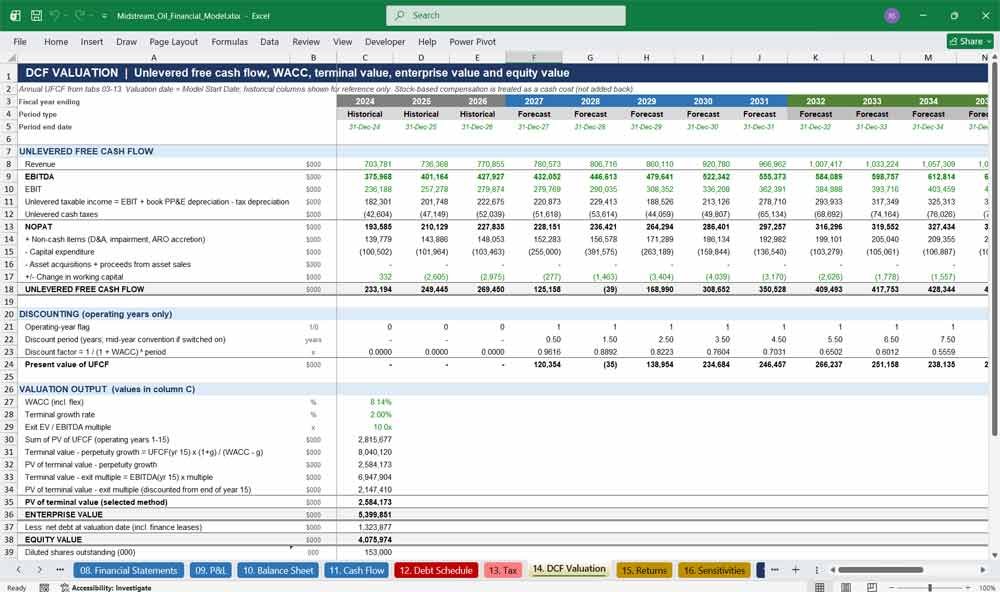
14. DCF Valuation
A discounted cash flow valuation with a mid-year convention toggle and both perpetuity-growth and exit-multiple terminal value methods, giving buyers, lenders, and appraisers a defensible enterprise and equity value range for the midstream asset base.
- Mid-year convention toggle for cash flow timing
- Dual terminal value methods: perpetuity growth and exit multiple
- WACC built up from the financing assumptions
- Bridges enterprise value to equity value per share
15. Returns
A returns analysis calculating levered and unlevered IRR and MOIC from a defined entry point through exit, the exact lens a private equity or infrastructure fund uses to underwrite a midstream acquisition or growth investment.
- Levered and unlevered IRR and MOIC calculated side by side
- Entry modeled at the last historical year-end
- Distribution and exit assumptions fully linked to Assumptions
- Transparent, auditable return build for IC presentations
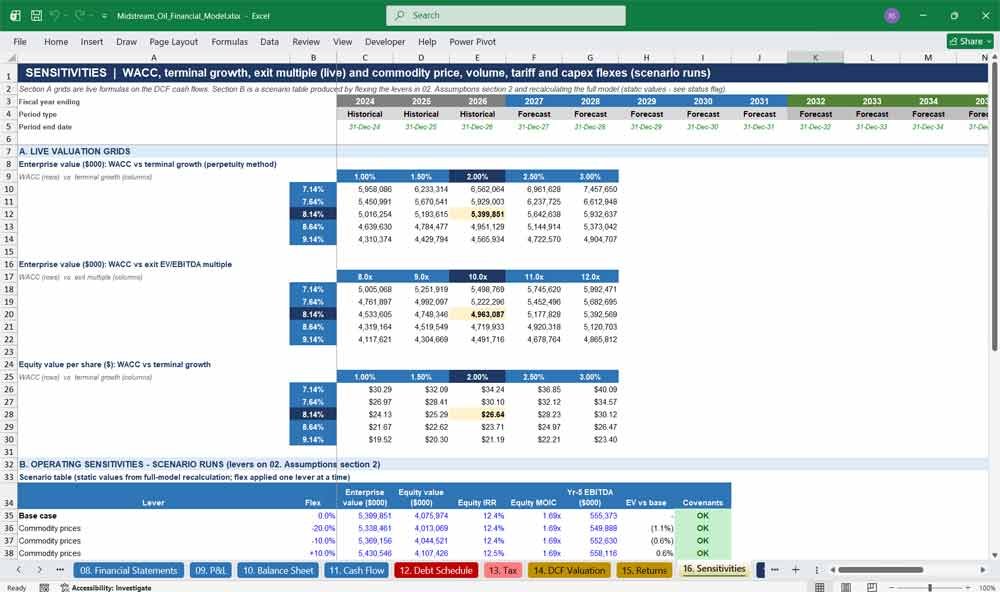
16. Sensitivities
Live two-way data grids for WACC versus growth, WACC versus exit multiple, and equity value per share, plus a flexible scenario table — the stress-testing toolkit investors and lenders use to understand valuation risk before committing capital.
- Live WACC x growth and WACC x exit multiple grids
- Equity value per share sensitivity table
- Flexible scenario lever bank on the Assumptions tab
- Rebuildable scenario table for custom what-if cases
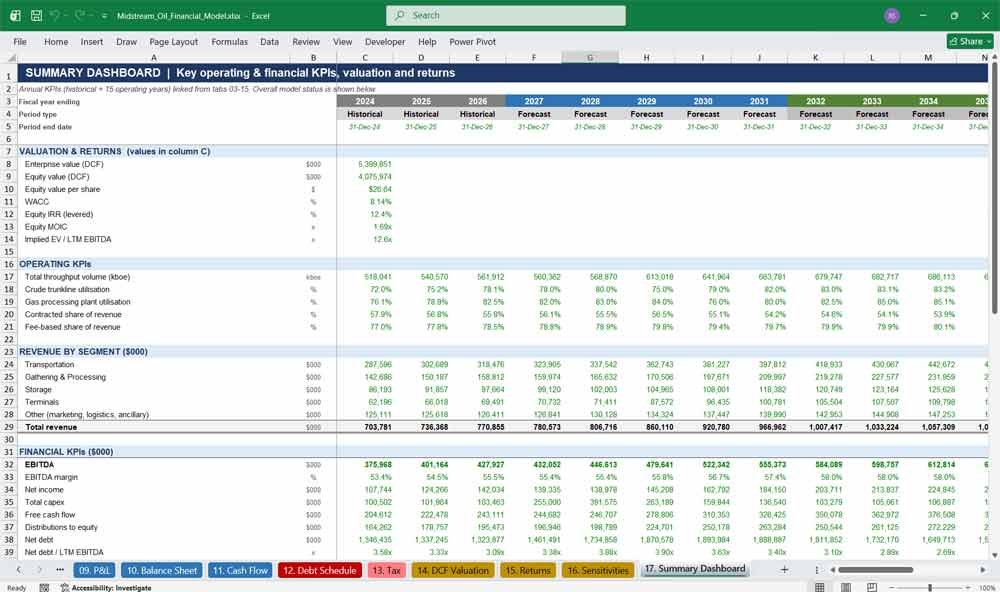
17. Summary Dashboard
A one-page executive dashboard pulling every key operating and financial KPI, valuation output, and return metric into a single chart-driven view — built for the five-minute skim a committee, lender, or buyer gives before reading the full model.
- Revenue-by-segment, EBITDA, and free cash flow charts
- Leverage and coverage ratio trends at a glance
- Live integrity-check and covenant-status indicators
- Enterprise value, equity value, IRR, and MOIC in one view
Why Buy This Model
Building a midstream oil and gas financial model from scratch takes an experienced analyst days of work just to get the structure right — before a single real assumption goes in. This template compresses that work into a ready-to-use, fully-formula-driven workbook that already reflects how transportation, gathering & processing, storage, and terminal assets actually generate revenue, how midstream credit facilities are structured, and how PE and infrastructure investors underwrite returns. Every number is a live formula, not a hardcoded result, so you can drop in your own commodity deck, tariff schedule, or capital structure and watch the entire 18-year model, three-statement build, debt schedule, tax provision, DCF valuation, and returns analysis update instantly and consistently. It’s built to the standard a lender or investment committee expects — clean color-coding, tie-out checks on every table, covenant testing, and a single date-driven calendar — so you spend your time on the deal, not on debugging a spreadsheet.
Midstream Oil & Gas Frequently Asked Questions (Faq)
Is this model fully dynamic, or are the numbers hardcoded?
Every forecast cell is a live formula chained back to the Assumptions tab — nothing in the projection periods is hardcoded. Change an input once and it flows through revenue, opex, the three statements, debt, tax, valuation, and returns automatically. Historical periods use hardcoded actuals (or clearly labeled illustrative placeholders), exactly as a real historical dataset would.
Can I change the start date and have the whole model update?
Yes. There is a single Model Start Date input on the Assumptions tab. Changing it re-dates every month, year, and escalation calculation across all 17 tabs with no manual rework required.
What software do I need to open and use this file?
The model is a standard .xlsx file built for Microsoft Excel. It uses widely-supported Excel functions (SUMIFS, INDEX/MATCH, IFERROR, and similar) rather than newer array functions, so it also opens cleanly in most spreadsheet software, though full formula support is designed around Excel.
Is the data in the model real, or is it illustrative?
The company, assets, and figures in this template are fictional and illustrative, built to demonstrate realistic midstream economics and modeling mechanics. It is designed to be overwritten with your own company’s, target’s, or deal’s actual data — the structure and formula logic are what you’re buying.
What’s included in the debt and covenant modeling?
A revolving credit facility that auto-sizes to a minimum cash target, one or more term-loan tranches with scheduled amortization, interest calculated on average balances to avoid circularity, and covenant/liquidity tests (leverage, coverage, DSCR) with a dedicated pass/breach status separate from the model’s general error checks.
Does the model include a valuation and a returns analysis?
Yes. A DCF Valuation tab produces enterprise and equity value using both perpetuity-growth and exit-multiple terminal value methods with a mid-year convention toggle, and a Returns tab calculates levered and unlevered IRR and MOIC from entry to exit.
How do I know the model is error-free and the balance sheet actually balances?
The workbook includes built-in integrity checks across every major tab (revenue, statements, debt, tax) that roll up into an OK/ERROR status on the Cover and Dashboard tabs, plus a dedicated balance-sheet tie-out check and separate covenant OK/BREACH status, so you can verify the model’s health at a glance before you rely on it.
Can I run sensitivity or scenario analysis?
Yes. The Sensitivities tab has live two-way data grids for WACC vs. growth, WACC vs. exit multiple, and equity value per share, plus sensitivity flex levers on the Assumptions tab (commodity price, volume, tariff, capex, and WACC) for building your own custom scenarios.
Who is this model built for?
Private equity and infrastructure investment professionals underwriting midstream acquisitions, lenders and credit analysts structuring financing packages, corporate development teams evaluating pipeline or storage assets, and finance students or career-changers who want to study how a real investment-banking-grade midstream model is built.
Is support or documentation included?
Every input cell is color-coded and labeled, every tab has an on-sheet summary and explanatory notes, and non-obvious assumptions are documented directly next to the relevant formulas — the workbook is built to be self-explanatory without a separate manual.
Can I customize the assets, segments, or capital structure?
Yes. The asset list, capacity, tariffs, segments, capital structure, and every other driver live on the Assumptions tab and are designed to be edited. Because the formulas reference these inputs rather than hardcoding values, the model is built to flex with your changes rather than break.
Further Reading
- Downstream Version: Maximize your returns and pitch with confidence using the industry’s most trusted Downstream Oil & Gas Financial Model, engineered specifically to streamline refinery valuations, petrochem forecasting, and supply chain margins.
- LNG Terminal Model: Looking to secure funding or evaluate the returns of a multi-billion dollar energy project? Download this comprehensive, investor-ready LNG Terminal Financial Model to instantly project capital expenditures, liquefaction and regasification revenues, charter rates, and debt-scoping metrics with institutional-grade accuracy.
Oil & Gas Cost Models: Read about all major metrics: Cost per Barrel (or boe/d) benchmark. Lease Operating Expenses (LOE), Well Detail & Maintenance, Field Netback, and how they affect finances.
- Petrochemical Engineering Company: Maximize your valuation and secure investor funding with this production-ready Petrochemical Engineering Company financial model. It delivers dynamic forecasting for refining capacities, complex chemical yield margins, and multi-year capital expenditure (CapEx) schedules. Click here to download the fully customizable Excel template and confidently project your plant’s internal rate of return (IRR) today.
Final Notes on the Financial Model
This 15-year Midstream Facility Financial Model incorporates revenue forecasting, operating expenses, investment activities, financing decisions, and profitability analysis. Oil and gas cost models help you maintain healthy financial ratios, manage cash flows efficiently, and optimise asset utilization. The terminal can maximize profitability and shareholder value.
Download Link On Next Page