
Downstream Oil & Gas Financial Model Template
This pure-play downstream financial model is a fully-linked, Excel-based valuation and forecasting template built for refining and marketing companies operating in the oil and gas downstream sector. Designed for analysts, investment bankers, private equity professionals, and corporate development teams, this refinery financial model integrates five years of historical monthly data with a ten-year operating plan, giving users a complete three-statement financial model spanning revenue, cost of goods sold, working capital, capital expenditure, taxation, and financing.
Every formula is dynamically linked, so changing a single assumption — crude price, crack spread, refinery utilisation, or FX rate — flows automatically through the entire downstream oil and gas Excel model, from the income statement down to the discounted cash flow valuation.
Financial Model for a Downstream Oil and Gas Company
Unlike generic financial modeling templates, this downstream business model reflects the operational realities of a refining and marketing enterprise: crude throughput, product yields across gasoline, diesel, jet fuel, LPG, and fuel oil, wholesale versus retail segment reporting, and a fully mechanical debt schedule with a revolving credit facility cash sweep. The eighteen-tab structure covers assumptions, market macro drivers, volumes, pricing, revenue, operating costs, working capital, capex and depreciation, tax, the income statement, balance sheet, cash flow statement, debt financing, valuation, sensitivity analysis, an executive dashboard, and a full integrity-check tab — making this one of the most complete refinery valuation model templates available for Excel-based financial modeling.
Whether you are building a refining company valuation for an M&A transaction, preparing an equity research model for a downstream oil and gas company, teaching corporate finance and financial modeling best practices, or simply need a rigorous three-statement model with DCF valuation, sensitivity tables, and IRR/MOIC returns analysis, this downstream financial model template delivers a professional, audit-ready foundation. Built with colour-coded inputs, a live scenario selector (Base, Upside, and Downside cases), and a built-in balance-sheet and cash-flow error-checking system, it is ready to customise with your own company data in minutes — no macros, no add-ins, just clean, transparent Excel formulas.
Why Buy This Model
Buying this pure-play downstream financial model saves you the dozens of hours it would otherwise take to build a fully-linked three-statement model, debt schedule, and DCF valuation from scratch — and it removes the risk of the formula errors and balance-sheet breaks that plague hand-built spreadsheets. Every one of the more than 28,000 formulas in this refinery and marketing financial model has been built to recalculate cleanly and tie out, with a dedicated Checks tab that verifies the balance sheet balances, cash flows reconcile, and every roll-forward schedule is internally consistent across all 130 historical and forecast periods. Instead of starting from a blank workbook, you start from a working, professional-grade downstream oil and gas financial model that you can immediately re-populate with your own refinery capacity, pricing, and financing assumptions — making it ideal for finance professionals, students, consultants, and business owners who need credible financial projections without the build time or technical risk.
Downstream Model Tab-by-Tab Breakdown
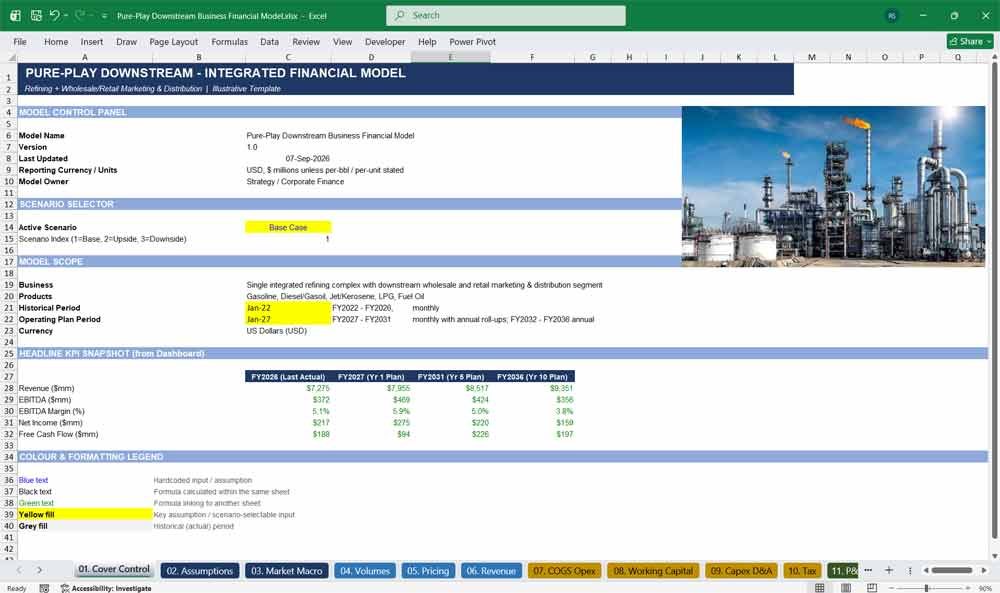
01. Cover Control
The Cover Control tab anchors this downstream financial model with version control, reporting units, and a live scenario selector that toggles Base, Upside, and Downside cases across the entire workbook. A KPI snapshot and colour-coded formatting legend help new users navigate this refinery valuation model with zero learning curve.
Highlights:
- One-click scenario switching (Base / Upside / Downside) drives every tab in the model
- Headline KPI snapshot pulls live figures from the Dashboard for FY2026, FY2027, FY2031, and FY2036
- Colour-coded legend explains every input, formula, and link convention used throughout the model
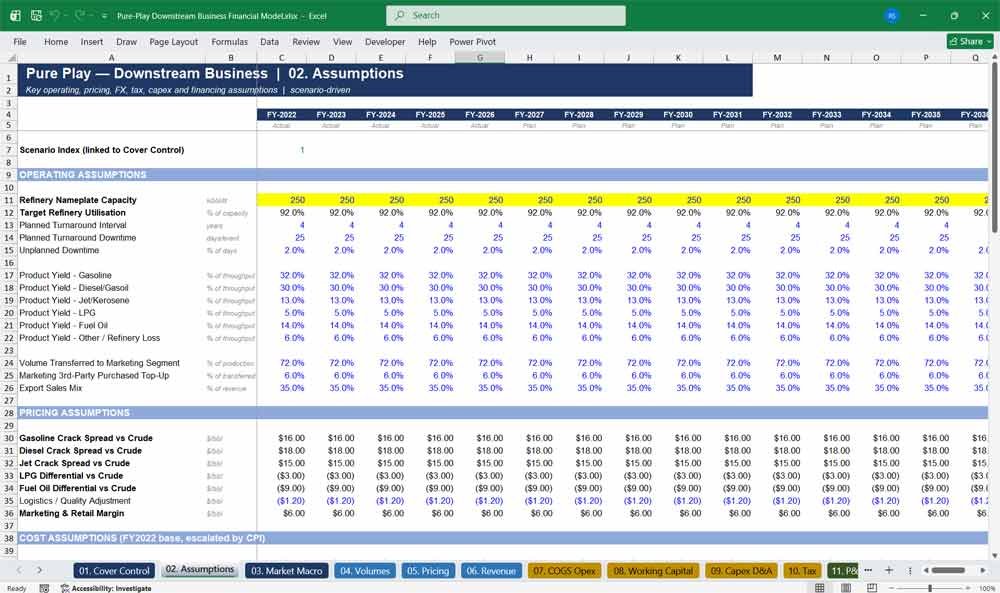
02. Assumptions
The Assumptions tab centralises every operating, pricing, FX, tax, capex, and financing driver behind this Excel financial model for refining companies. With scenario-specific input libraries for crack spreads, utilisation, and margins, users can stress-test a downstream oil and gas business plan without touching a single downstream formula elsewhere.
Highlights:
- Over 40 editable input cells covering operations, pricing, costs, capex, tax, and financing
- Base/Upside/Downside scenario library for every key value driver, feeding the whole model
- Opening balance-sheet seeds and macro drift assumptions set up a clean, error-free forecast start
Downstream Oil & Gas Revenues & Pricing
03. Market Macro
This market macro tab models crude oil and feedstock prices, product benchmark prices, FX, inflation, and interest rates across sixty months of history and a full ten-year forecast. It is the macroeconomic backbone of this refinery financial model, feeding every downstream pricing and cost calculation in the workbook.
Highlights:
- Monthly crude price curve compounds forward from a single seed input and growth assumption
- Gasoline, diesel, jet, LPG, and fuel oil benchmark prices derived directly from crack spreads
- CPI inflation index escalates operating costs consistently across every downstream cost line
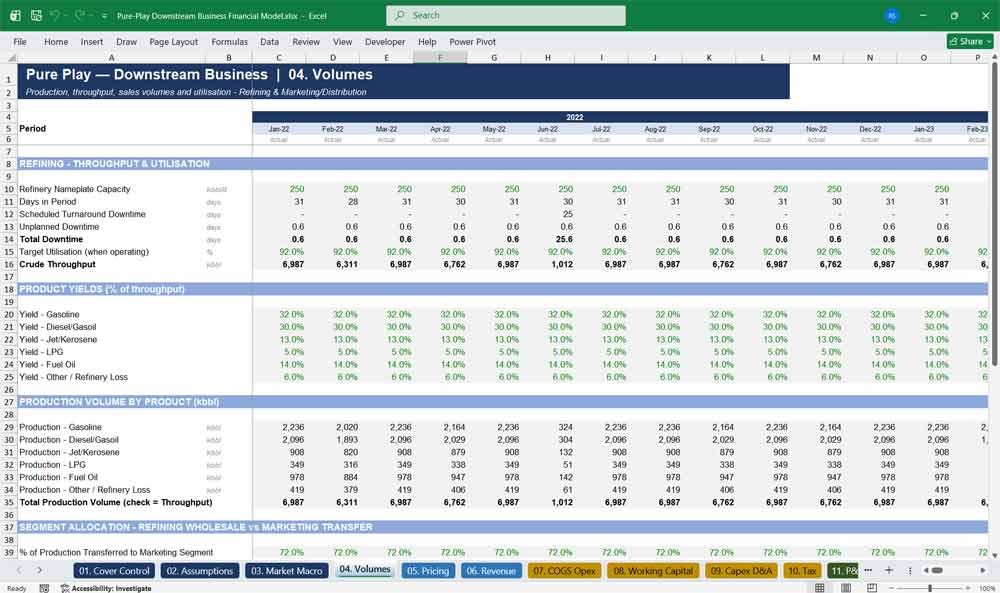
04. Volumes
The Volumes tab converts refinery nameplate capacity, planned turnarounds, and utilisation assumptions into monthly crude throughput and product-level production volumes. This operational core of the downstream financial model also splits output between wholesale third-party sales and internal transfers to the marketing and retail segment.
Highlights:
- Automatic turnaround scheduling reduces throughput on a configurable multi-year maintenance cycle
- Full product-level yield build for gasoline, diesel, jet, LPG, and fuel oil
- Segment volume split between refinery wholesale sales and marketing/retail transfer volumes
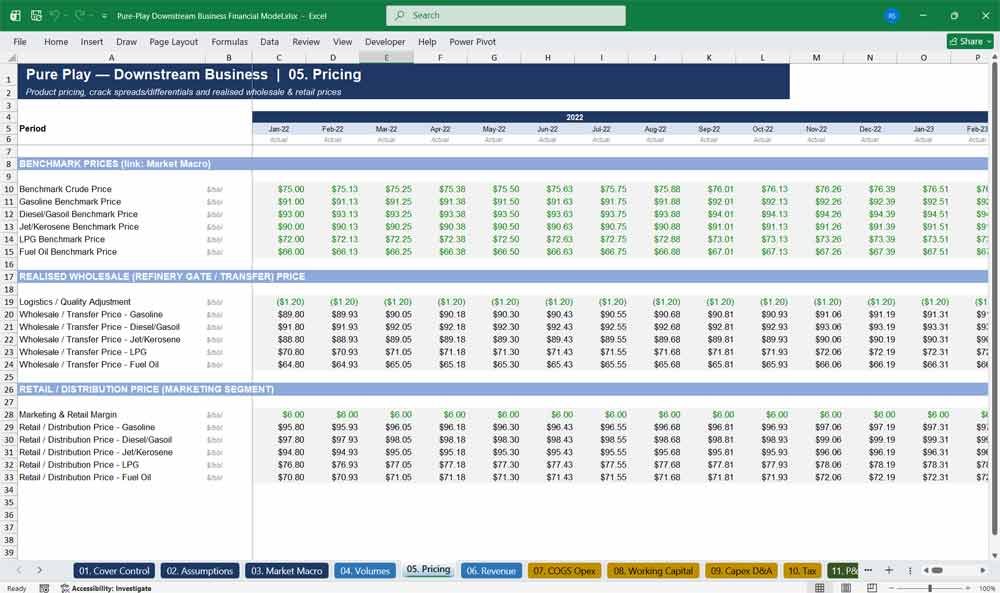
05. Pricing
This pricing tab builds realised wholesale and retail prices for every refined product from crude benchmarks, crack spreads, logistics adjustments, and marketing margins. It is the pricing engine of this downstream oil and gas Excel model, translating macro assumptions into segment-level realised pricing.
Highlights:
- Product-level benchmark, wholesale/transfer, and retail pricing waterfalls for all five products
- Logistics and quality adjustments applied consistently to reflect realistic refinery-gate economics
- Marketing margin assumption separates refining economics from retail/distribution profitability
06. Revenue
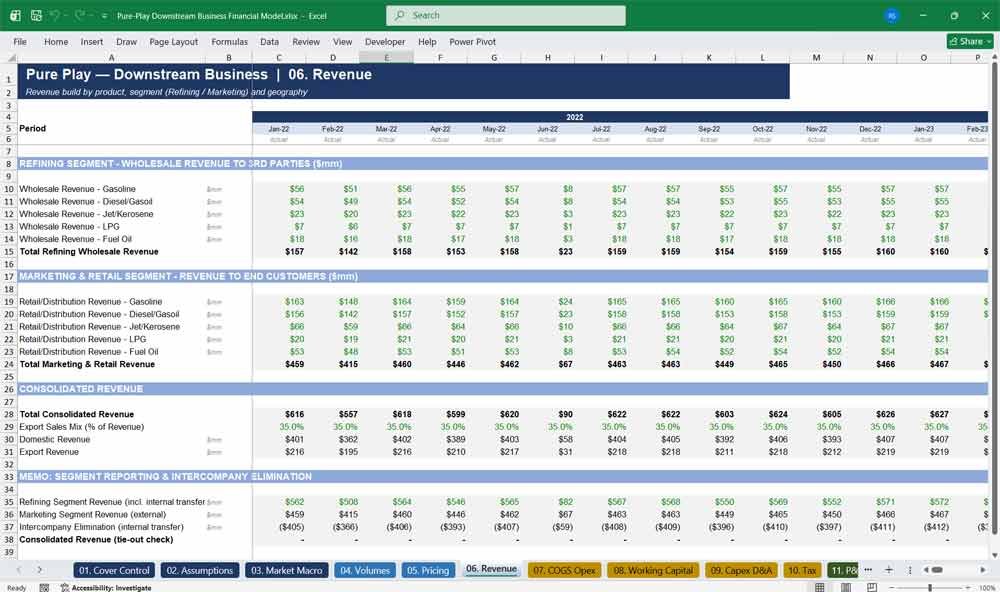
The Revenue tab builds consolidated revenue by product, segment, and geography, splitting refining wholesale sales from marketing and retail revenue while correctly eliminating intercompany transfers. This segment-level revenue build is a standout feature of this downstream business financial model, mirroring real refining company disclosures.
Highlights:
- Full revenue build across five products and two operating segments
- Domestic versus export revenue split for geographic reporting
- Built-in intercompany elimination and tie-out check confirm consolidated revenue is accurate
Downstream Oil & Gas Inventory Cash
07. COGS Opex
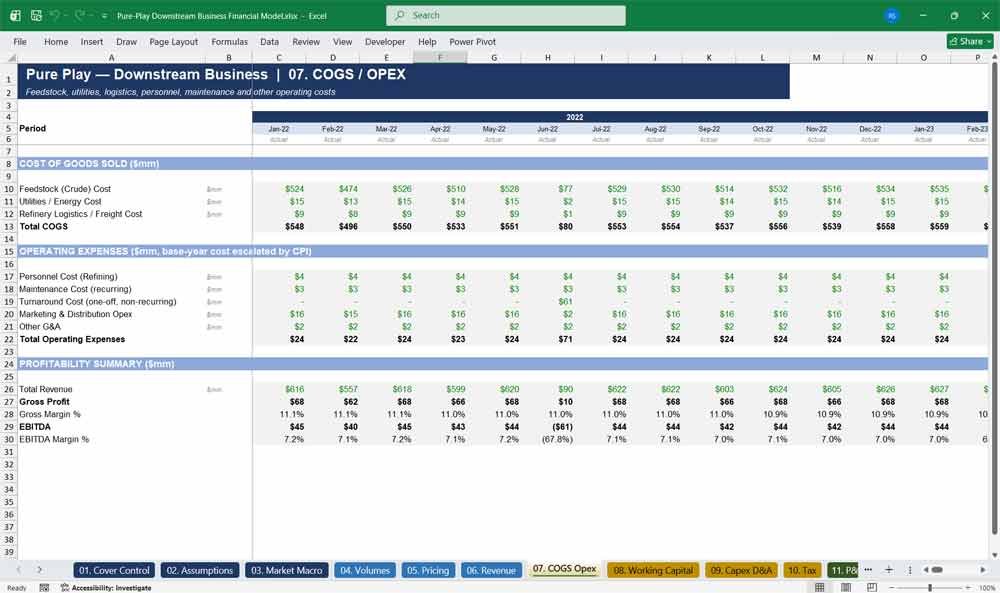
This COGS and Opex tab captures feedstock, utilities, logistics, personnel, maintenance, and marketing costs, escalated automatically with inflation. It rolls straight into gross profit and EBITDA, forming the profitability engine of this refinery and marketing financial model template.
Highlights:
- Feedstock, utilities, and logistics cost build directly from throughput and sales volumes
- Personnel, maintenance, turnaround, and G&A costs escalate automatically with the CPI index
- Automatic Gross Margin and EBITDA Margin calculation for every historical and forecast period
08. Working Capital
The Working Capital tab calculates accounts receivable, inventory, and accounts payable using day-based turnover ratios, then feeds the resulting cash impact directly into the cash flow statement. This working capital schedule keeps the downstream financial model’s cash flow fully mechanical and audit-ready.
Highlights:
- Days-based AR, inventory, and AP calculation consistent with refining industry conventions
- Automatic net working capital and period-over-period change calculation
- Feeds directly into the Cash Flow tab with no manual adjustment required
09. Capex D&A
This capex and depreciation tab rolls forward gross PP&E and accumulated depreciation from maintenance and growth capital expenditure assumptions. As the fixed-asset engine of this refinery financial model, it links directly into the income statement, tax schedule, and balance sheet.
Highlights:
- Separate maintenance and growth capex build, driven by throughput and a custom capex plan
- Straight-line depreciation schedule fully rolled forward on gross PP&E
- Net PP&E flows automatically into the Balance Sheet with a built-in roll-forward check
10. Tax
The Tax tab models the effective tax rate, net operating loss carryforwards, cash taxes, and deferred tax liabilities using accelerated tax depreciation assumptions. This tax schedule gives this downstream oil and gas financial model the sophistication of a professional-grade tax provision build.
Highlights:
- NOL roll-forward with automatic usage against taxable income each period
- Deferred tax liability roll-forward capturing book-versus-tax depreciation timing differences
- Cash tax and book tax expense calculated and reconciled separately
Downstream Key Metrics
11. Income Statement (P&L)
This income statement tab consolidates revenue, costs, D&A, interest, and tax into a clean, fully-linked profit and loss statement with margin analysis at every level. As the reporting hub of this downstream financial model, it feeds the cash flow statement, balance sheet, and valuation tabs directly.
Highlights:
- Full P&L build from revenue through net income with margin ratios at every subtotal
- Net interest expense calculated from the fully mechanical debt schedule, avoiding circular references
- Directly linked to the Tax tab for accurate, non-circular tax expense recognition
12. Balance Sheet
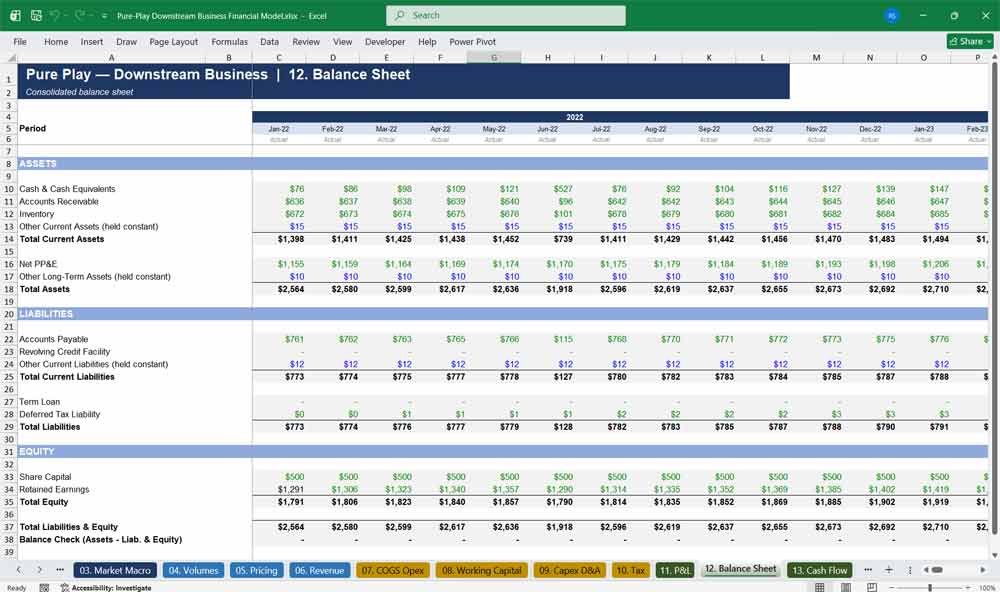
The Balance Sheet tab presents a fully consolidated statement of assets, liabilities, and equity that balances to the cent across all 130 historical and forecast periods. This balance sheet is a core proof point of this refinery financial model’s structural integrity and formula accuracy.
Highlights:
- Automatic balancing via a solved opening retained earnings plug at the historical start date
- Full roll-forward of cash, debt, PP&E, deferred tax, and retained earnings
- Built-in balance check confirms Assets equal Liabilities plus Equity in every single period
13. Cash Flow
This cash flow statement tab presents operating, investing, and financing cash flows plus free cash flow, fully reconciled to the balance sheet cash balance. It is the mechanical centrepiece of this downstream oil and gas Excel model, driving the revolving credit facility cash sweep automatically.
Highlights:
- Full indirect-method CFO build from net income, D&A, deferred tax, and working capital
- Automatic free cash flow calculation feeding directly into the valuation tab
- Cash roll-forward ties out exactly to the Balance Sheet cash line every period
14. Debt Financing
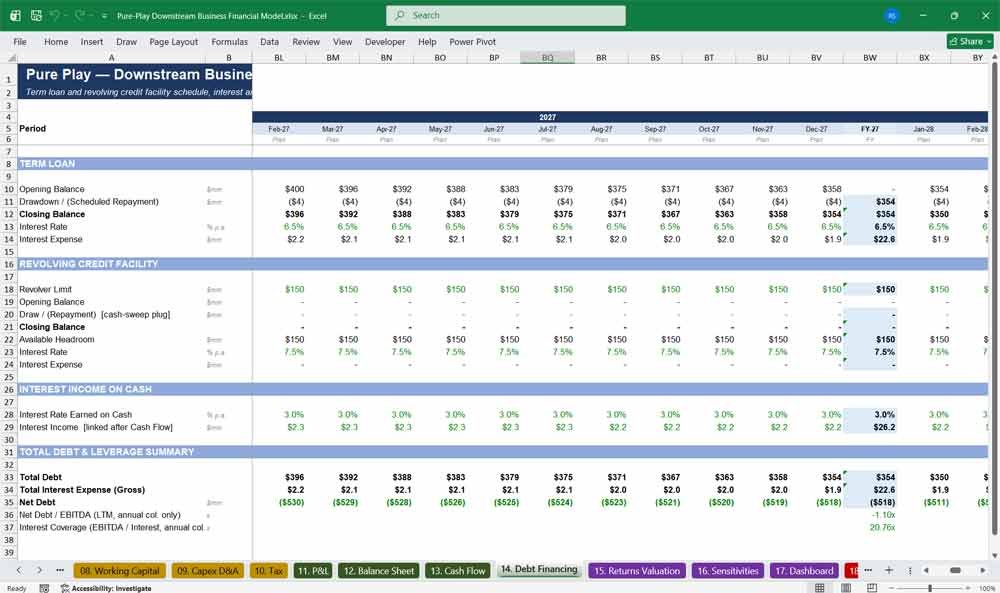
The Debt Financing tab models a fully amortising term loan alongside a revolving credit facility sized automatically by a non-circular cash-sweep mechanism. This debt schedule is one of the most technically rigorous features of this downstream financial model, avoiding the circular-reference errors common in DIY models.
Highlights:
- Fully amortising term loan schedule with configurable tenor and annual amortisation rate
- Revolver draws and repayments calculated automatically from available cash versus a minimum cash policy
- Net debt, leverage, and interest coverage ratios calculated automatically for every period
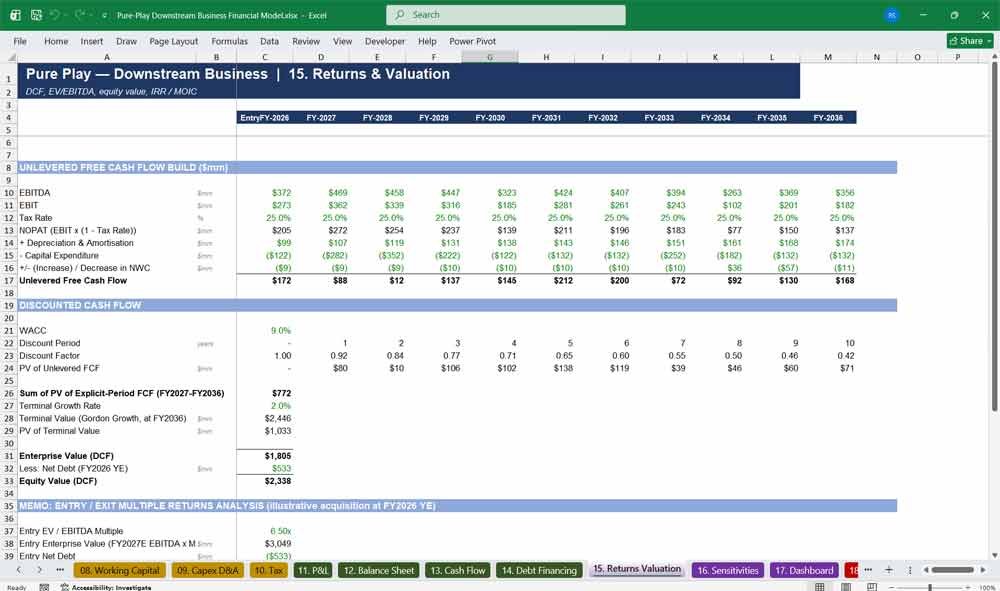
15. Returns Valuation
This valuation tab delivers a full discounted cash flow analysis alongside an entry/exit multiple returns analysis with IRR and MOIC calculations. As the capstone of this downstream business financial model, it converts the ten-year operating plan into an actionable enterprise and equity valuation.
Highlights:
- Complete unlevered free cash flow build, discounted at WACC with a Gordon Growth terminal value
- Entry and exit EV/EBITDA multiple framework with a full IRR cash flow array
- Automatic MOIC and IRR calculation reflecting both dividends received and exit equity value
16. Sensitivities
The Sensitivities tab stress-tests valuation and returns against WACC, terminal growth, exit multiple, crude price, margin, volume, and cost shocks. This sensitivity analysis tab gives users of this refinery financial model an immediate view of key value drivers and downside risk.
Highlights:
- Exact WACC and terminal growth sensitivity fully re-derived from the underlying DCF cash flows
- Exact exit multiple sensitivity on equity value, MOIC, and IRR
- Documented elasticity-based sensitivity for crude price, margin, volume, and opex shocks
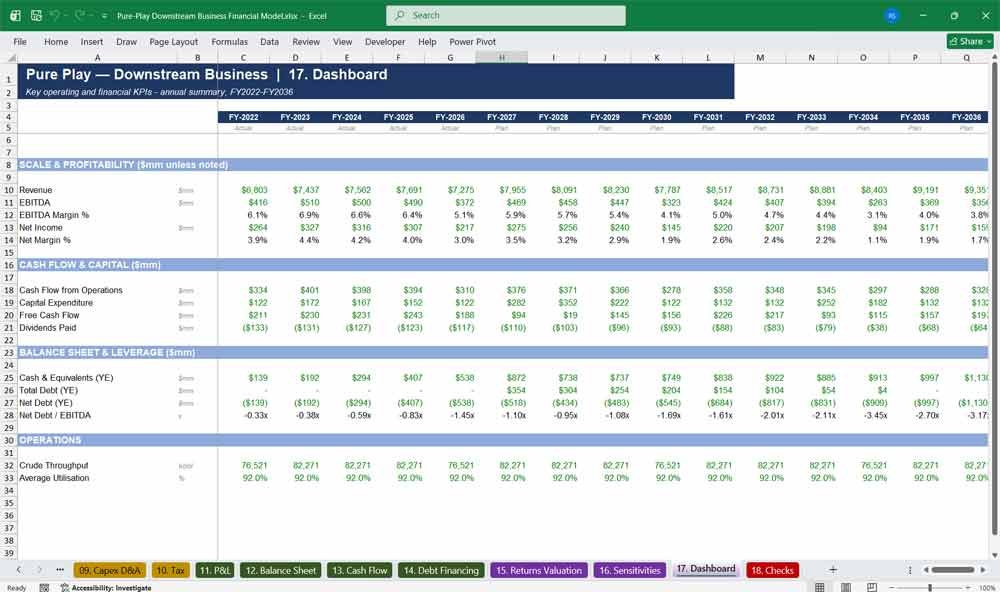
17. Dashboard
This executive dashboard tab summarises revenue, EBITDA, margins, free cash flow, leverage, and operating KPIs on a clean annual view from FY2022 through FY2036. It is the at-a-glance reporting layer of this downstream oil and gas financial model, ideal for board and investment committee presentations.
Highlights:
- Fifteen-year annual KPI summary spanning five years of history and ten years of forecast
- Automatic Net Debt/EBITDA leverage tracking alongside free cash flow and dividend history
- Clean, presentation-ready layout suitable for direct use in investment committee materials
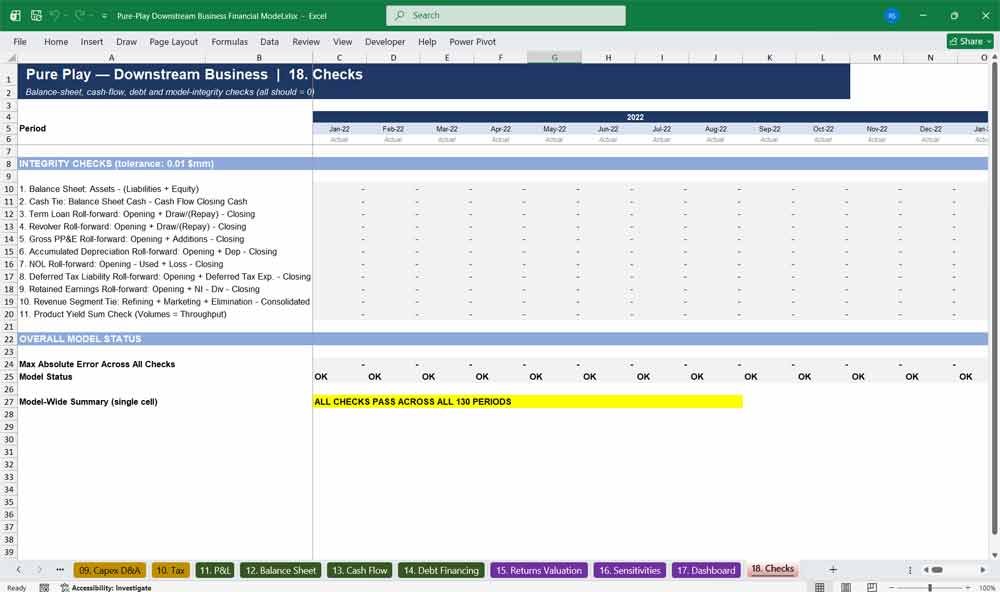
18. Checks
The Checks tab independently verifies balance-sheet balancing, cash reconciliation, and every roll-forward schedule across all 130 periods in this downstream financial model. This built-in audit layer gives buyers immediate confidence that the model is error-free and ready for real-world financial analysis.
Highlights:
- Eleven independent integrity checks covering the balance sheet, cash flow, debt, tax, and revenue
- Single-cell “ALL CHECKS PASS” status flag for instant model validation
- Designed so any future edits can be re-verified in seconds, protecting model integrity
Oil & Gas Frequently Asked Questions
What exactly am I getting when I purchase this financial model?
You receive a single, fully-linked Excel workbook (.xlsx) containing eighteen tabs that together form a complete three-statement financial model, debt schedule, tax build, DCF valuation, sensitivity analysis, and executive dashboard for a pure-play downstream (refining plus marketing) oil and gas business. Every number is a live formula, not a static value, so the entire model recalculates when you change an assumption.
Do I need any special Excel add-ins, macros, or plugins to use this model?
No. The model uses only standard Excel formulas — no VBA macros, no third-party add-ins, and no proprietary functions. It opens and recalculates in any modern version of Excel (2016 or later) as well as in Excel for Microsoft 365, and it is compatible with LibreOffice Calc.
Is this model based on a real company, or is it a generic template?
This is an illustrative, fully-editable template built with realistic placeholder assumptions rather than a specific company’s confidential data. Every input — refinery capacity, crack spreads, cost levels, financing terms — is a clearly marked blue input cell that you can overwrite with your own or a target company’s actual figures in a matter of minutes.
Can I use this model for a company that only does refining, or only does marketing and retail, without the other segment?
Yes. Because the Volumes, Pricing, and Revenue tabs separate the refining and marketing/retail segments explicitly, you can set the intercompany transfer percentage to 0% or 100% to effectively model a pure refiner or a pure marketing and distribution business, and simply ignore the segment you don’t need.
Will this model work for a real acquisition, financing, or investment analysis?
Yes. The model includes a full DCF valuation, an entry/exit multiple returns framework with IRR and MOIC, a mechanical debt schedule with a cash-sweep revolver, and a dedicated Checks tab that verifies balance-sheet and cash-flow integrity — the same structure used in real investment banking, private equity, and corporate development financial models.
Does the model include historical data, or only a forecast?
Both. The model includes five years of illustrative monthly historical data (FY2022–FY2026) alongside a ten-year operating plan (FY2027–FY2036), with the first five forecast years shown monthly with annual roll-ups and the final five years shown annually, exactly matching how professional downstream financial models are typically structured.
How is the model checked for errors?
Every formula in the workbook has been recalculated and verified to return zero formula errors. In addition, the dedicated Checks tab independently re-derives eleven separate integrity tests — including balance-sheet balancing, cash reconciliation, and debt, tax, and revenue roll-forwards — across every one of the model’s 130 periods, with a single summary cell confirming that all checks pass.
Can I add my own scenarios, or change the scenario assumptions?
Yes. The Cover Control tab includes a scenario selector (Base Case, Upside Case, Downside Case) that drives every scenario-sensitive assumption in the Assumptions tab. You can edit the underlying Base, Upside, and Downside input values directly, and every formula in the model will automatically recalculate under the selected scenario.
Is this model suitable for students or people learning financial modeling, or is it only for professionals?
Both. The model’s clear colour-coding (blue for inputs, black for formulas, green for links to other tabs), consistent tab structure, and built-in Checks tab make it an excellent learning tool for finance students and career-changers, while its depth and rigor make it equally suitable for professional use by analysts, associates, and corporate finance teams.
What currency and units does the model use, and can I change them?
The model is built in US dollars, with financial figures in $ millions and operating volumes in thousand barrels (kbbl), as noted on the Cover Control tab. Since every dollar and volume figure flows from formulas rather than hardcoded values, you can rescale the model to a different currency or unit convention by updating the relevant seed and assumption cells.
Valuing Your Downstream Oil and Gas With A DCF
Discounted Cash Flow for a Downstream Terminal
Discounted Cash Flow (DCF) analysis for your downstream oil and gas terminal estimates the asset’s value based on projected future cash flows generated from storage, handling, blending, and distribution activities. Revenue is typically driven by throughput volumes, storage capacity utilization, and fee-based contracts, while expenses include operating costs, maintenance, and capital expenditures. The forecasted free cash flows over a defined period are discounted to present value, along with a terminal value reflecting the asset’s long-term operating potential, to determine the terminal’s intrinsic value.
WACC for a Downstream Terminal
Weighted Average Cost of Capital (WACC) serves as the appropriate discount rate for valuing your downstream oil and gas terminal, reflecting the blended cost of debt and equity financing. Compared to upstream assets, downstream terminals often have more stable, fee-based cash flows, which can result in a lower risk profile and potentially lower cost of capital. The WACC captures investors’ required returns, the company’s capital structure, and the tax advantage of debt, representing the minimum return necessary to justify investment in the terminal.
Sensitivity Analysis for a Downstream Terminal
Sensitivity analysis is essential when valuing your downstream oil and gas terminal to assess how changes in key assumptions affect overall valuation. Analysts typically test variables such as throughput volumes, storage rates, operating margins, contract renewals, capital expenditures, and WACC. By evaluating how these inputs influence the DCF outcome, sensitivity analysis helps identify the most critical value drivers and provides a clearer view of potential risks and valuation ranges.
Further Reading
Midstream Model: Are you looking to evaluate infrastructure assets, project pipeline cash flows, or pitch to energy investors? Master your valuation with this Institutional-Grade Midstream Oil & Gas Financial Model—fully dynamic, pre-structured for tariff revenue, and built to handle complex volumetric forecasting..
- Upstream Version: Maximize your acquisition or drilling returns with this investor-ready Upstream Oil & Gas Financial Model, built specifically to stress-test complex production curves, fiscal regimes, and volatile oil prices in seconds.
- LNG Terminal Model: Looking to secure funding or evaluate the returns of a multi-billion dollar energy project? Download this comprehensive, investor-ready LNG Terminal Financial Model to instantly project capital expenditures, liquefaction and regasification revenues, charter rates, and debt-scoping metrics with institutional-grade accuracy.
Final Notes on the Financial Model
This 10-year Downstream Oil Gas Financial Model must focus on balancing capital expenditures with steady revenue growth from diversified sales and services. By optimizing operational costs, productivity and efficiency, and maximizing high-margin services, the model ensures a great view of profitability and cash flow stability.
Download Link on Next Page
Download Link on Next Page