
SOTP Financial Model Template
Professional editable 8 Year SOTP Financial Model Template Excel This fully-linked, eight-year Sum-of-the-Parts (SOTP) valuation model built for a multi-segment business. It combines three years of historical financials (FY2023A–FY2025A) with a five-year forecast (FY2026E–FY2030E), and values each business segment independently before aggregating the results into a single, defensible equity value per share.
8-Year Some Of The Parts (SOTP) Financial Model
Rather than valuing the company as one blended enterprise, the breakup analysis model breaks it into its component segments, forecasts each one on its own operating drivers, and values each using three standard methodologies — a discounted cash flow analysis, trading comparables, and precedent transactions. Those three views are blended into a single value per segment, summed together, and then adjusted for unallocated corporate overhead, a holding-company discount, and net debt to arrive at an implied share price. A terminal value captures the cash flows expected beyond the five-year explicit forecast, so no value is left on the table past 2030.
The workbook is organized into fifteen tabs, each with a distinct role in the analysis — from raw assumptions and historical data, through segment-level forecasting and valuation, to the final bridge and output summary. Every figure flows from formulas rather than hardcoded results, so a single change to an assumption — a growth rate, a multiple, a discount rate — ripples automatically through the entire model. Inputs are color-coded (blue for hardcoded assumptions, black for formulas, green for links to other tabs) so it’s always clear where a number originates and where it feeds.
Control & Navigation
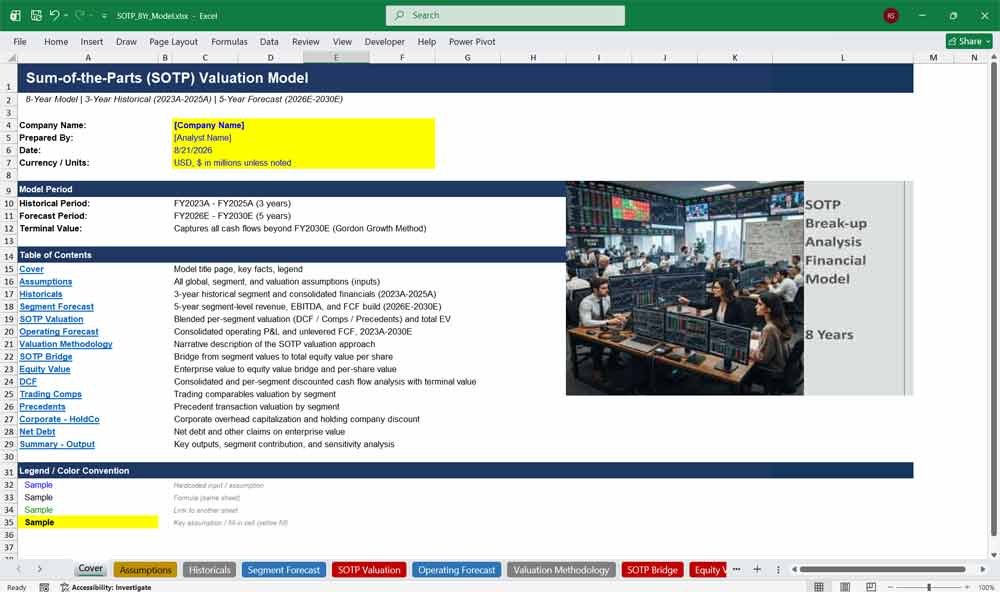
Cover
The landing page of the model. It states the company name, preparation date, and units, summarizes the historical and forecast periods, and provides a clickable table of contents linking directly to every other tab. A short legend explains the color and formatting conventions used throughout the workbook, so any reader can orient themselves before diving into the numbers.
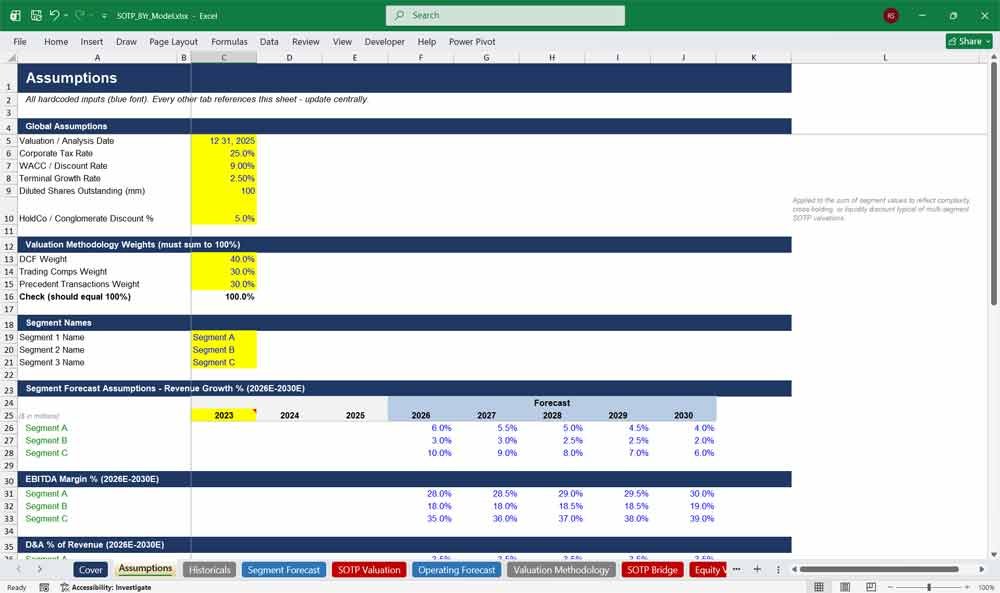
Assumptions
The control panel for the entire breakup model. Every hardcoded input lives here: the tax rate, WACC, terminal growth rate, share count, and holding-company discount; the weighting applied across the three valuation methodologies; and, for each segment, the revenue growth, EBITDA margin, D&A, capex, and working-capital assumptions that drive the five-year forecast. Trading and precedent transaction multiples and net debt inputs are also centralized here. Because every other tab references these cells rather than re-entering figures, updating an assumption in one place updates the entire model.
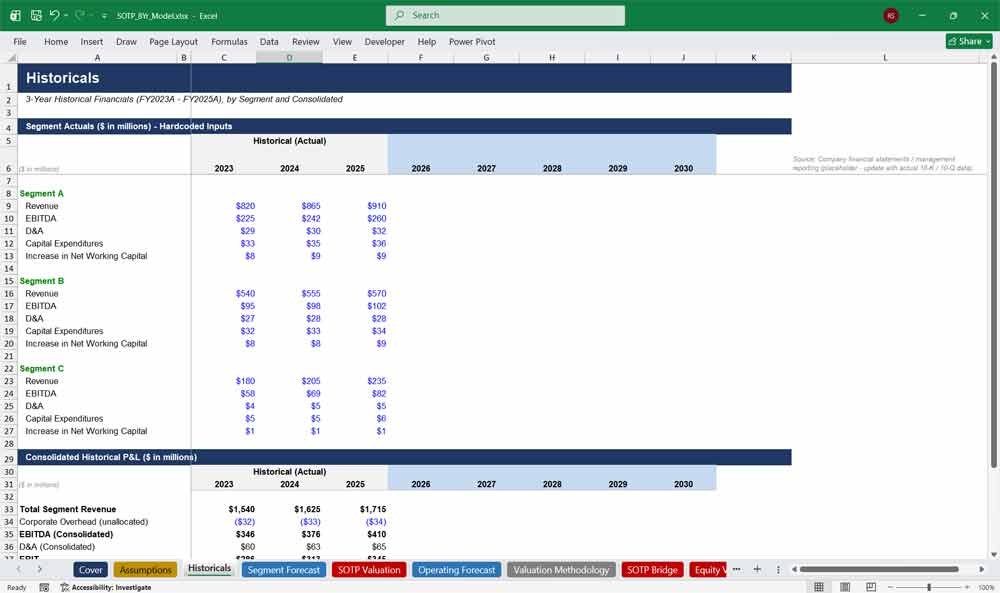
Historicals
The factual foundation of the model. Three years of actual segment-level financials — revenue, EBITDA, D&A, capex, and working capital — are entered here for each segment, then rolled up into a consolidated historical P&L down to net income. This tab anchors the forecast: growth rates and margins in later years are calculated relative to the actuals recorded here.
SOPT Valuations & Forecasting
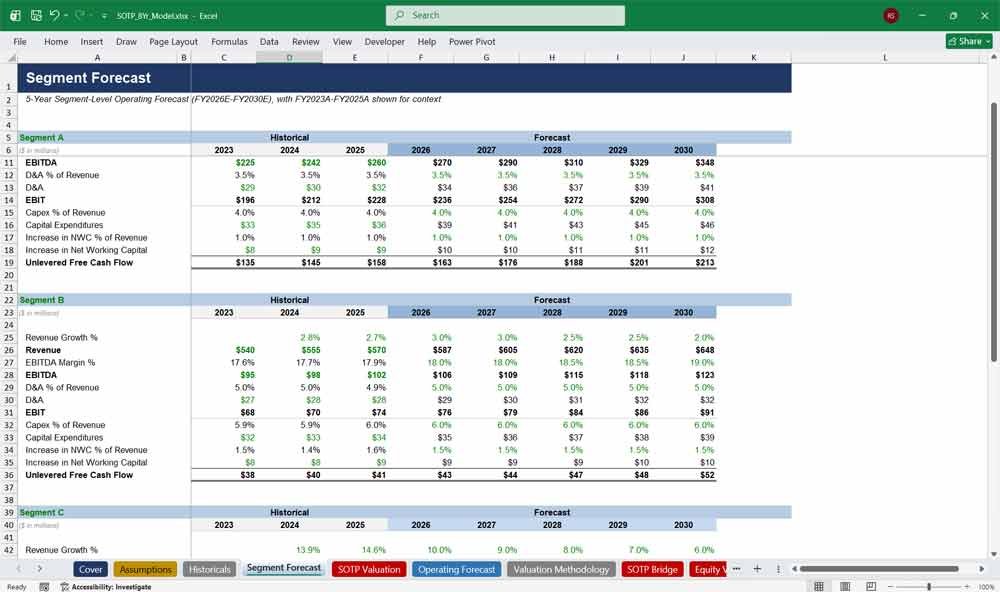
Segment Forecasts
Where the five-year outlook is built, segment by segment. Starting from the last historical year, each segment’s revenue is grown using its assumed growth rate, EBITDA is derived from its margin assumption, and D&A, capex, and working capital are calculated as a percentage of revenue. The result is a full unlevered free cash flow build for each segment, plus a consolidated total that feeds the Operating Forecast tab.
SOTP Valuation
The heart of the sum-of-the-parts analysis. For each segment, this tab pulls in the enterprise value implied by the DCF, Trading Comps, and Precedent Transactions tabs, applies the weighting set in Assumptions, and calculates a single blended value. Those blended segment values are summed and adjusted for the corporate/holding-company impact to produce the total enterprise value for the business.
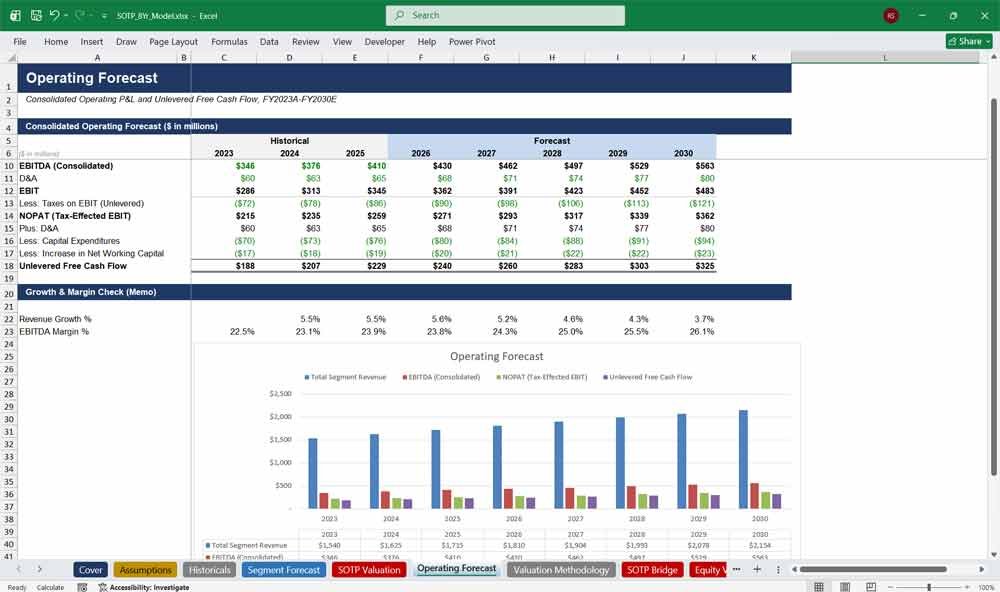
Operating Forecast
The consolidated income statement and cash flow view across all eight years. Historical figures are pulled from the Historicals tab and forecast figures from the Segment Forecast tab, combined with corporate overhead, to build a single unlevered free cash flow line that ties the segment-level detail back to one consolidated picture — and feeds the consolidated DCF cross-check.
Some Of The Parts (SOTP) Bridge Methods
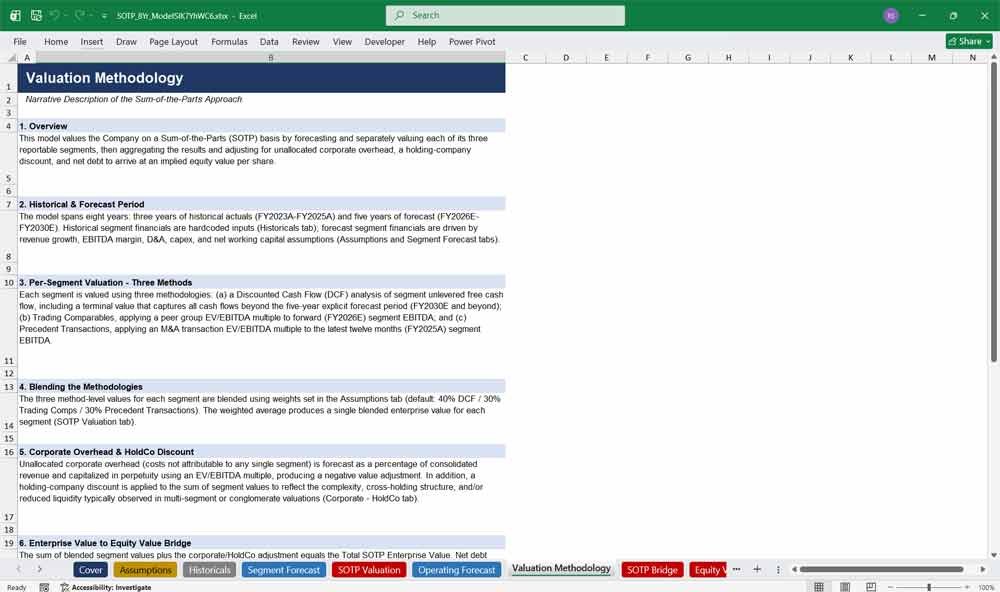
Valuation Methodology
A plain-language walkthrough of the approach: why the business is valued in parts, how each segment is forecast and valued three different ways, how those views are blended, how corporate overhead and the holding-company discount are applied, and how the terminal value captures cash flows beyond the forecast horizon. This tab is meant to orient a reader who wants to understand the logic before working through the mechanics.
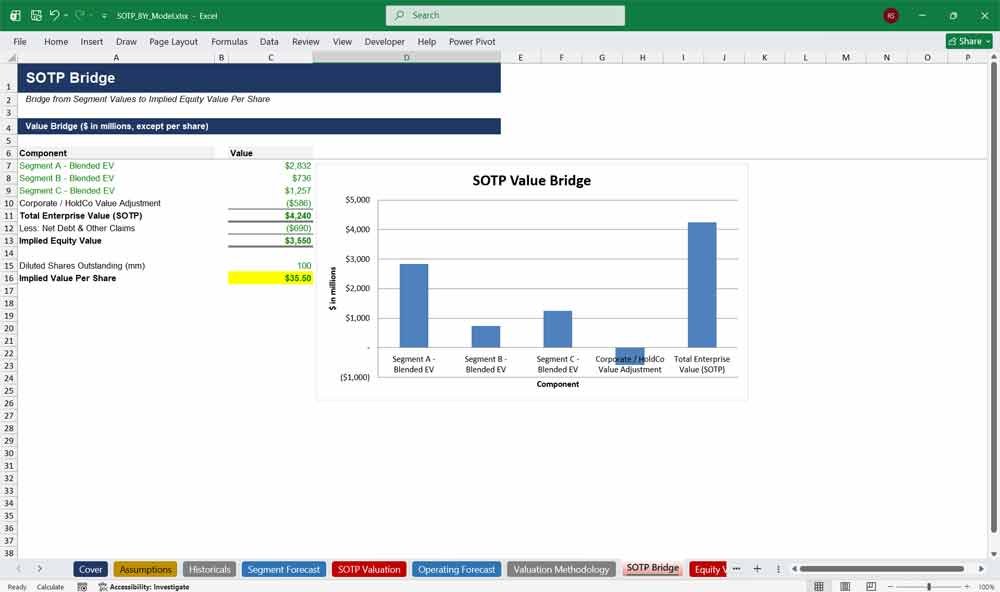
SOTP Bridge
A single, visual bridge from segment values to the final share price. It stacks each segment’s blended enterprise value, the corporate/holdco adjustment, the deduction for net debt, and the resulting equity value and per-share figure — with an accompanying chart so the build-up can be seen at a glance rather than traced through formulas.
Breakup Analysis Equity Value
The formal bridge from enterprise value to equity value. It takes the total SOTP enterprise value, subtracts net debt and other claims (minority interest, preferred equity), and divides the resulting equity value by diluted shares outstanding to produce the model’s headline output: implied value per share.
SOTP Net Valuations
Trading Comps
Values each segment by applying a trading multiple (EV/EBITDA) to its forward EBITDA, based on how similar, publicly-traded companies are valued in the market. A placeholder peer-set table is included so real comparable companies and their multiples can be dropped in without altering the tab’s structure.
Breakup Analysis Precedents
Values each segment using EV/EBITDA multiples paid in comparable M&A transactions, applied to trailing-twelve-month EBITDA. Like the Trading Comps tab, it includes a fill-in-able table of illustrative deals so actual precedent transactions and their multiples can be substituted directly.
Corporate – HoldCo
Captures the two adjustments that apply above the segment level: unallocated corporate overhead, which is forecast and capitalized as a perpetuity to reflect its permanent drag on value, and a holding-company discount applied to the sum of segment values to reflect the complexity and reduced liquidity often associated with multi-segment businesses.
Net Debt
A concise net debt schedule: total debt less cash produces net debt, to which minority interest and preferred equity are added, producing the total claims that sit ahead of common equity in the enterprise-to-equity bridge.
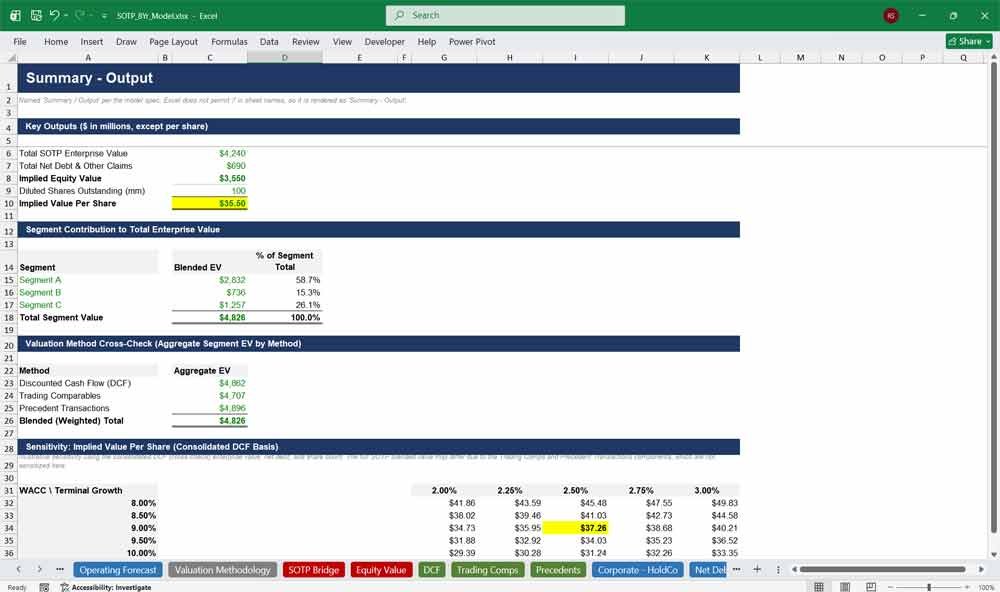
Summary Output
The one-page output for decision-makers. It restates the headline enterprise value, equity value, and per-share figure; shows each segment’s dollar and percentage contribution to total value; cross-checks the aggregate value implied by each of the three valuation methods; and includes a WACC / terminal-growth sensitivity grid so a reader can see how the per-share value moves under different discounting assumptions.
Value Your Some Of The Parts Model (SOTP) With A DCF
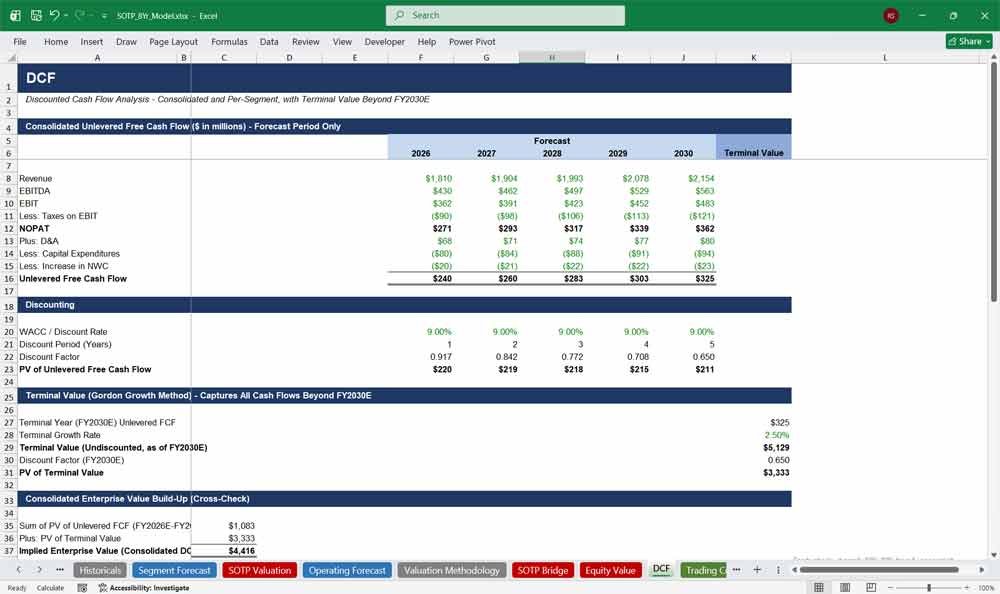
The discounted cash flow engine, run twice: once as a consolidated cross-check on the whole business, and once for each individual segment. Each version builds unlevered free cash flow from EBIT, discounts it at the WACC, and calculates a terminal value using the Gordon Growth method — capturing the present value of every cash flow expected beyond FY2030E. The per-segment enterprise values calculated here feed directly into the SOTP Valuation tab.
Further Reading
Merger & Acquisitions Model: Download a professional M&A financial model. Dynamic valuation, accretion/dilution analysis, synergies, and debt schedules.
- LBO Model: Ready to master corporate finance? Download our proven, step-by-step LBO financial model template to analyze leveraged buyouts, project debt paydown, and forecast returns like a seasoned private equity professional.
- IPO Model: A fully-linked, formula-driven financial model built to take a company from
historical actuals through an IPO and out to a five-year forward plan.