
Option Trading Financial Model Template
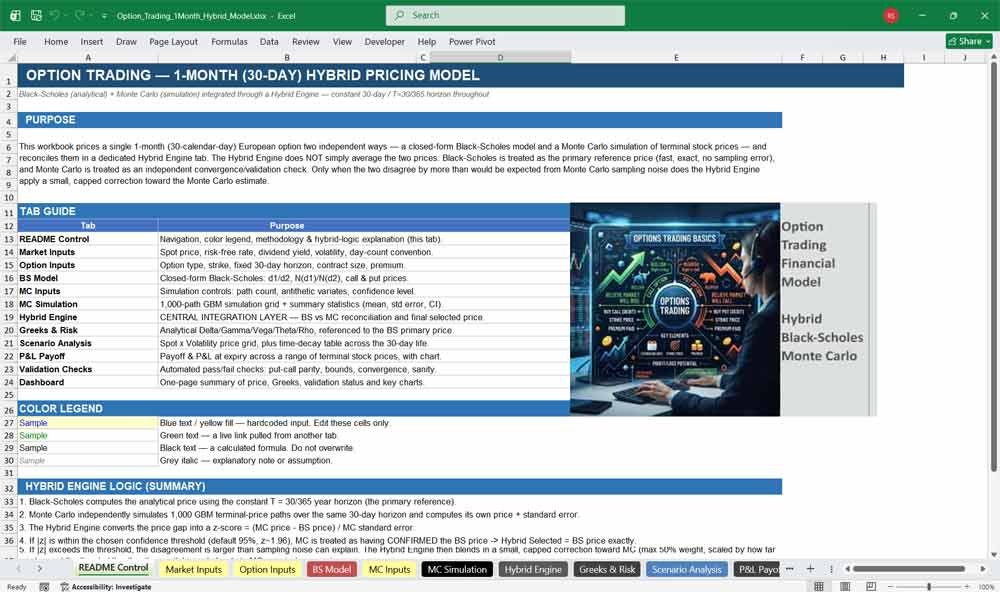
This Option Trading Financial Model Template in Excel prices a 1-month (30-calendar-day) option using two independent methods side by side: a closed-form Black-Scholes calculation and a Monte Carlo simulation of 1,000 simulated stock-price paths. Both engines run on the exact same 30-day horizon, so the comparison between them is a true apples-to-apples test, not an artifact of mismatched assumptions.
30 Day Option Trading Financial Model
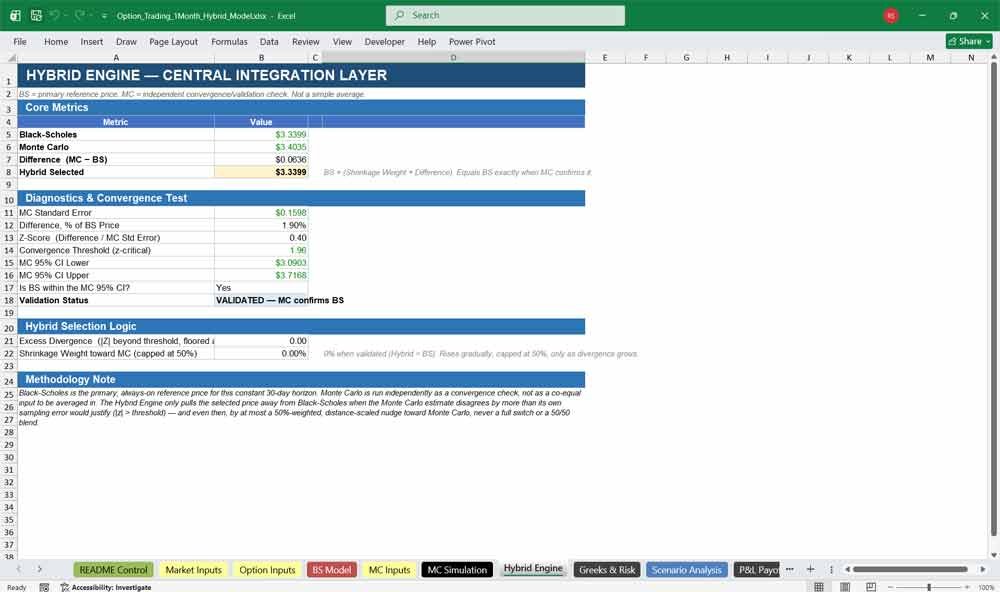
What makes the model distinctive is how it reconciles the two prices. Rather than simply averaging Black-Scholes and Monte Carlo together, a dedicated Hybrid Engine tab treats Black-Scholes as the primary, always-on reference price and treats Monte Carlo as an independent convergence check. The Hybrid Engine converts the gap between the two prices into a statistical z-score, and only nudges the final answer toward Monte Carlo when that gap is larger than ordinary simulation noise would explain — and even then, by a small, capped amount rather than a wholesale switch. In every case where the two methods agree within statistical tolerance, the Hybrid Selected price is Black-Scholes, exactly.
The model is organized into twelve tabs: inputs are separated from calculations, the two pricing engines are kept independent until they reach the Hybrid Engine, and everything downstream — Greeks, scenarios, payoff, validation, and the dashboard — is built on top of that reconciled price. Monte Carlo cells are volatile (they use RAND()), so pressing F9 redraws a fresh simulation batch and lets you watch the Hybrid Engine’s convergence test respond in real time.
Tab-by-Tab Guide
Control & Navigation
Control
The front door to the model. This tab explains the purpose of the workbook, walks through what each tab does, defines the color-coding used throughout (blue inputs, green cross-tab links, black formulas), and lays out the Hybrid Engine’s decision logic in plain language before the reader ever sees a formula. It also carries the operating notes — most importantly, that the Monte Carlo tab is volatile and the 30-day horizon is fixed by design.
Market Inputs
Holds the underlying market data that both pricing engines draw from: spot price, the continuously-compounded risk-free rate, dividend yield, annualized volatility, and the day-count convention used to convert the 30-day horizon into years. Every other tab in the model traces back to these five inputs, so changing a number here flows through the entire workbook.
Option Inputs
Defines the specific contract being priced: call or put, strike price, contract multiplier, position size, and the premium paid or received. This is also where the 30-day time horizon itself lives as a fixed, clearly-labeled constant — the one input that defines this as a “1-month model” rather than a general-tenor one.
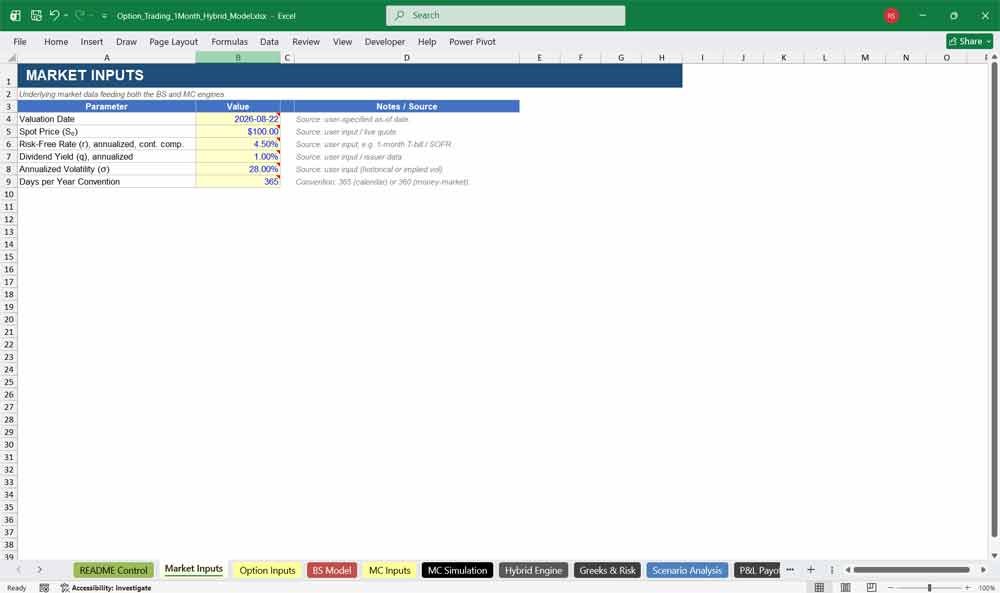
Option Trading Model Inputs
Black Scholes
The closed-form Black-Scholes engine. It builds d1 and d2 from the linked market and option inputs, computes the cumulative normal probabilities, and derives both the call and put price. This tab’s selected price becomes the primary reference the Hybrid Engine is built around.
Monte-Carlo Inputs
Configuration for the simulation engine: number of paths, the drift and diffusion terms derived from the market inputs, whether antithetic variates are used to reduce sampling variance, and the confidence level used to build the simulation’s confidence interval — which later becomes the Hybrid Engine’s convergence threshold.
Monte-Carlo Simulation
The simulation itself: 1,000 independently drawn terminal stock prices under geometric Brownian motion over the same 30-day horizon, each priced into a call and put payoff and discounted back to today. Antithetic pairing (drawing each random shock alongside its mirror image) cuts down noise for a given path count. The bottom of the tab summarizes the results — mean price, standard deviation, standard error, and a 95% confidence interval — which feed directly into the Hybrid Engine.
Hybrid Engine
The central integration layer, and the heart of the model. It lays out the four key metrics side by side — Black-Scholes, Monte Carlo, Difference, and Hybrid Selected — and then shows the reasoning behind the last one. A z-score measures how far Monte Carlo’s price sits from Black-Scholes relative to Monte Carlo’s own sampling error. If that gap is within the chosen confidence threshold, Monte Carlo is treated as having confirmed Black-Scholes, and the Hybrid Selected price equals Black-Scholes exactly. If the gap is larger than sampling noise would explain, a capped shrinkage weight (never more than 50%) pulls the selected price partway toward Monte Carlo, scaled to how far outside tolerance the divergence actually is. The result is a price that leans on the fast, exact analytical model by default, and only listens to the simulation when the simulation has something statistically meaningful to say.
Option Trading Analytics Model
Greeks & Risk
Delta, Gamma, Vega, Theta, and Rho, computed analytically from the Black-Scholes model for both the call and put, with the relevant side selected automatically based on the option type. A second section scales the selected Greeks by contract multiplier and position size to show dollar risk exposure at the position level, not just per share.
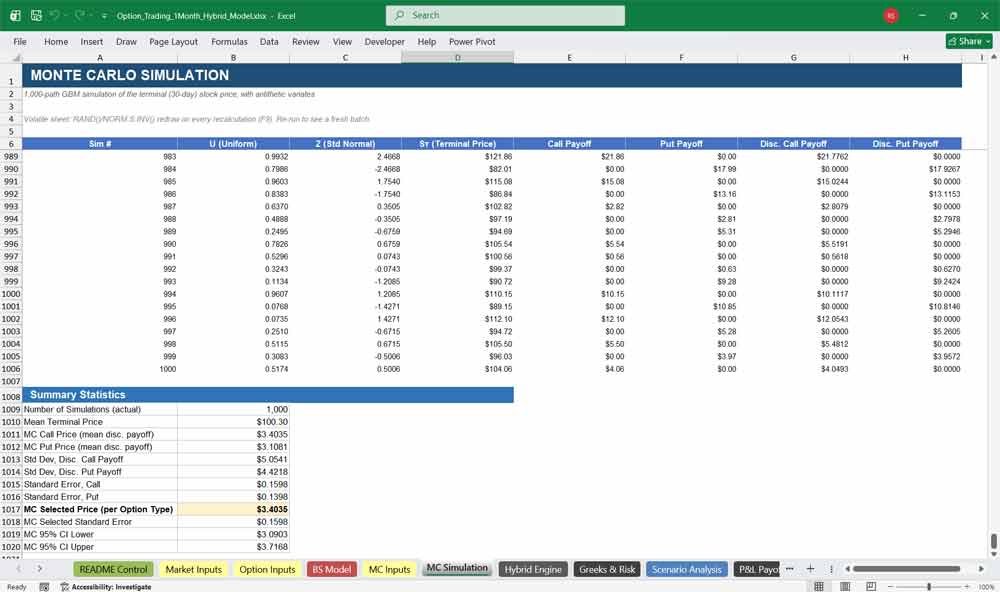
Option Trading Mechanics
Scenario Analysis
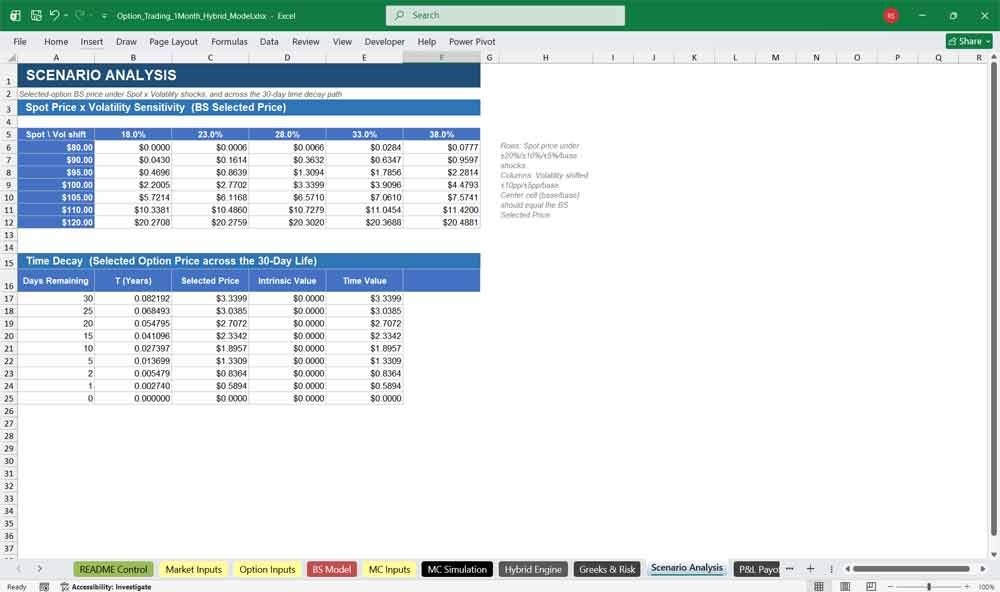
Two stress views of the priced option. The first is a spot-price-by-volatility grid showing how the selected option price moves under a range of underlying and volatility shocks. The second is a time-decay table tracing the option’s price, intrinsic value, and time value as days-to-expiry counts down from 30 to zero.
Profit & Loss (P&L) Payoff
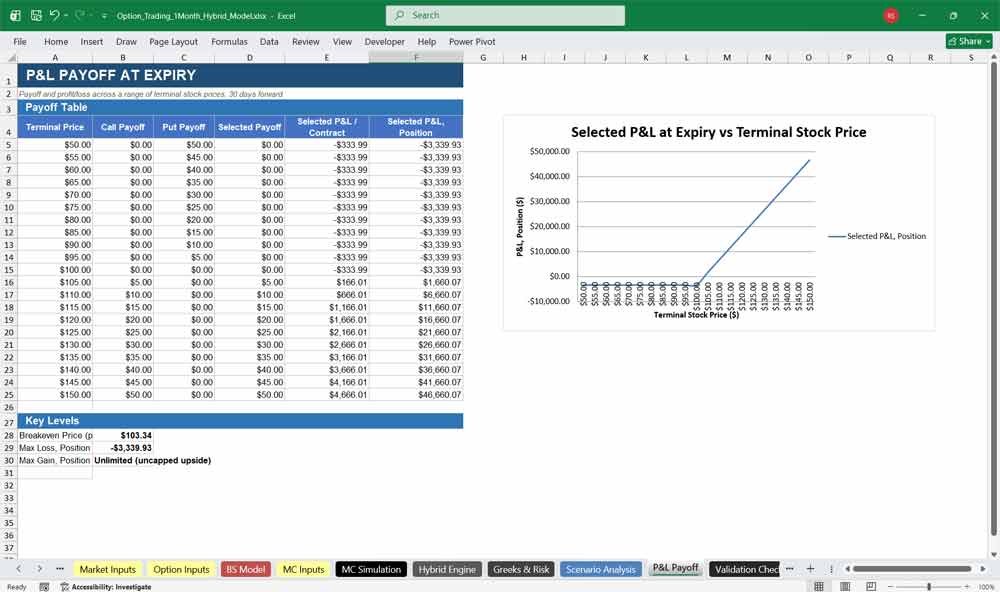
Maps the option’s payoff and profit/loss at expiry across a wide range of possible terminal stock prices, both per contract and at full position size. It also calculates the breakeven price and the maximum loss (and maximum gain, where applicable), and includes a chart plotting P&L against the terminal stock price.
Option Sanity Checks
Validations
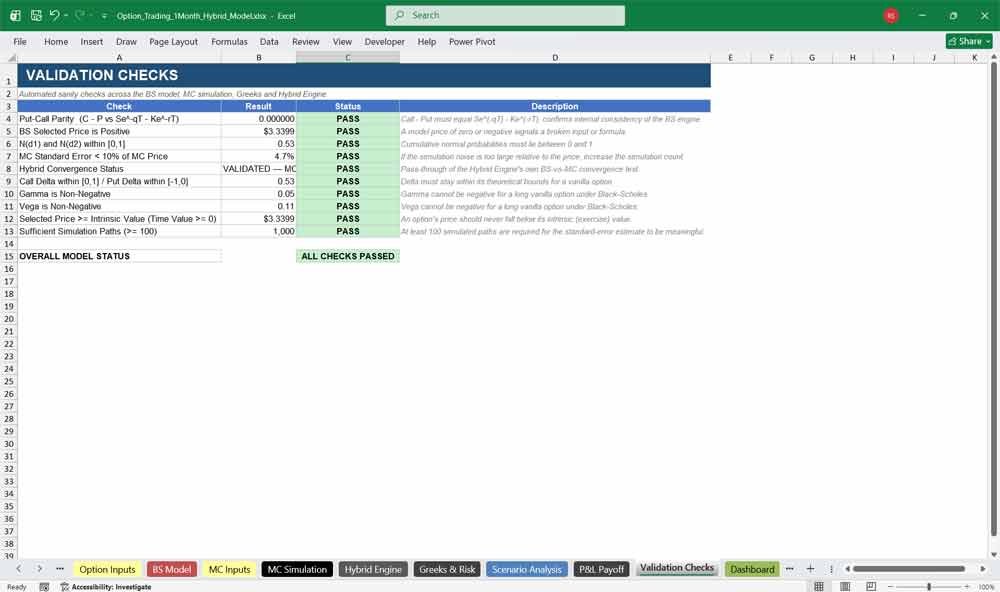
A set of automated sanity checks that run every time the model recalculates: put-call parity, bounds checks on the Greeks and the cumulative normal probabilities, a check that Monte Carlo’s standard error isn’t too large relative to its price estimate, and a pass-through of the Hybrid Engine’s own convergence status. Each check reports Pass, Fail, or Review, and an overall status rolls them all up into a single verdict.
Dashboard
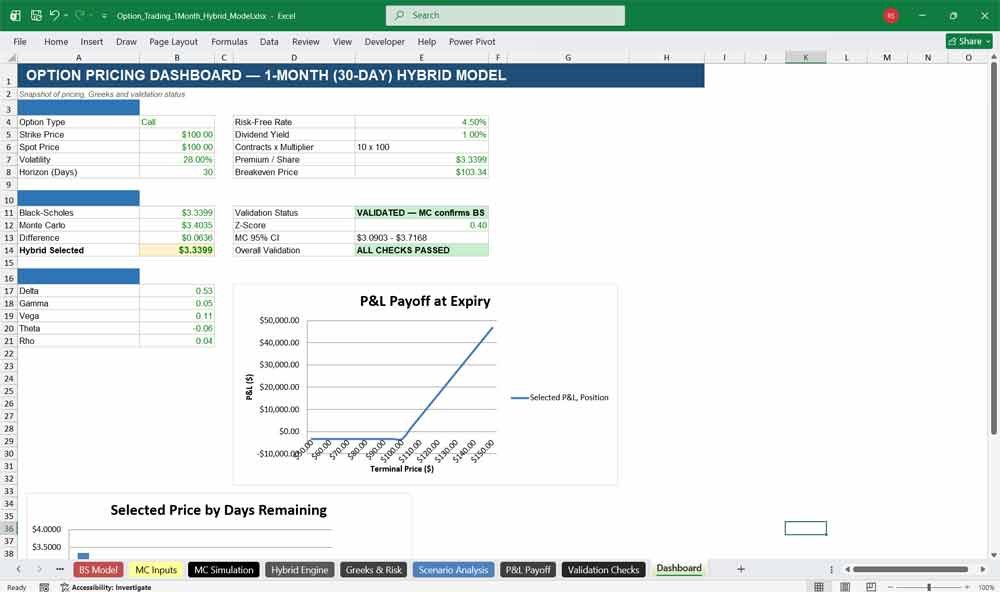
A one-page summary that pulls the contract terms, the Hybrid Engine’s price reconciliation, the selected Greeks, and the overall validation status into a single view, alongside charts of the payoff profile and the time-decay curve — everything a reader needs at a glance, without opening every tab.
Further Reading
Merger & Acquisitions Model: Download a professional M&A financial model. Dynamic valuation, accretion/dilution analysis, synergies, and debt schedules.
- LBO Model: Ready to master corporate finance? Download our proven, step-by-step LBO financial model template to analyze leveraged buyouts, project debt paydown, and forecast returns like a seasoned private equity professional.
- SOTP Model: Download our professional SOTP financial model template. Value multi-segment businesses, run sum-of-the-parts valuations, and analyze joint ventures easily.