
Oil & Gas Cost Models. CAPEX vs OPEX vs Revenue
In this Blog page, “Oil & Gas Cost Models CAPEX vs OPEX vs Revenue”. We’ll cover Performance, dependability, and value: gain the most from oil and gas assets.
Introduction to Oil & Gas Cost Models
At the heart of every strategic decision in the oil and gas industry lies the critical financial framework of cost models, which meticulously categorizes and analyzes Capital Expenditures (CAPEX), Operational Expenditures (OPEX), and revenue. CAPEX represents the substantial upfront investments required to find and develop hydrocarbon reserves, such as drilling wells and building production facilities, which are capitalized as assets on the balance sheet. In contrast, OPEX encompasses the ongoing costs of day-to-day production, including labor, maintenance, and transportation, which are fully expensed in the accounting period they occur. The dynamic interplay between these two cost structures directly dictates a project’s profitability, as the massive initial CAPEX must be efficiently recovered by a stream of revenue that consistently exceeds the long-term tail of OPEX, ultimately determining the economic viability and lifetime value of any oil and gas asset.
Cost models in oil and gas are analytical frameworks used to forecast, estimate, and control costs over a project’s lifecycle.
They integrate technical, economic, and operational data to assess project viability.
Such models are essential for exploration, development, production, and decommissioning phases.
Components of Cost Models
Capital Expenditure (CAPEX): upfront costs for exploration, drilling, facilities, and infrastructure.
Operating Expenditure (OPEX): recurring expenses like labor, maintenance, and energy.
Decommissioning Costs: expenses for safe abandonment of wells and facilities.
Environmental and Regulatory Costs: compliance, carbon pricing, and emissions management.
The Importance of Oil & Gas Cost Modeling
Provides clarity on project feasibility and expected returns.
Helps companies manage risks in volatile markets.
Supports investor confidence by offering transparent forecasts.
Aids in aligning with long-term corporate strategies.
Short-Term Models vs. Long-Term Models
Short-term models (3–5 years): focus on immediate project costs and cash flow.
Medium-term models (5–10 years): useful for operational optimization and expansion planning.
Long-term models (15–20+ years): capture lifecycle costs, macroeconomic cycles, and regulatory shifts.
Benefits of 20-Year Oil & Gas Cost Models for Companies
Strategic Planning: long-term visibility supports capital allocation.
Risk Management: integrates uncertainty in oil prices, taxes, and regulations.
Sustainability Alignment: allows factoring in carbon pricing and ESG requirements.
Asset Lifecycle Management: ensures realistic budgeting for decommissioning.
Financial Benefits of 20-Year Oil & Gas Cost Modeling
Captures the Net Present Value (NPV) and Internal Rate of Return (IRR) over the full project life.
Facilitates sensitivity analysis to test different oil price and cost assumptions.
Provides confidence in debt structuring and project financing.
Enhances merger and acquisition (M&A) valuation accuracy.
Why 20-Year Models Matter
Oil and gas projects often span decades, from exploration to decommissioning.
A 20-year horizon aligns with the natural lifecycle of many upstream assets.
Such models account for market fluctuations, geopolitical changes, and energy transitions.
They provide resilience against short-term market shocks.
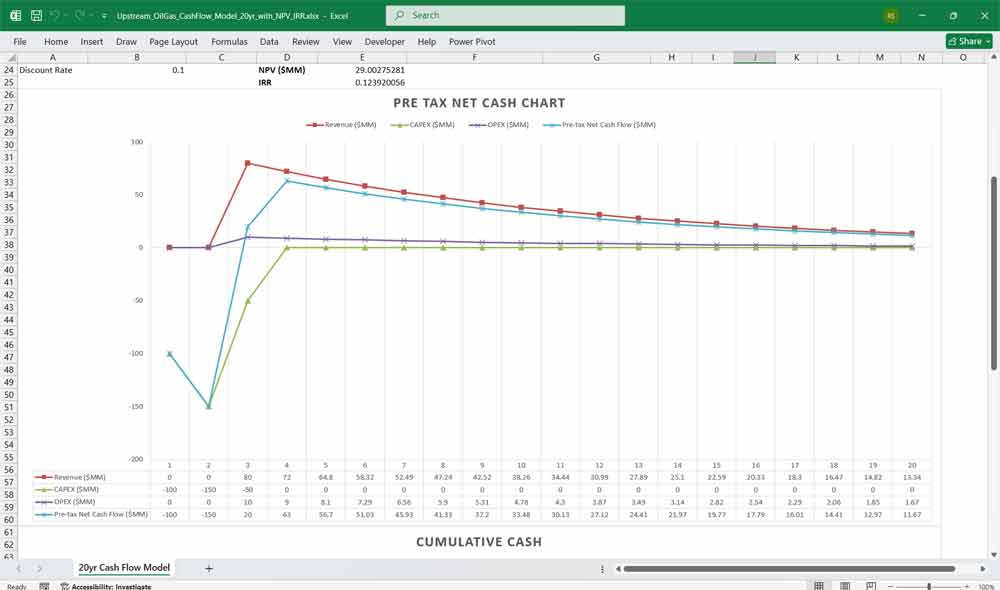
Cumulative Cash Flow calculations Within Oil & Gas Cost Models
Oil Production (MMbbl): The projected volume of oil produced, often based on reservoir engineering models that forecast a rise to a peak followed by a long decline.
Revenue ($MM): Calculated as Production multiplied by the forecasted oil price per barrel, often adjusted for quality, transportation, and other deductions.
CAPEX ($MM): The capital expenditures for that period, which could include costs for new drilling, facility upgrades, or major projects. This is the investment spent to secure future production.
OPEX ($MM): The operating expenditures, representing the ongoing costs to produce the oil, including labor, maintenance, chemicals, and utilities. It is often expressed as a cost per barrel ($/bbl).
Pre-tax Net Cash Flow ($MM): The fundamental measure of periodic profitability, calculated as Revenue minus CAPEX and OPEX. This shows the actual cash generated (or spent) in a given period.
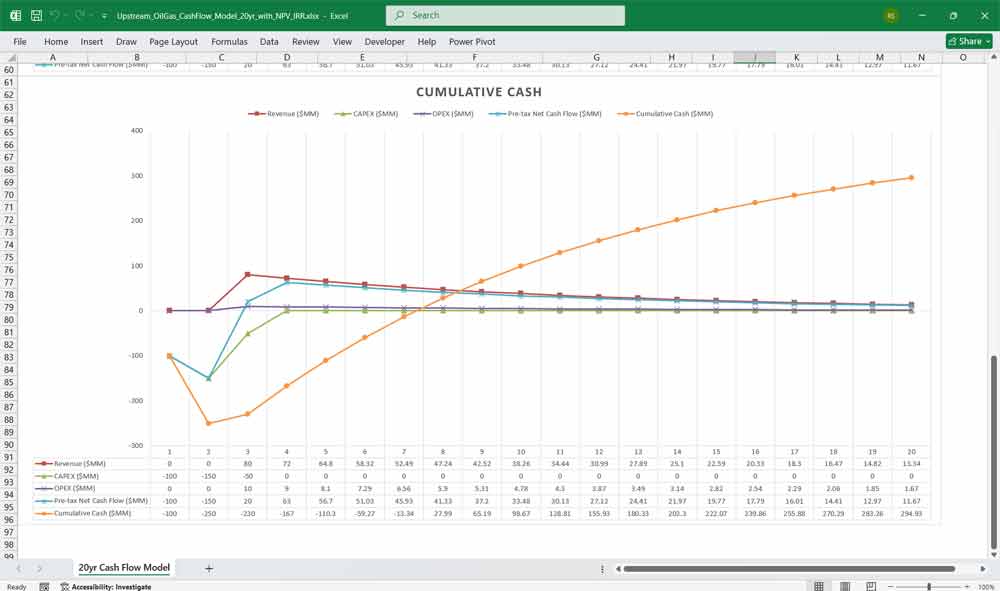
Cumulative Cash ($MM): The running total of the project’s net cash flow from its inception. It starts negative during the high-CAPEX phase and, for a successful project, turns positive, illustrating the point at which the initial investment has been fully paid back.
Download the xls for Production and Cumulative Cash NPV IRR Chart
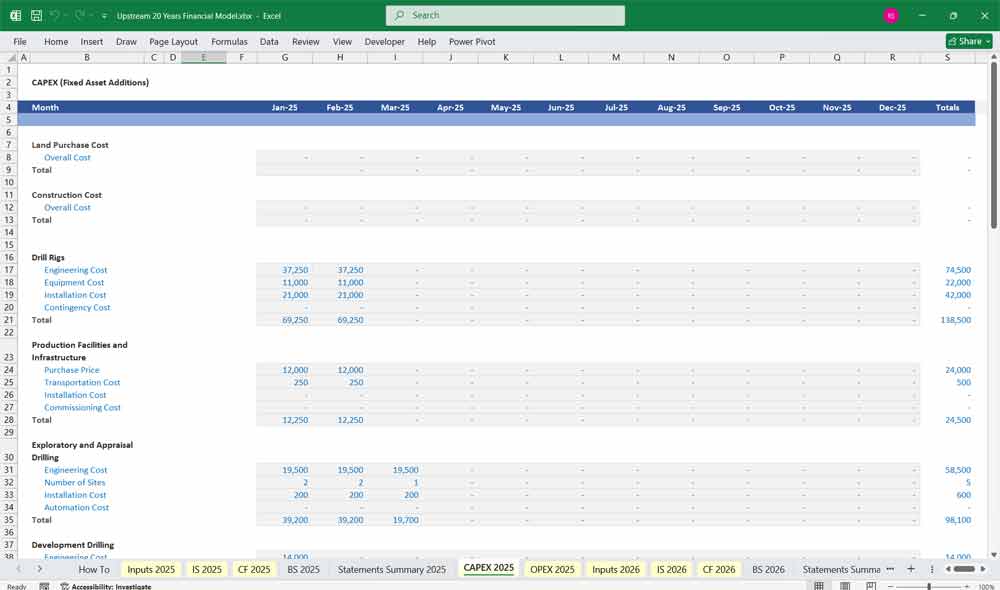
Example: Upstream Oil & Gas Cost Models CAPEX by Lifecycle
1. Exploration Phase (High risk, no revenue yet)
(1) Seismic Surveys & Geological Studies
(2) Exploration Drilling (Wildcat Wells)
2. Appraisal & Development Phase (Confirming commerciality, big capital spend)
(3) Appraisal Drilling
(4) Development Drilling
(5) Well Completions & Stimulation
(6) Subsea Infrastructure (trees, manifolds, umbilicals)
(7) Surface Facilities (processing plants, offshore platforms, FPSOs)
(8) Pipelines & Export Infrastructure
(13) Storage & Tankage
(14) Power Generation & Utilities
3. Production Phase (Revenue generating, sustaining investment)
(9) Workovers & Major Well Interventions (capital in nature)
(11) Reservoir Management Technology (downhole sensors, digital twins)
(12) Enhanced Oil Recovery (EOR) Projects (CO₂, steam, waterflood, etc.)
(15) Health, Safety & Environmental Systems (flare stacks, water treatment, VRUs)
20 Year Financial Models
20 Year models focus on balancing capital expenditures with steady revenue growth. By optimizing operational costs, and power efficiency, and maximizing high-margin services the models ensure sustainable profitability and cash flow stability.