
LNG Terminal DCF Financial Model (2026 Excel)
20 Year 3 Statement LNG Terminal DCF Financial Model (2026 Excel) covering the Income Statement, Cash Flow Statement, and Balance Sheet. Cost structures, financial statements, Discounted Cash Flow (DCF) with Terminal Value, Sensitivity Analysis, and WACC, to forecast the financial health of your terminal’s operations.
DCF Financial Model For An LNG Terminal
A very detailed Financial Model for an LNG Terminal (150 Excel Tab Workbook) used to assess the financial viability, performance, and risks associated with an LNG (Liquefied Natural Gas) terminal project. It integrates various financial, operational, and market assumptions into structured financial statements: the Income Statement, Cash Flow Statement, and Balance Sheets. 20x Income Statements, Cash Flow Statements, Balance Sheets, CAPEX Sheets, OPEX Sheets, Statement Summary Sheets, and Revenue Forecasting Charts with the specified revenue streams, BEA charts, sales summary charts, employee salary tabs and expenses sheets.
Downstream Refinery Model, Midstream Storage, Upstream.
Assumptions and Inputs
- Market Assumptions:
- LNG prices (Henry Hub, JKM, Brent-linked, etc.)
- Exchange rates, inflation rates, and discount rates.
- Operational Assumptions:
- Terminal capacity (e.g., MMTPA – Million Metric Tons Per Annum)
- Utilization rates and boil-off rates.
- Start date, ramp-up period, and lifespan.
- Revenue Assumptions:
- Long-term contracts (take-or-pay clauses).
- Spot market sales volume and price.
- Cost Assumptions:
- Operating & Maintenance (O&M) expenses.
- Shipping and regasification costs.
- Financing Assumptions:
- Debt-to-equity ratio.
- Interest rates, loan tenure, and repayment structure.
- Tax and Depreciation Assumptions:
- Corporate tax rate.
- Depreciation method (straight-line, declining balance, etc.).
Some Inputs Used In The Model
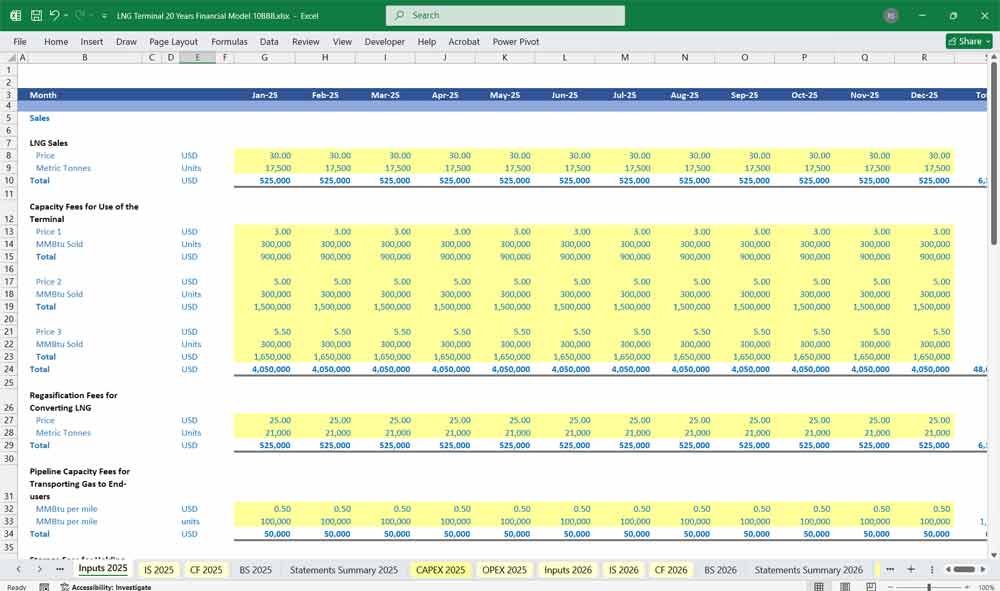
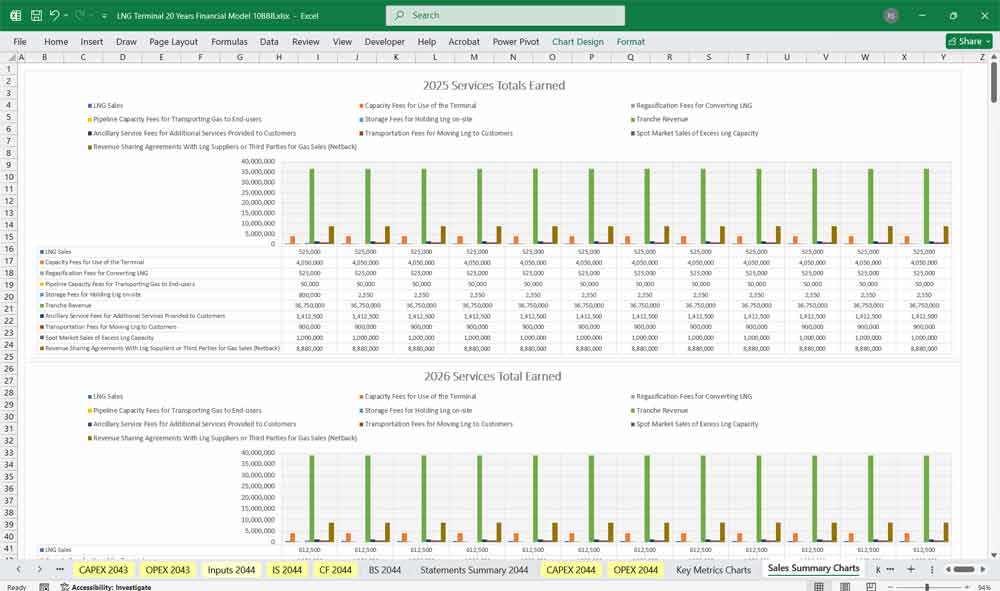
- LNG Sales
- Capacity Fees for Use of the Terminal
- Regasification Fees for Converting LNG
- Pipeline Capacity Fees for Transporting Gas to End-users
- Storage Fees for Holding LNG on-site
- Tranche Revenue
- Ancillary Service Fees for Additional Services Provided to Customers
- Gas Quality Adjustment (Custom Blending)
- High-Priority Berthing
- Custom Send-Out Scheduling
- Truck/Loading Bay Services
- Helium or NGL Extraction
- Transportation Fees for Moving LNG to Customers
- Spot Market Sales of Excess LNG Capacity
- Revenue Sharing Agreements With LNG Suppliers or Third Parties for Gas Sales (Netback)
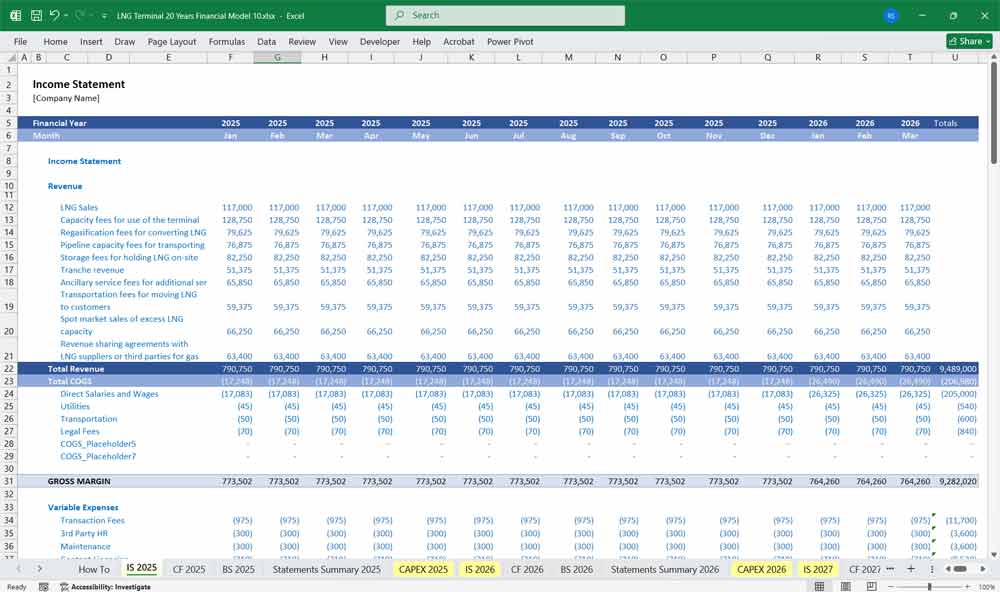
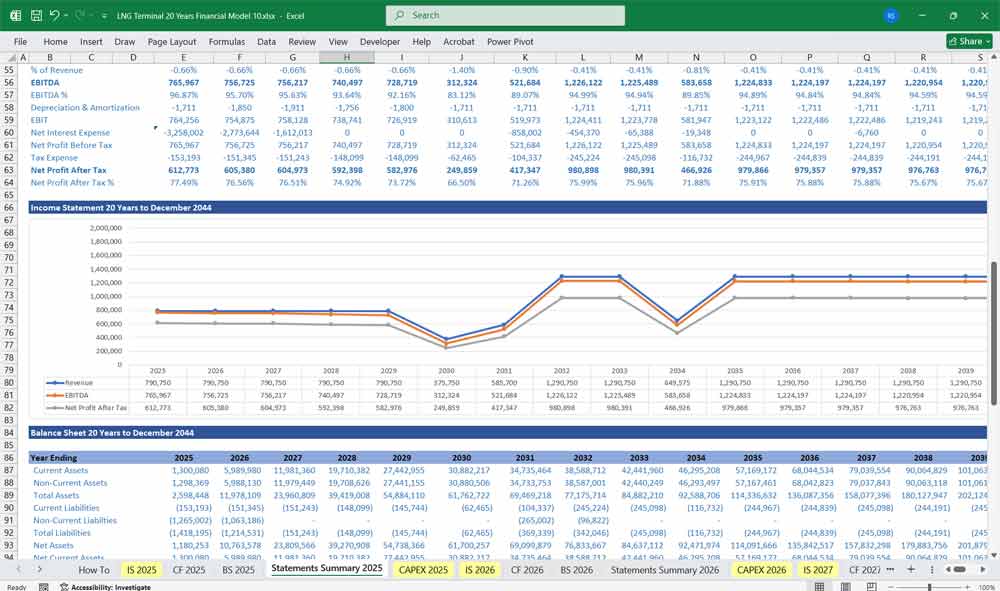
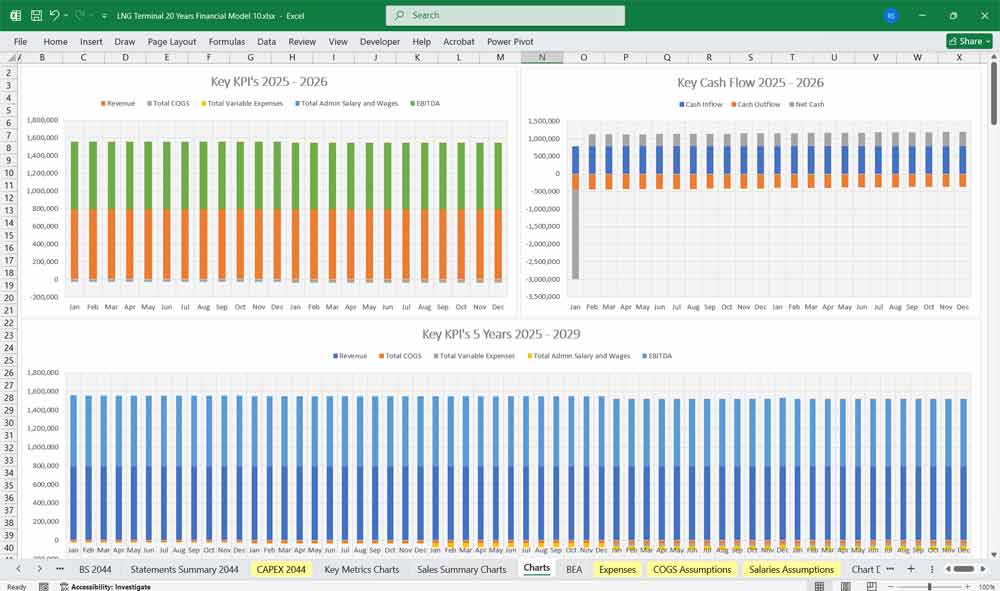
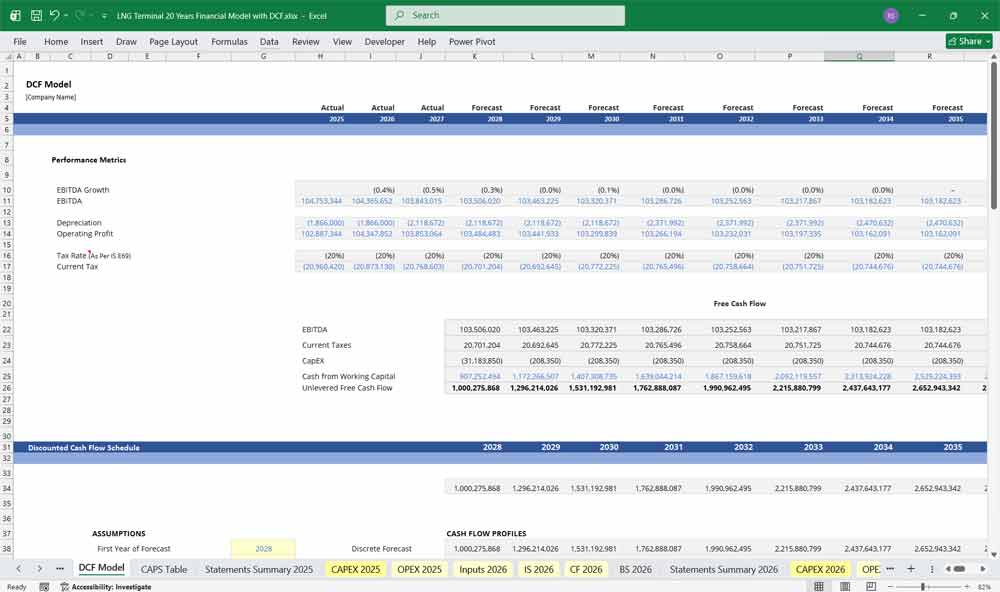
Income Statement (Profit and Loss Statement)
Revenues:
- Regasification Fees: Revenue from long-term contracts with off-takers.
- Throughput Charges: Fees based on volume processed through the terminal.
- Spot Sales: Revenue from excess capacity sold on the spot market.
- Other Income: Ancillary services, such as storage and bunkering fees.
Cost of Sales:
- LNG Procurement Cost: If applicable, for terminals that procure LNG.
- Shipping Costs: Freight charges for LNG carriers.
- Handling Costs: Costs related to unloading, storing, and regasifying LNG.
Gross Profit = Revenue – Cost of Sales
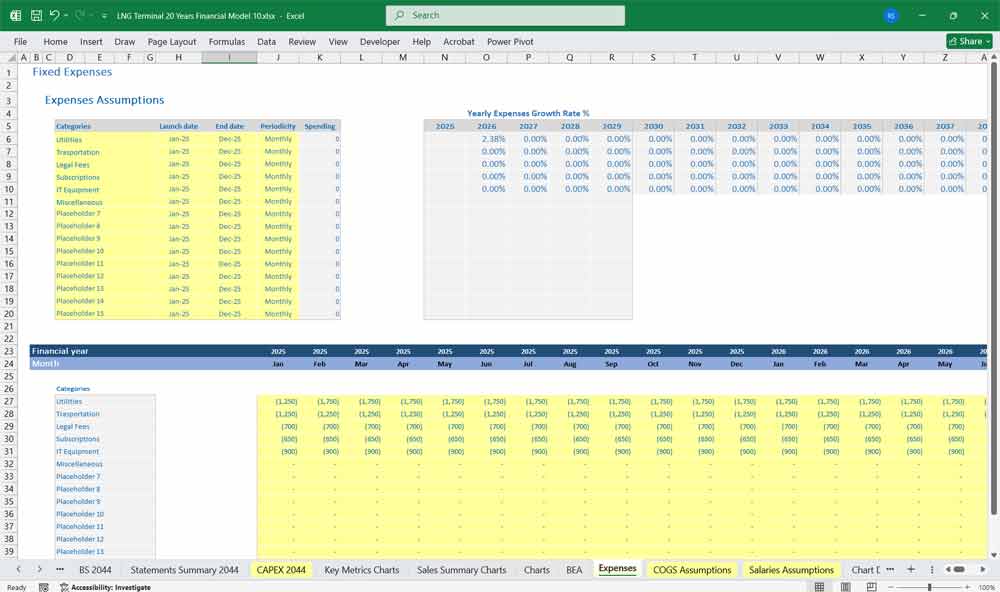
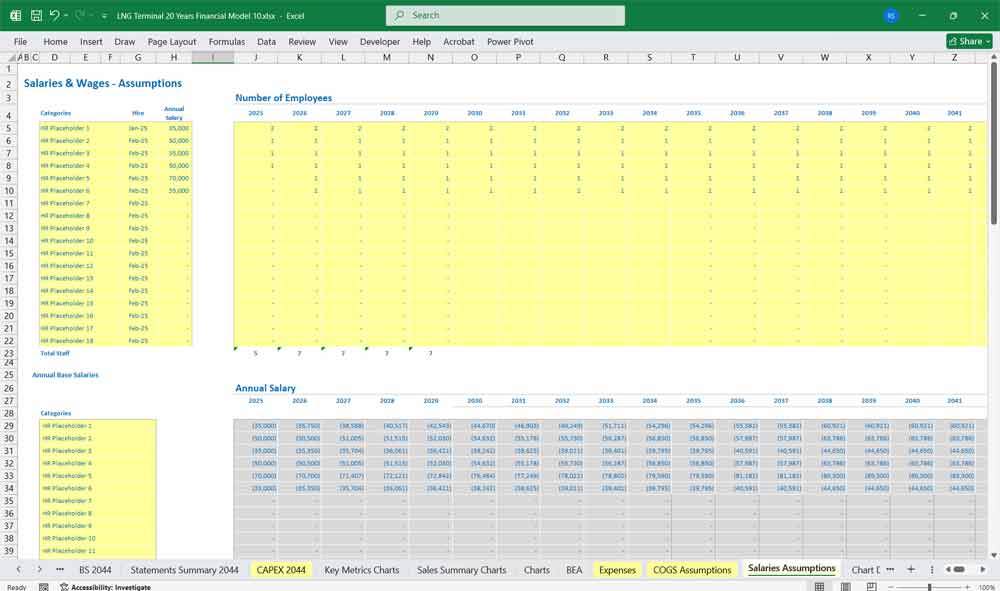
Operating Expenses:
- Operations and Maintenance (O&M) Costs: Labor, spare parts, and inspections.
- Administrative Expenses: Salaries, office expenses, and IT systems.
- Insurance Premiums: Coverage for facilities, ships, and environmental risks.
EBITDA (Earnings Before Interest, Taxes, Depreciation, and Amortization) = Gross Profit – Operating Expenses
Depreciation and Amortization:
- Depreciation of plant, pipelines, and storage tanks.
EBIT (Earnings Before Interest and Taxes) = EBITDA – Depreciation and Amortization
Interest Expense:
- Interest payments on loans and bonds.
Profit Before Tax (PBT) = EBIT – Interest Expense
Taxes:
- Corporate income tax and deferred taxes.
Net Profit = PBT – Taxes
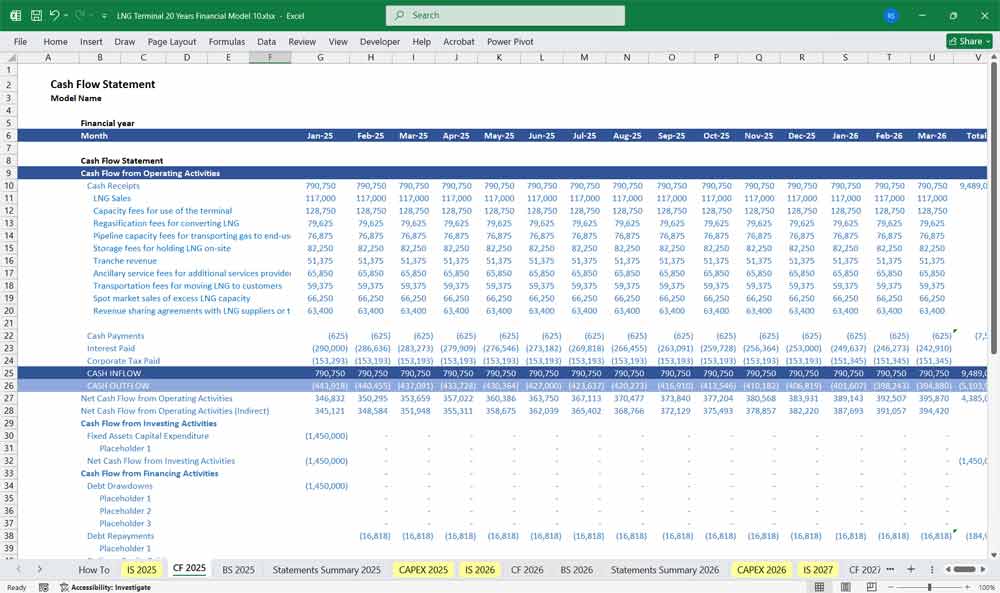
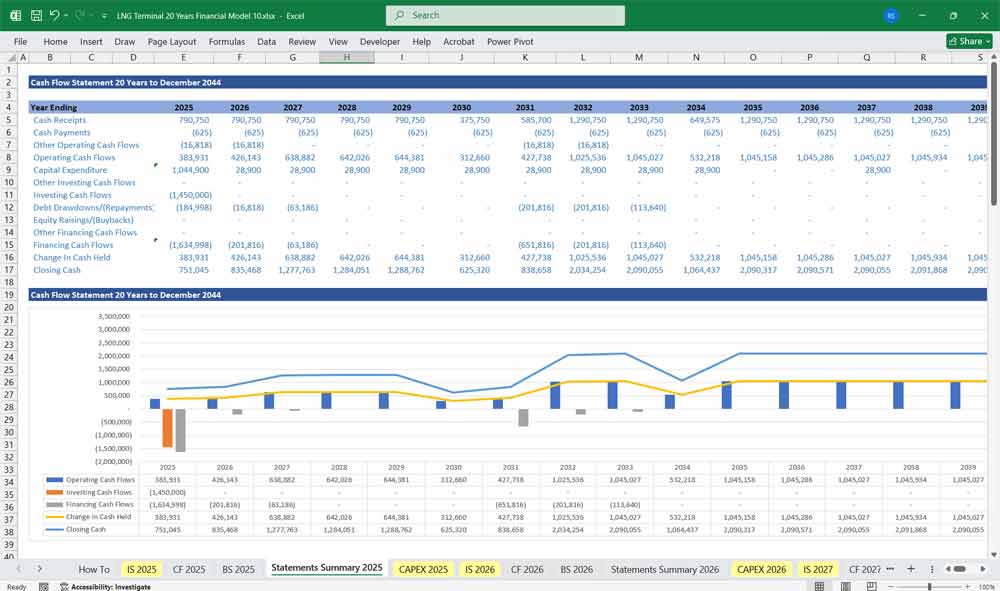
LNG Terminal Cash Flow Statement
Operating Cash Flow:
- Cash Inflows:
- Receipts from long-term contracts and spot sales.
- Cash Outflows:
- Payments for LNG purchases.
- O&M costs and administrative expenses.
- Taxes paid.
Net Operating Cash Flow = Inflows – Outflows
Investing Cash Flow:
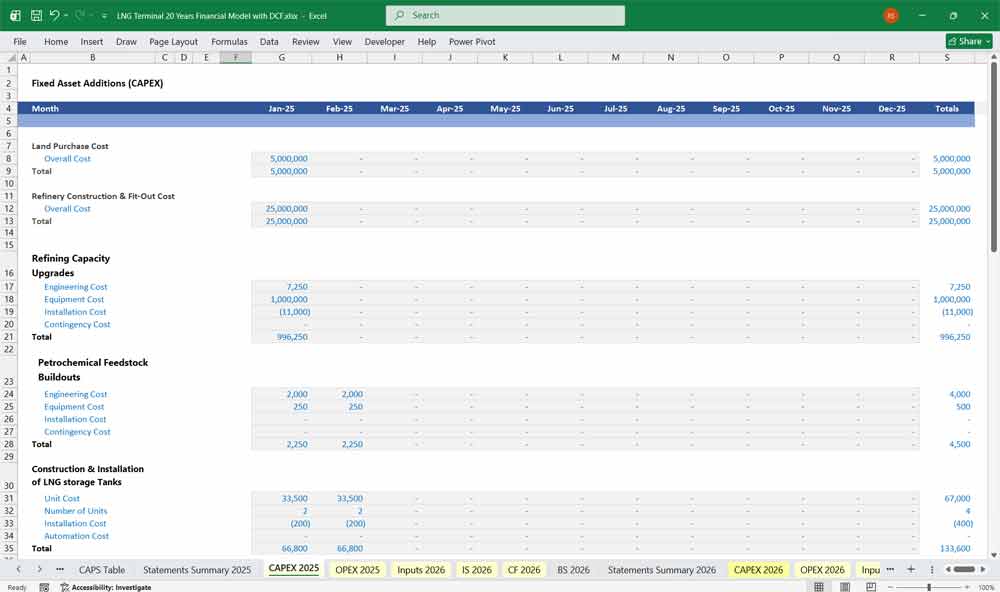
- Capital Expenditures (CapEx):
- Initial construction of the terminal and pipelines.
- Expansion projects and upgrades.
- Asset Sales:
- Proceeds from selling old equipment.
Net Investing Cash Flow = CapEx – Asset Sales
Financing Cash Flow:
- Cash Inflows:
- Proceeds from debt issuance and equity contributions.
- Cash Outflows:
- Debt repayments and dividend payments.
- Interest payments.
Net Financing Cash Flow = Inflows – Outflows
Net Cash Flow = Operating Cash Flow + Investing Cash Flow + Financing Cash Flow
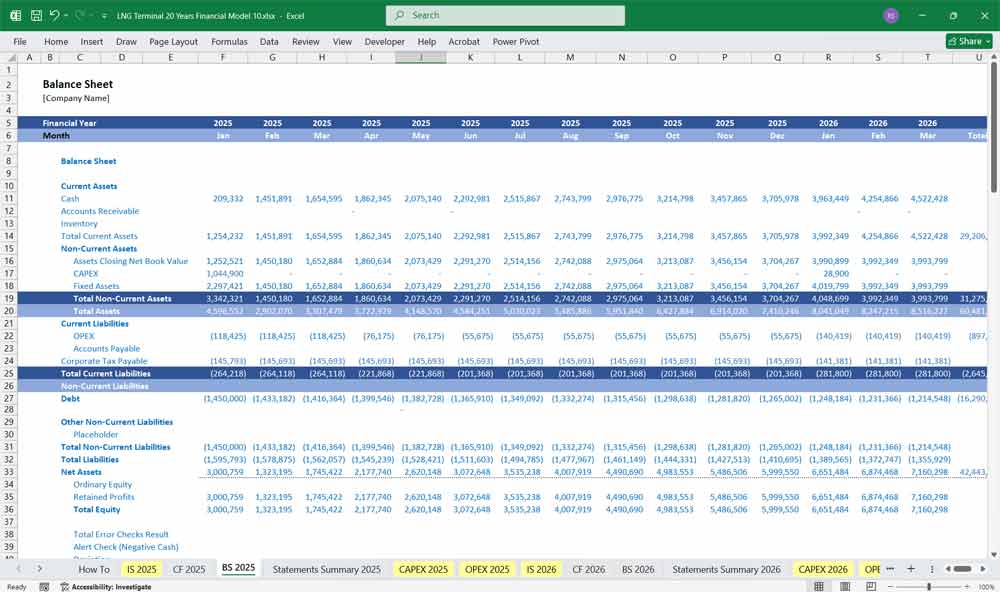
LNG Terminal Balance Sheet
Assets:
Current Assets:
- Cash and Cash Equivalents.
- Accounts Receivable (from off-takers).
- LNG Inventory.
Non-Current Assets:
- Property, Plant, and Equipment (PP&E): Storage tanks, pipelines, jetties.
- Intangible Assets: Licenses, permits, and development costs.
- Deferred Tax Assets.
Liabilities:
Current Liabilities:
- Accounts Payable (for LNG suppliers, contractors).
- Short-term Debt and Interest Payable.
Non-Current Liabilities:
- Long-term Debt (bonds, loans).
- Deferred Tax Liabilities.
Equity:
- Contributed Capital: Initial equity injections.
- Retained Earnings: Accumulated profits.
- Reserves: Contingency and maintenance reserves.
Balance Sheet Equation:
Assets = Liabilities + Equity
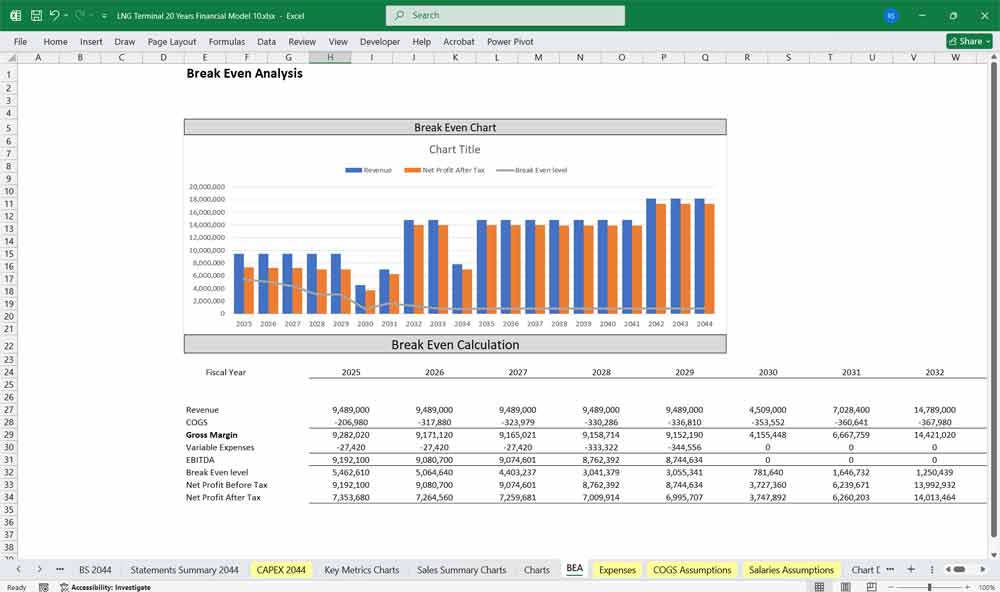
Key Financial Metrics For An LNG Terminal
- Net Present Value (NPV): Evaluates project profitability.
- Internal Rate of Return (IRR): Measures project return.
- Debt Service Coverage Ratio (DSCR): Assesses debt repayment capacity.
- Payback Period: Time to recover the initial investment.
Benefits Of A 20-Year DCF Model for an LNG Terminal
It provides a comprehensive, long-term perspective essential for a capital-intensive project. It’s not just about short-term viability; it’s about projecting returns over the entire operational life of the asset. This extended time horizon is crucial for capturing the terminal’s full revenue potential, which typically comes from long-term, take-or-pay contracts. It allows investors and lenders to confidently assess the project’s ability to service debt, provide a return on equity, and manage risks over several economic cycles.
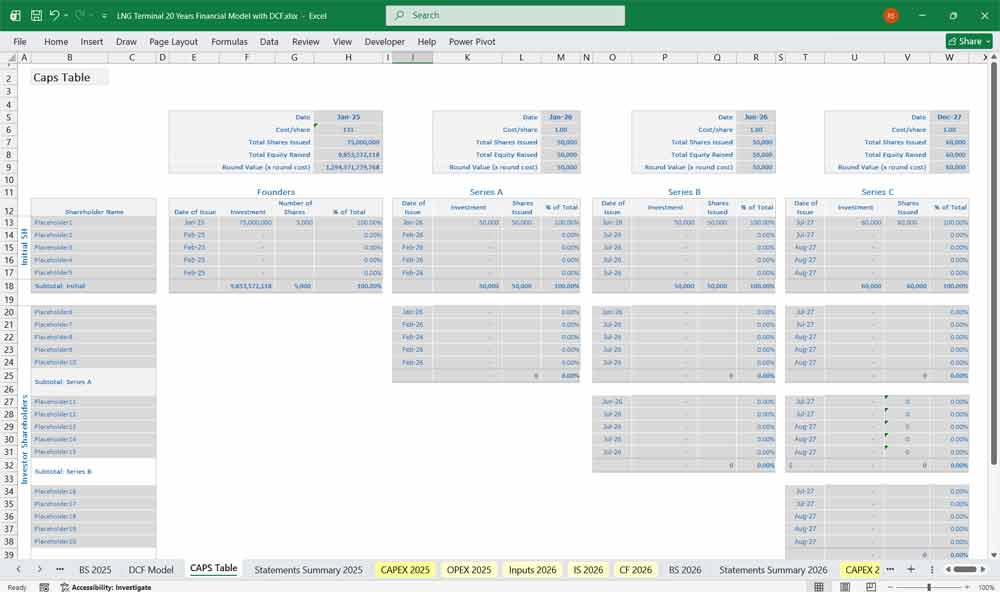
LNG Terminal Debt Structuring and Financing.
Given the immense upfront capital expenditure (CapEx) to build an LNG terminal, projects are almost always financed with a high proportion of debt. Lenders require a detailed 20-year financial forecast to stress-test the project’s cash flows against various market scenarios, including fluctuations in gas prices and operational uptime. The model’s ability to demonstrate a healthy Debt Service Coverage Ratio (DSCR) over the entire loan term is a key factor in securing project financing at favourable terms. It provides the necessary transparency and confidence for financial institutions to commit billions of pounds.
Long-Term LNG Terminal Profitability And Valuation Analysis
LNG terminals are assets with lifespans of 25 to 40 years. A shorter model would fail to capture the terminal’s full earnings potential, especially in later years when debt is reduced and cash flows become stronger. By projecting revenues and costs over two decades, the model can accurately calculate key valuation metrics like Net Present Value (NPV) and Internal Rate of Return (IRR). This allows for informed investment decisions, helping investors determine if the project’s risk-adjusted return is attractive enough.
Better LNG Terminal Risk Management
The extended forecast horizon also enables robust risk management and sensitivity analysis. A 20-year model allows for the detailed examination of how various long-term risks—such as changing gas market dynamics, regulatory shifts, and major maintenance cycles—will impact the terminal’s financials. Modellers can run scenarios to see the effects of a lower gas price environment, a change in liquefaction tolls, or an unscheduled outage in year 15. This forward-looking risk assessment is invaluable for developing mitigation strategies and ensuring the project’s resilience.
20 Years of Strategic Planning for Your LNG Terminal
A 20-Year model provides management with a clear roadmap for the terminal’s future. It can be used to plan for major maintenance CapEx, such as a full plant overhaul, or to model potential expansion projects in the future. By forecasting the company’s financial position, it helps management make informed decisions on dividend policy, capital allocation, and long-term operational strategies. It transforms a complex, multi-decade project into a manageable and transparent financial plan.
Financial Planning and Investment
Financial planning and investment are crucial for the successful development and operation of an LNG terminal, ensuring long-term profitability and sustainability. This process involves creating detailed capital expenditure (CAPEX) budgets to cover infrastructure, equipment, and construction costs, alongside forecasting operational expenses (OPEX) for ongoing maintenance and staffing. Various financing models, such as public-private partnerships (PPP), bonds, or equity financing, are explored to secure the necessary funds. Comprehensive risk assessments are conducted to identify potential financial pitfalls, including market volatility and regulatory changes, allowing for the implementation of appropriate insurance and hedging strategies. Additionally, revenue forecasting and cost-benefit analyses help in evaluating the project’s economic viability, while continuous financial monitoring ensures alignment with the terminal’s commercial strategy and market demands. Effective financial planning is fundamental to attracting investors, maintaining cash flow, and ensuring the terminal’s competitiveness in a dynamic global energy market.
Valuing Your LNG Terminal With A Discounted Cash Flow (DCF)
DCF for an LNG Terminal
An LNG terminal—whether an import (regasification) or export (liquefaction) facility—represents one of the most capital-intensive infrastructure assets in the energy value chain, with project costs often running into the billions of dollars. The DCF analysis for such a terminal aligns with the long-term tolling agreements or sale and purchase agreements (SPAs) that underpin the project’s revenue profile. For liquefaction terminals, cash flows are driven by liquefaction tolling fees (typically $2.00–$3.50 per MMBtu) applied to nameplate capacity, while regasification terminals earn throughput or storage fees based on contracted send-out volumes. Terminal value is often treated conservatively—sometimes assuming zero residual value beyond the contract period—or calculated using a stabilized EBITDA multiple reflecting the remaining economic life and recontracting potential.
WACC for an LNG Terminal
The weighted average cost of capital for an LNG terminal is uniquely complex, reflecting its multi-phase risk profile across construction, commissioning, and operations. During the development and construction phase, the WACC is effectively irrelevant as no cash flows exist; instead, the focus is on the blended cost of project finance debt and sponsor equity that will apply once commercial operations commence. LNG terminals are typically financed with 60%–80% non-recourse or limited-recourse debt, with interest rates ranging from LIBOR/SOFR + 200–400 basis points depending on offtaker credit quality and host country risk. The cost of equity—often 12%–18% for greenfield LNG projects—reflects construction execution risk, geopolitical considerations, and long-term commodity price exposure, even for tolling models. For operating terminals with long-term contracts, the post-COD WACC may compress significantly, approaching midstream infrastructure levels of 6%–9%, though this remains highly sensitive to contract tenor and counterparty creditworthiness.
Sensitivity Analysis for an LNG Terminal
Sensitivity analysis for LNG terminal valuation is uniquely critical given the multi-billion dollar stakes, multi-year construction timelines, and exposure to global energy markets. The analysis typically centers on three interconnected variable categories: commercial, operational, and macroeconomic. Commercial sensitivities test the impact of lower-than-anticipated utilization rates, contract rollover pricing assumptions, and counterparty default scenarios. Macroeconomic sensitivities stress-test the discount rate (reflecting interest rate and country risk movements), long-term oil and gas price assumptions (which influence SPA pricing formulas), and foreign exchange rates for terminals with revenues in USD but costs in local currency.
Final Notes on the Financial Model
- Interdependencies: Cash flow projections directly influence the income statement and balance sheet through interest income, reserves, and tranche payments.
- Scenario Analysis: Embedded functionality to test various market assumptions like property value depreciation, default rates, and interest rate spikes.
- Investor Reporting: Schedules for interest/principal payouts and performance updates tailored to tranche type
This structure helps the LNG Terminal Financial Model address a broad market spectrum, offering the right balance between cost, production capacity, support, and customization at each subscription level.
Download Link On Next Page
Download Link On Next Page