
Financial Model for Investment Holding Company, NAV, Liquidity & Capital Allocation
This Investment Holding Company Financial Model is a fully dynamic, 15-tab Excel template built for NAV analysis, liquidity forecasting, capital allocation planning, and shareholder distribution modeling. Designed for holding companies, permanent capital vehicles, family offices, and private equity platforms, this financial model template combines three years of historical detail, a trailing-twelve-month LTM column, and a ten-year forecast horizon in one fully linked Excel workbook — so you can model NAV growth, liquidity runway, and capital allocation with the rigor of an institutional portfolio management team.
10-Year financial model for an Investment Holding Company
At the core of this Excel financial model is a continuous capital allocation engine that answers one question every forecast period: given current NAV and available liquidity, how much capital can be deployed, where should it go, and how much can safely be distributed to shareholders? The model follows a clear architecture — Portfolio Value flows into NAV, NAV drives Liquidity, Liquidity funds Capital Allocation, and Capital Allocation determines Distributions and Ending NAV — with a rolling 36-month monthly liquidity model layered underneath the annual forecast for granular near-term cash planning.
Every formula in this investment holding company model is fully dynamic: change the model start date once, and every year, month, and date label across all 15 tabs updates automatically. A three-stage forecasting structure — detailed, medium-detail, and strategic long-term — drives Years 1 through 10, while color-coded inputs, formulas, and cross-tab links, plus a dedicated Checks tab with built-in balance sheet, NAV, and cash flow tie-outs, make this Excel template audit-ready, lender-ready, and easy to customize for your own portfolio.
Investment Model Tab-by-Tab Guide + Highlights
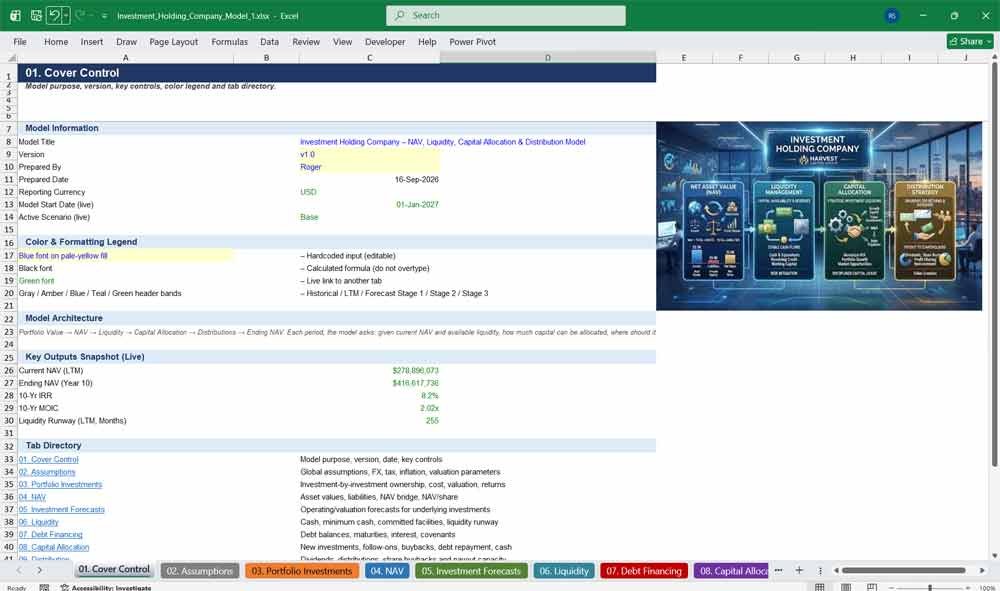
01. Cover Control
The Cover Control tab is the command center of this Excel financial model, summarizing model purpose, version control, prepared-by details, and live key outputs. It includes a full color-coding legend and a hyperlinked tab directory, giving buyers instant navigation across this investment holding company NAV model.
- Live-linked snapshot of current NAV, ending NAV, IRR, MOIC, and liquidity runway
- Full color-coding legend for inputs, formulas, and cross-tab links
- Hyperlinked directory to all 15 tabs for fast navigation
- Version control and model metadata fields for audit trails
02. Assumptions
The Assumptions tab centralizes every driver of this financial model — inflation, tax, FX, valuation multiples, growth rates, liquidity policy, and capital allocation rules. One Model Start Date and a Base, Upside, Downside, and Stress scenario selector re-flex the entire ten-year forecast instantly, ideal for scenario planning.
- One Model Start Date drives every date across all 15 tabs automatically
- Base, Upside, Downside, and Stress scenario selector with adjustment factor table
- Centralized inflation, tax, FX, and valuation multiple assumptions
- Liquidity, capital allocation, and distribution policy controls in one place
Investment Holding Company NAV & Forecasts
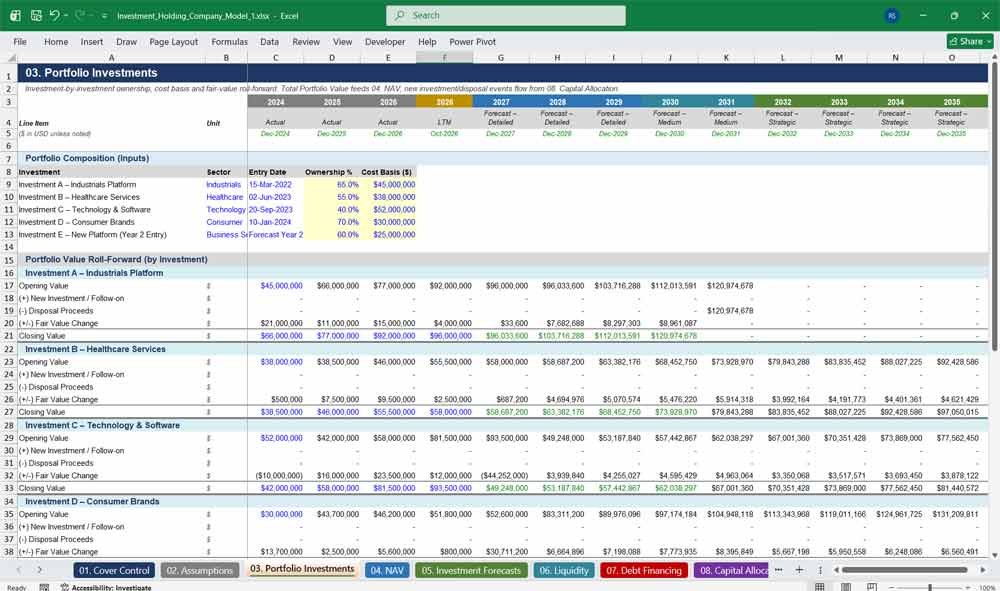
03. Portfolio Investments
The Portfolio Investments tab tracks ownership percentage, cost basis, and fair-value roll-forward for each holding, plus a follow-on capital pool. New investments, disposals, and fair value changes flow automatically into NAV, giving buyers a realistic, editable portfolio structure for any private equity model.
- Investment-by-investment ownership, cost basis, and entry date tracking
- Opening-to-closing fair value roll-forward for every holding
- Built-in new investment, follow-on, and disposal event modeling
- Aggregated follow-on capital pool for ongoing portfolio recycling
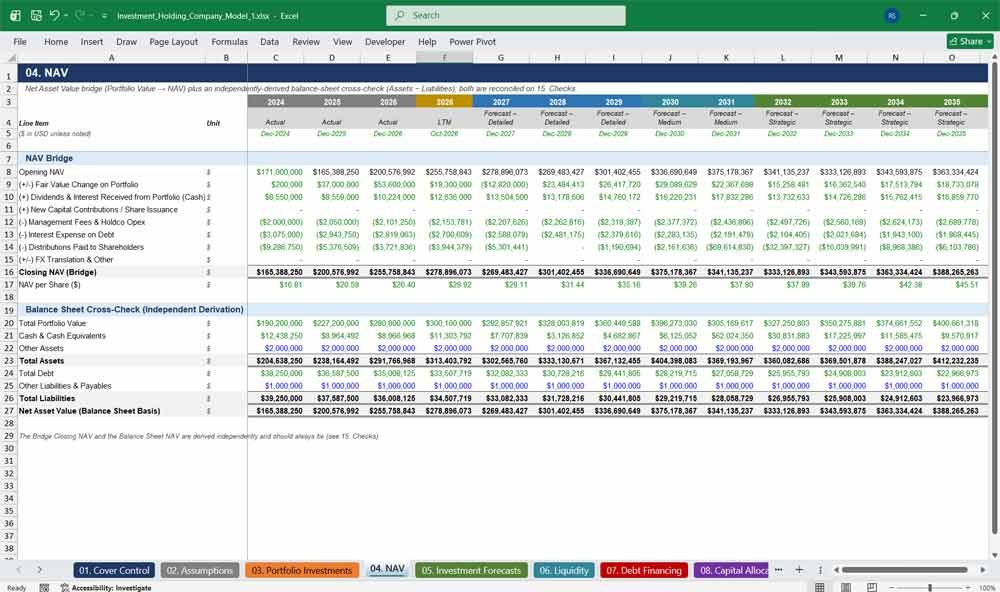
04. NAV
The NAV tab delivers a full net asset value bridge — fair value changes, dividends received, fees, interest, and distributions — alongside an independently calculated balance sheet cross-check. This dual-calculation design lets buyers verify NAV-per-share accuracy, a critical feature for any holding company valuation model.
- Complete NAV bridge from opening to closing NAV per period
- Independent balance sheet cross-check (Assets minus Liabilities) for tie-out accuracy
- Automated NAV-per-share calculation for shareholder reporting
- Fully linked to Portfolio, Liquidity, Debt, and Distribution tabs
05. Investment Forecasts
Investment Forecasts models revenue, EBITDA margin, and exit multiples for each portfolio company across a detailed and medium-term horizon, then shifts to a strategic long-term growth rate for later years. This tiered approach mirrors how professional investment teams build multi-year Excel valuation projections.
- Company-level revenue, EBITDA margin, and multiple-based valuation build
- Three-stage forecast: detailed, medium-detail, and strategic long-term growth
- Attributable equity value flows automatically into Portfolio Investments
- Fully editable growth and multiple assumptions per scenario
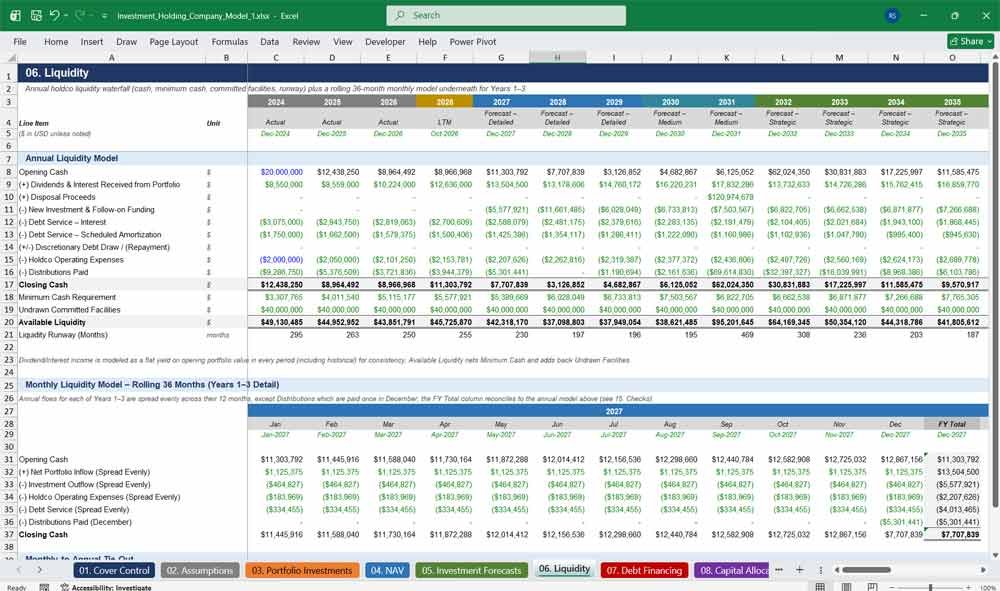
06. Liquidity
The Liquidity tab combines an annual cash waterfall with a rolling 36-month monthly liquidity model, tracking minimum cash, committed facilities, and runway in months. This dual-frequency structure makes it one of the most detailed liquidity forecasting templates available for holding companies in Excel.
- Annual liquidity waterfall plus a rolling 36-month monthly cash model
- Minimum cash requirement and undrawn committed facility tracking
- Automated liquidity runway calculation in months
- Monthly-to-annual reconciliation built directly into the model
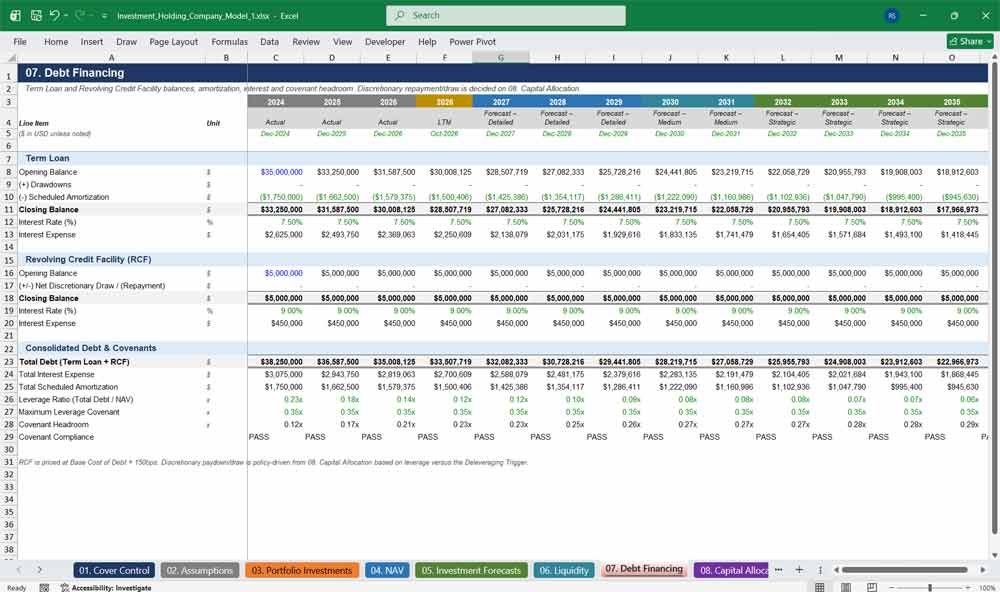
07. Debt Financing
Debt Financing models a Term Loan and Revolving Credit Facility with amortization schedules, interest expense, and leverage covenant compliance. Buyers get a ready-built debt schedule that automatically flags covenant breaches, making this Excel model practical for leveraged holding companies and permanent capital vehicles.
- Term Loan and Revolving Credit Facility balances, draws, and repayments
- Automated interest expense and scheduled amortization calculations
- Live leverage ratio versus maximum covenant with breach flags
- Discretionary debt paydown linked directly to Capital Allocation
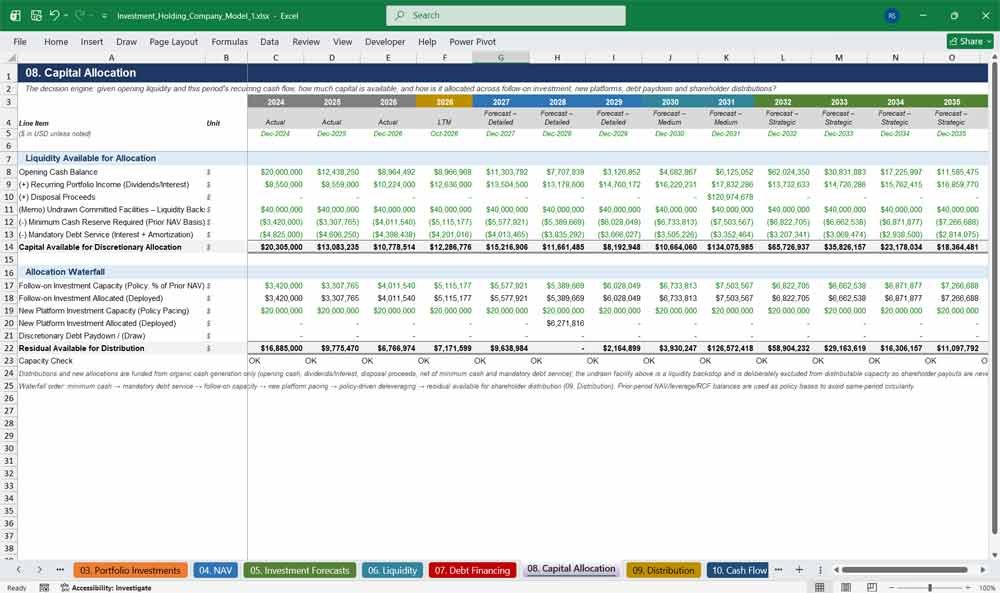
08. Capital Allocation
Capital Allocation is the decision engine of this financial model, converting available liquidity into a clear waterfall across follow-on investments, new platform deals, debt paydown, and shareholder distributions. This tab is the standout feature for buyers who need a true capital allocation model.
- Full capital allocation waterfall from available liquidity to residual distribution
- Follow-on investment and new platform capacity policy-driven caps
- Automatic capacity check flags insufficient-liquidity periods
- Directly funds Portfolio Investments, Debt Financing, and Distribution tabs
Investment Holding Company Cash Flow Model
09. Distribution
The Distribution tab calculates dividend and buyback capacity, dividend per share, and shares outstanding roll-forward based on residual capital from the allocation waterfall. Payout ratio and distribution yield are fully automated, giving buyers a realistic shareholder return engine inside this holding company model.
- Dividend and share buyback split with automated per-share calculations
- Shares outstanding roll-forward including buyback-driven share count reduction
- Distribution yield and payout ratio tracked every period
- Distribution capacity capped automatically by Capital Allocation residual
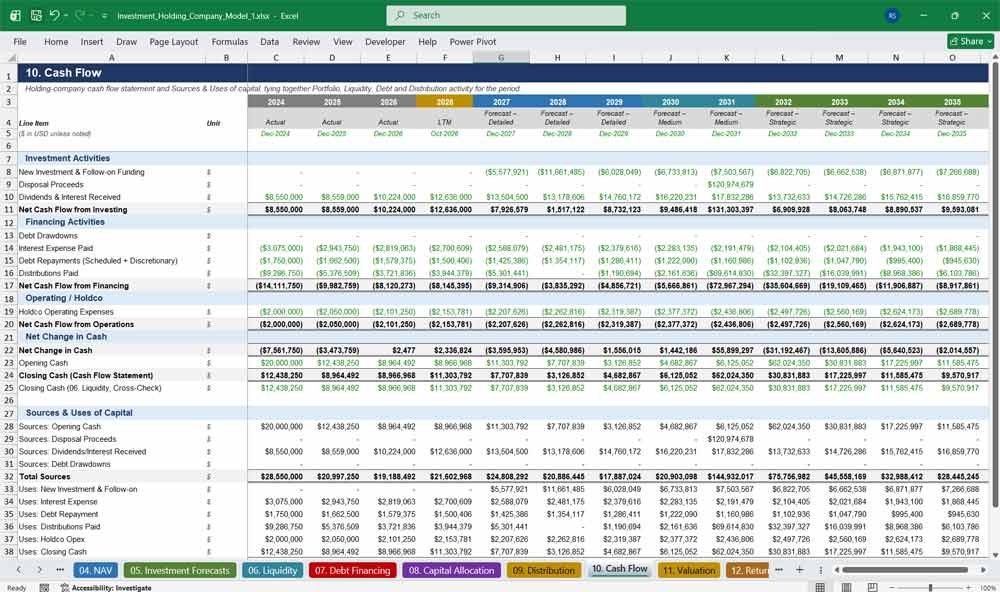
10. Cash Flow
Cash Flow presents a full holding-company cash flow statement alongside a Sources and Uses summary, reconciling investing, financing, and operating activity every period. This tab gives buyers a lender-ready cash flow view that ties precisely to the Liquidity tab, with zero manual reconciliation required.
- Complete investing, financing, and operating cash flow statement
- Sources and Uses of capital summary for every forecast period
- Automatic reconciliation to the Liquidity tab’s closing cash
- Built for lender, investor, and audit-ready presentation
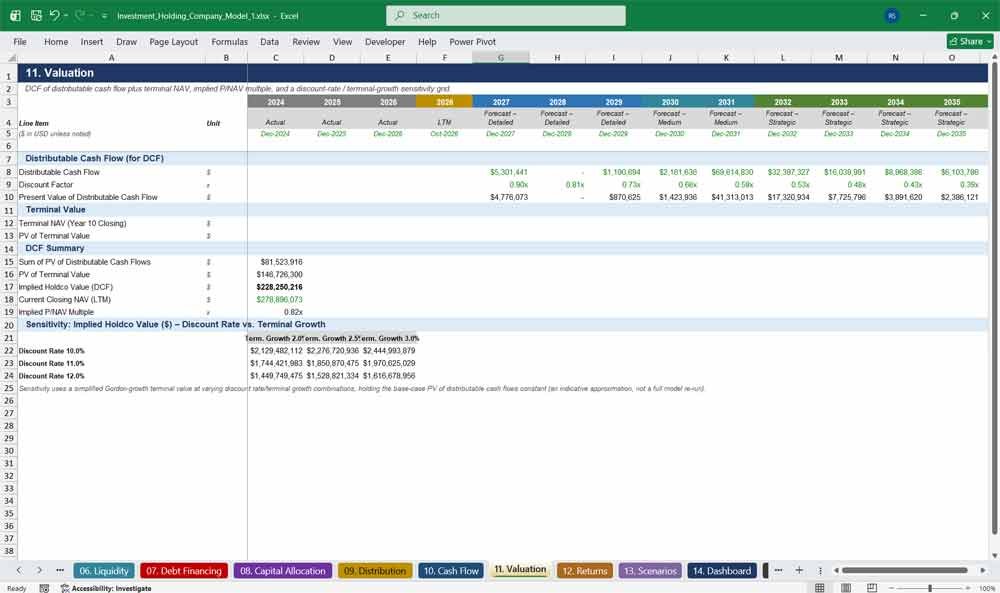
11. Valuation
The Valuation tab runs a discounted cash flow analysis on distributable cash flow plus terminal NAV, calculating implied holdco value and an implied P/NAV multiple. A built-in discount-rate and terminal-growth sensitivity grid gives buyers instant scenario testing for valuation assumptions in this Excel model.
- Full DCF of distributable cash flow plus terminal value
- Implied holding company value and P/NAV multiple output
- Discount rate versus terminal growth sensitivity grid
- Fully linked to live Assumptions and NAV tabs
12. Returns
Returns calculates IRR, MOIC, TSR, and NAV CAGR from a shareholder perspective using XIRR-based cash flow analysis across the ten-year forecast. Per-share value creation, combining NAV growth and cumulative dividends, gives buyers a complete shareholder return summary for this holding company model.
- IRR (XIRR), MOIC, and TSR calculated from real forecast cash flows
- NAV CAGR from LTM through Year 10
- Per-share total value creation combining NAV and dividends
- Automatically updates with any scenario or assumption change
Investments Holding Scenarios
13. Scenarios
Scenarios lets buyers toggle Base, Upside, Downside, and Stress cases from a single dropdown, instantly re-flexing growth, exit multiples, payout, and cost of debt across the whole model. A side-by-side comparison table summarizes ending NAV, IRR, MOIC, and liquidity runway for every case.
- One-click Base, Upside, Downside, and Stress scenario switching
- Live re-flexing of growth, multiples, payout, and cost of debt
- Side-by-side comparison of key outputs across all four scenarios
- Ideal for investment committee and board scenario presentations
14. Dashboard
The Dashboard tab summarizes current NAV, liquidity runway, leverage, and ten-year outlook metrics in one executive view, complete with live NAV trajectory and annual distribution charts. This is the tab buyers will present to investment committees, lenders, or shareholders as their model executive summary.
- Executive KPI summary of NAV, runway, leverage, IRR, and MOIC
- Live NAV trajectory chart from historical through Year 10
- Annual distributions bar chart for shareholder communication
- One-page view ideal for board and investor presentations
15. Checks
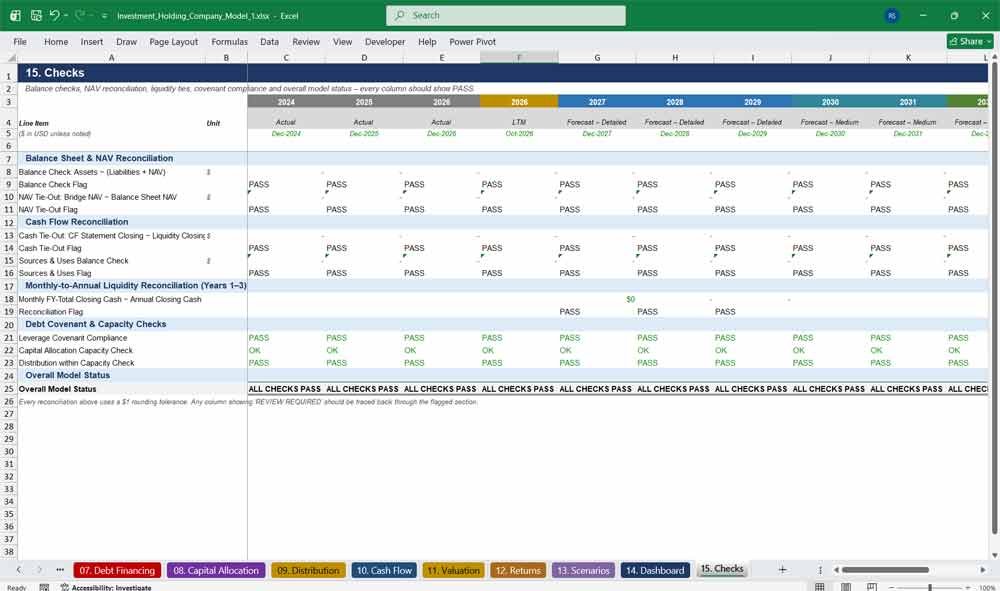
The Checks tab is the quality-control backbone of this Excel financial model, running balance sheet, NAV, cash flow, and monthly-to-annual reconciliations automatically. Every period returns a clear PASS or REVIEW flag, giving buyers full confidence that this holding company model is error-free and audit-ready.
- Automated balance sheet and NAV bridge tie-out checks
- Cash flow and Sources & Uses reconciliation every period
- Monthly-to-annual liquidity reconciliation for the 36-month model
- Overall PASS / REVIEW model status flag by period
Why Buy This Investment Model
Buy this model if you want a professional, fully dynamic investment holding company financial model without spending weeks building one from scratch. Every formula is live, every date is linked to a single input, and every tab is reconciled through built-in checks — so you get a lender-ready, investor-ready NAV, liquidity, capital allocation, and distribution model you can customize with your own portfolio in hours, not weeks. Whether you’re a family office, private equity platform, BDC, or holding company finance team, this Excel template gives you the same institutional-grade financial modeling architecture used by professional investment teams, at a fraction of the cost of building or commissioning one yourself.
Investment Holding & NAV Frequently Asked Questions
What Excel version do I need to open this model?
This model is built in standard .xlsx format using Excel 2007-and-later formulas, so it opens natively in any modern version of Microsoft Excel (2016 and above, or Microsoft 365) on Windows or Mac. It is not designed for Google Sheets, and some formulas may not render correctly there.
Can I change the historical numbers and portfolio companies to match my own business?
Yes. Every hardcoded input is color-coded in blue on a pale-yellow fill, so you can identify editable cells at a glance. Simply replace the illustrative portfolio investments, cost basis, and historical figures with your own data, and every formula recalculates automatically.
Do I need advanced Excel skills to use this model?
No advanced skills are required to use the model as-is — you only need to enter your own assumptions and portfolio data into the clearly marked blue input cells. Basic familiarity with Excel formulas is helpful if you want to restructure sections or add portfolio companies.
How do I change the forecast start date?
Change the Model Start Date on the Assumptions tab, and every year, month, and date across all 15 tabs updates automatically. There is no need to manually re-date any tab, formula, or chart anywhere else in the workbook.
Does the model include a monthly cash flow view, or only annual?
Both. The Liquidity tab includes a full annual liquidity waterfall plus a rolling 36-month monthly liquidity model for granular near-term cash planning, in addition to the ten-year annual forecast running across every other tab.
Can I run different scenarios, like a downturn or stress case?
Yes. The Assumptions tab includes a Base, Upside, Downside, and Stress scenario selector that instantly re-flexes growth rates, exit multiples, payout ratios, and cost of debt across the entire model, and the Scenarios tab summarizes the comparison.
How do I know the model is calculating correctly?
The dedicated Checks tab automatically reconciles the balance sheet, NAV bridge, cash flow statement, sources and uses, and monthly-to-annual liquidity every period, returning a clear PASS or REVIEW flag so you can verify accuracy at a glance.
Is this a real fund’s data, or just an example?
The model ships with illustrative placeholder data — five sample portfolio companies and representative assumptions — so you can see it work end-to-end. It’s designed to be rebuilt with your own portfolio, capital structure, and assumptions for real use in a holding company, fund, or BDC.
Final Notes On The Investment Model
This Excel model utilises a clear architecture — shows how your Portfolio Value flows into NAV, and how NAV drives Liquidity, Liquidity funds Capital Allocation, and Capital Allocation determines Distributions and Ending NAV.
Further Reading
Merger & Acquisitions Model: Download a professional M&A financial model. Dynamic valuation, accretion/dilution analysis, synergies, and debt schedules.
- LBO Model: Ready to master corporate finance? Download our proven, step-by-step LBO financial model template to analyze leveraged buyouts, project debt paydown, and forecast returns like a seasoned private equity professional.