
5 Year Fintech as a Service Financial Model Template
This 5 Year Fintech as a Service Financial Model Template in Excel is a comprehensive financial planning tool designed to help FaaS companies, investors, and financial analysts evaluate the financial feasibility and profitability of your FaaS company.
5-Year Financial model for a Fintech as a Service (FaaS) company
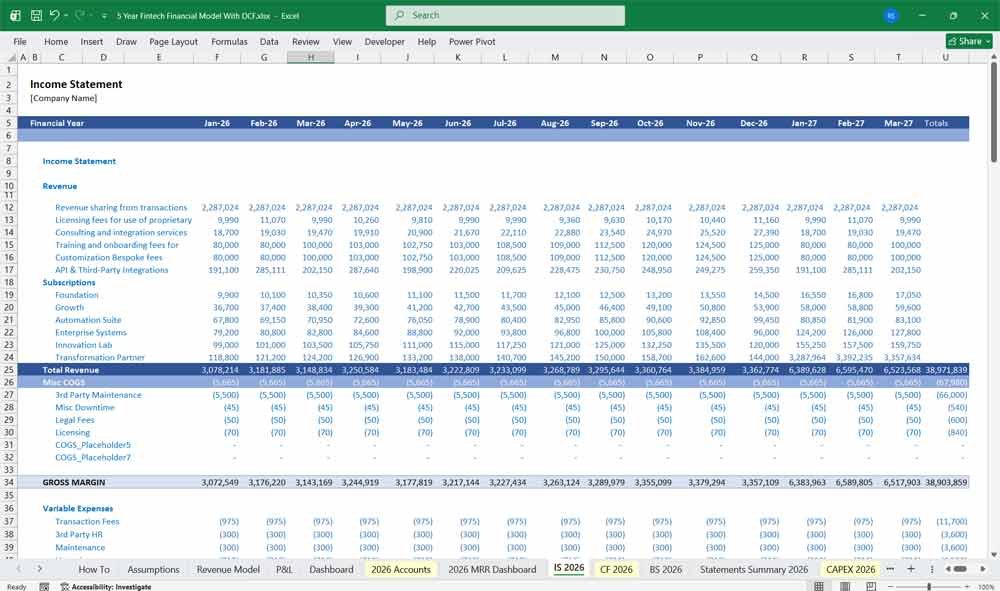
Income Statement
The Income Statement (or Profit and Loss Statement) reflects the company’s revenues, expenses, and profitability over a specific period.
Key Components:
Revenue Streams:
Subscription Revenue: Recurring revenue from customers paying for access to the FaaS platform (e.g., monthly or annual fees).
Transaction Fees: Revenue from processing transactions (e.g., payment processing, lending, or other financial services).
API Usage Fees: Revenue from third-party developers or businesses using the company’s APIs.
Professional Services: Revenue from consulting, implementation, or customization services.
Other Revenue: Any additional revenue streams (e.g., licensing, partnerships).
Cost of Goods Sold (COGS):
Infrastructure Costs: Cloud hosting, server maintenance, and other tech-related expenses.
Transaction Costs: Fees paid to payment processors, banks, or other intermediaries.
Support Costs: Customer support and onboarding expenses.
Gross Profit:
Gross Profit = Total Revenue – COGS
Gross Margin (%) = (Gross Profit / Total Revenue) * 100
Operating Expenses:
Research & Development (R&D): Costs related to platform development, innovation, and feature enhancements.
Sales & Marketing: Costs for customer acquisition, advertising, and partnerships.
General & Administrative (G&A): Overhead costs such as salaries, office expenses, and legal fees.
Operating Income:
Operating Income = Gross Profit – Operating Expenses
Non-Operating Items:
Interest Income/Expense: Income from investments or interest paid on debt.
Other Income/Expenses: One-time items or non-core business activities.
Net Income:
Net Income = Operating Income + Non-Operating Items – Taxes
Net Profit Margin (%) = (Net Income / Total Revenue) * 100
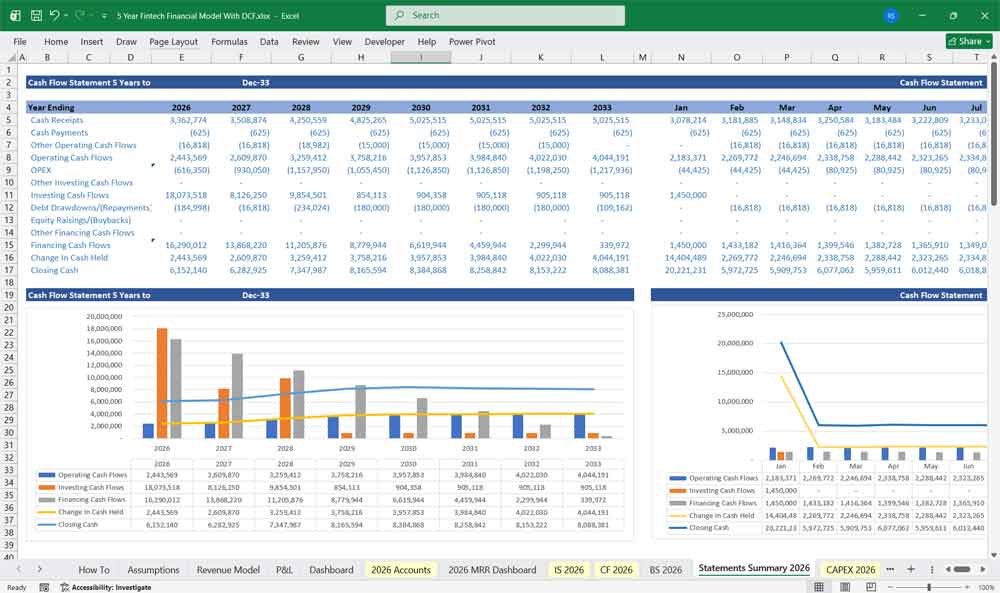
Fintech As A Service Cash Flow Statement
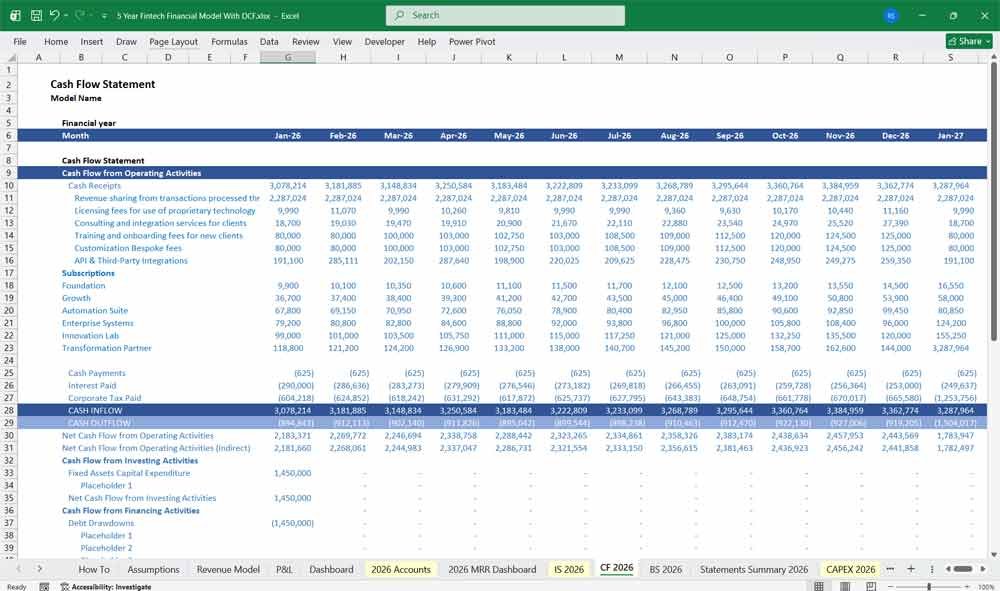
The Cash Flow Statement tracks the company’s cash inflows and outflows, divided into operating, investing, and financing activities.
Key Components:
Cash Flow from Operating Activities:
Net Income: Starting point, adjusted for non-cash items.
Adjustments for Non-Cash Items:
Depreciation & Amortization
Stock-Based Compensation
Changes in Working Capital:
Accounts Receivable (collections from customers)
Accounts Payable (payments to suppliers)
Accrued Expenses
Cash Flow from Investing Activities:
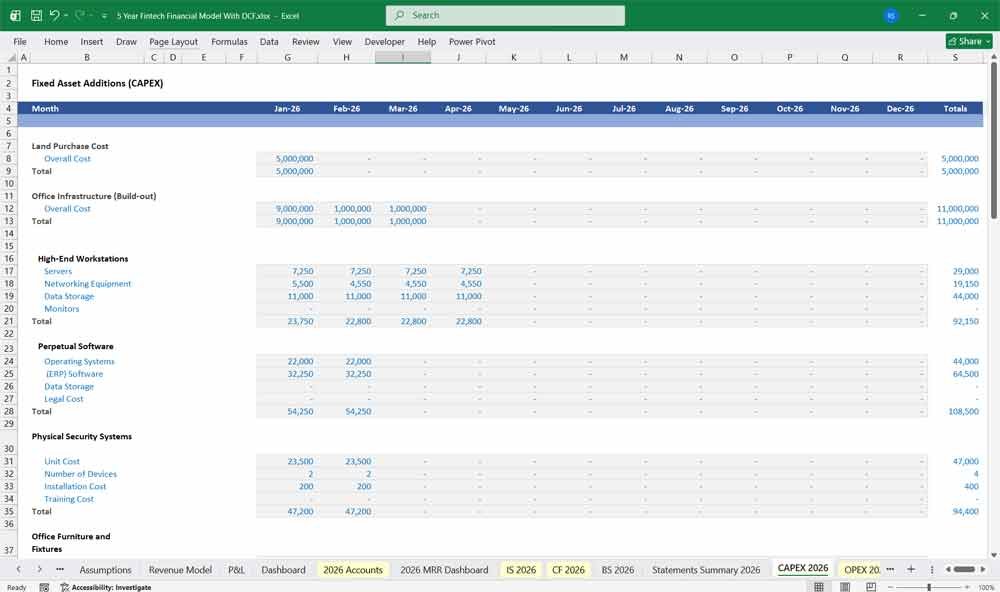
Capital Expenditures (CapEx): Investments in technology, infrastructure, or equipment.
Acquisitions: Cash used to acquire other businesses or technologies.
Investments in Marketable Securities: Short-term or long-term investments.
Cash Flow from Financing Activities:
Debt Issuance/Repayment: Proceeds from loans or repayment of principal.
Equity Issuance: Proceeds from issuing shares (e.g., venture capital or IPO).
Dividends: Cash paid to shareholders (if applicable).
Net Change in Cash:
Net Change in Cash = Cash from Operations + Cash from Investing + Cash from Financing
Ending Cash Balance:
Ending Cash Balance = Beginning Cash Balance + Net Change in Cash
Fintech As A Service Balance Sheet
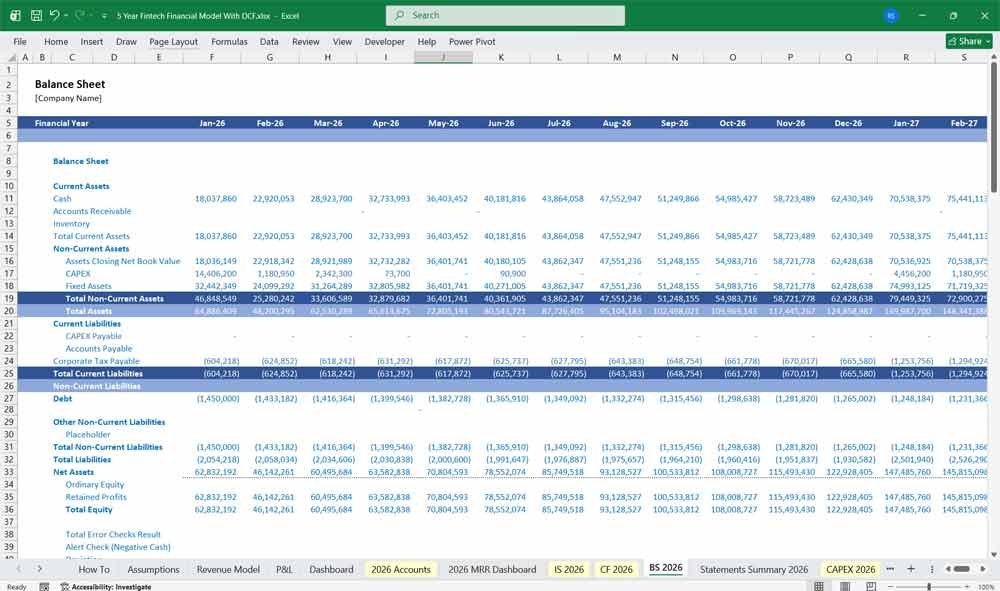
The Balance Sheet provides a snapshot of the company’s financial position at a specific point in time, showing assets, liabilities, and equity.
Key Components:
Assets:
Current Assets:
Cash & Cash Equivalents
Accounts Receivable (outstanding payments from customers)
Prepaid Expenses
Non-Current Assets:
Property, Plant & Equipment (PP&E)
Intangible Assets (e.g., patents, software)
Long-Term Investments
Liabilities:
Current Liabilities:
Accounts Payable (outstanding payments to suppliers)
Accrued Expenses (e.g., wages, taxes)
Short-Term Debt
Non-Current Liabilities:
Long-Term Debt
Deferred Revenue (e.g., prepaid subscriptions)
Equity:
Common Stock: Equity issued to shareholders.
Retained Earnings: Cumulative net income retained in the business.
Additional Paid-In Capital (APIC): Excess capital from equity issuance.
Balance Sheet Equation:
Assets = Liabilities + Equity
Key Assumptions and Drivers
Revenue Drivers:
Number of FaaS customers
Average Revenue Per User (ARPU)
Transaction volume and fees
API usage rates
Cost Drivers:
Infrastructure scalability
Customer acquisition costs (CAC)
R&D investment as a percentage of revenue
Working Capital Assumptions:
Days Sales Outstanding (DSO)
Days Payable Outstanding (DPO)
Inventory turnover (if applicable)
Capital Structure:
Debt-to-Equity ratio
Interest rates on debt
Equity dilution from fundraising
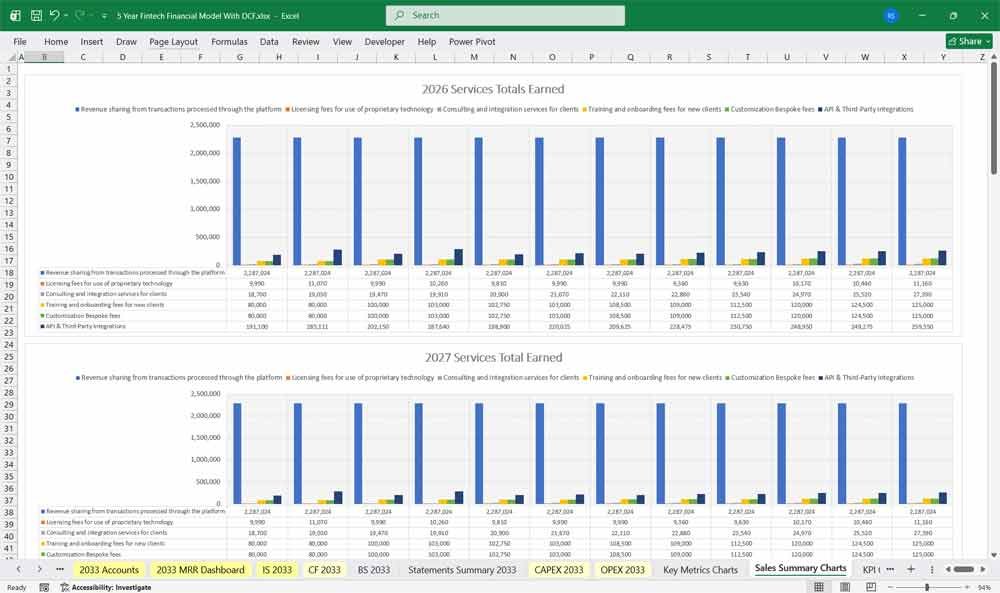
Revenue Streams
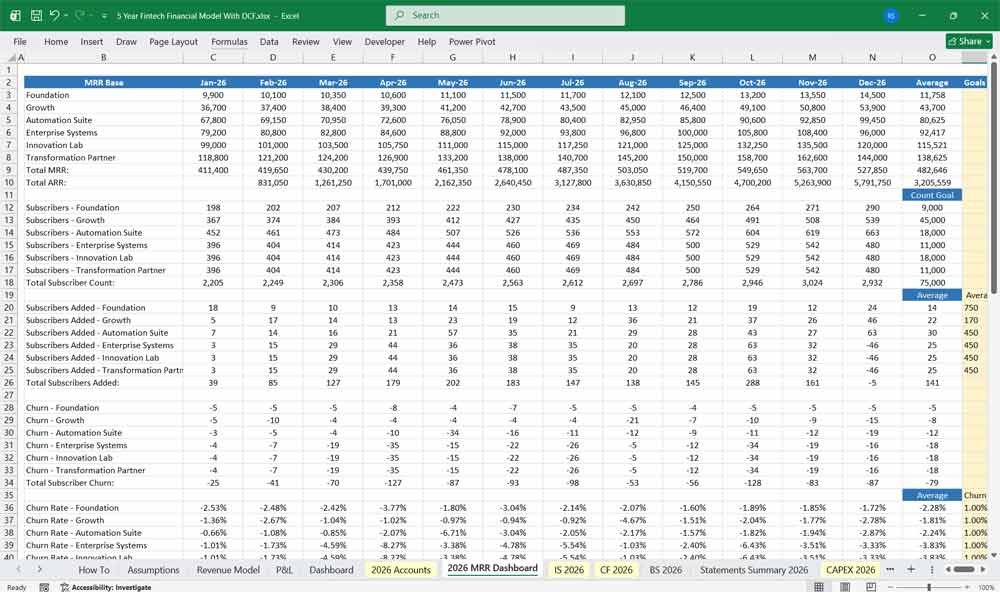
- Revenue Sharing – Percentage of transaction fees generated from payments processed through the platform.
- Licensing Fees – Charges for external entities utilizing proprietary technology.
- Consulting & Integration Services – Revenue from implementation, advisory, and integration work for clients.
- API Usage Fees – Charges based on API calls by third-party developers.
- Training & Onboarding Fees – One-time charges for onboarding new clients.
- Maintenance & Support Fees – Recurring revenue from ongoing platform updates and technical support.
- Customization Fees – One-time revenue from customized client solutions.
- Data Analytics & Reporting Services – Charges for advanced data insights provided to clients.
- Regulatory Compliance Services – Revenue from regulatory compliance support for financial institutions.
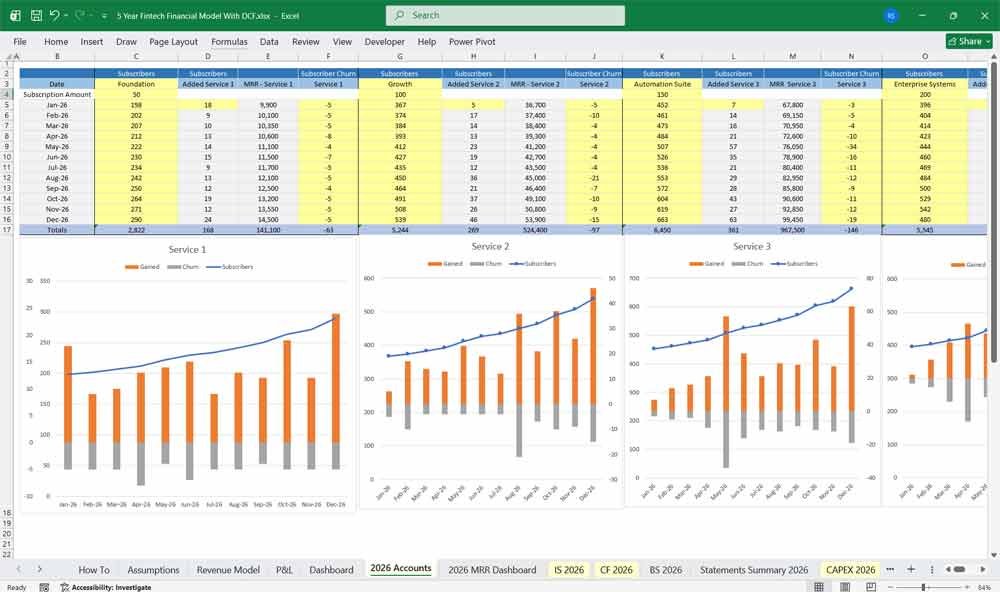
6 Tier Subscription Model
Pricing Strategy and Tier Definitions
This section outlines the pricing structure and features of each subscription tier to attract different customer segments.
Tier Details:
Tier 1: Basic Plan
Price: $10/month
Target Audience: Individual users or small teams.
Features:
Limited storage (e.g., 10 GB)
Basic customer support
Access to core features only
Upsell Opportunities: Add-ons for additional storage or features.
Tier 2: Starter Plan
Price: $25/month
Target Audience: Small businesses or startups.
Features:
Moderate storage (e.g., 50 GB)
Email support
Advanced analytics
Upsell Opportunities: Integration with third-party tools.
Tier 3: Growth Plan
Price: $50/month
Target Audience: Growing businesses.
Features:
Unlimited storage
Priority support
Customizable workflows
Upsell Opportunities: API access or advanced integrations.
Tier 4: Professional Plan
Price: $100/month
Target Audience: Mid-sized businesses or professional teams.
Features:
Advanced security features
Dedicated account manager
Team collaboration tools
Upsell Opportunities: Training or onboarding services.
Tier 5: Business Plan
Price: $250/month
Target Audience: Large businesses.
Features:
Enterprise-grade security
SLA guarantees (e.g., 99.9% uptime)
Custom reporting
Upsell Opportunities: Custom development or white-labeling.
Tier 6: Enterprise Plan
Price: $500/month (or custom pricing)
Target Audience: Enterprises with complex needs.
Features:
Fully customizable platform
24/7 premium support
On-premise deployment options
Upsell Opportunities: Long-term contracts or volume discounts.
Fintech As A Service Pre Seed Definitions
In this Fintech-as-a-Service (FaaS) financial model, the pre-seed stage focuses on proving product-market fit, validating the core API or modular infrastructure, and securing early-stage capital (typically ranging from $100k to $1M). At this point, the financial projections prioritize foundational R&D, compliance setup, and initial developer acquisition over immediate profitability. Founders use pre-seed funding to build out the minimum viable product (MVP)—such as embedded lending, payment rails, or KYC APIs—and run pilot programs with early design partners to demonstrate future recurring revenue potential (SaaS subscription or transaction-based volume).
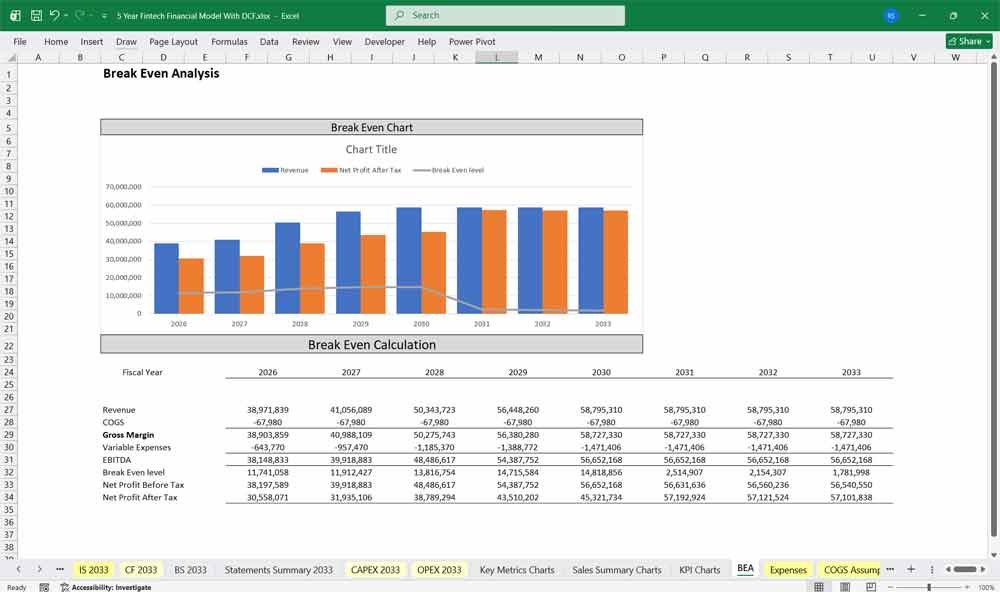
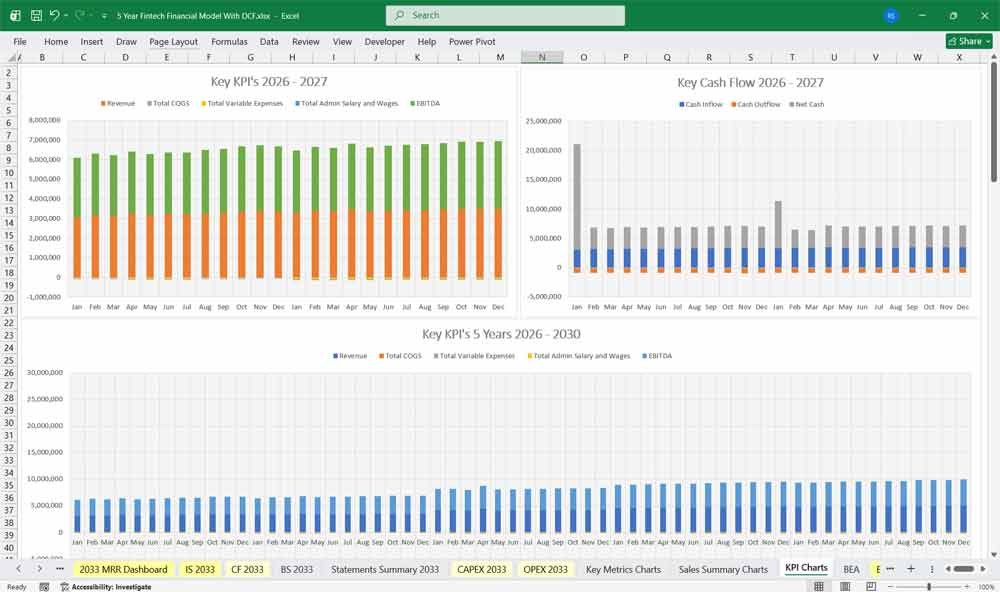
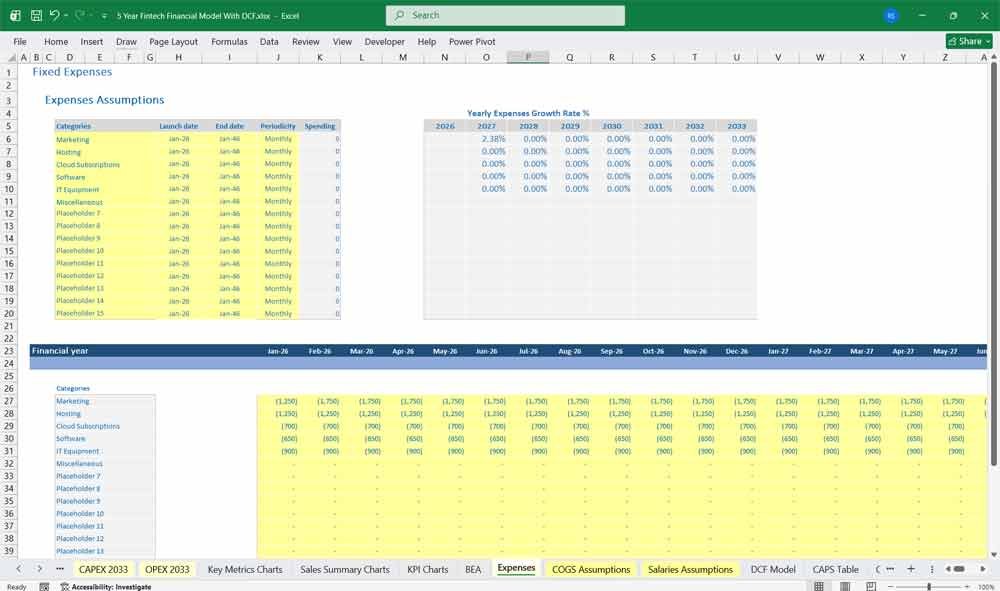
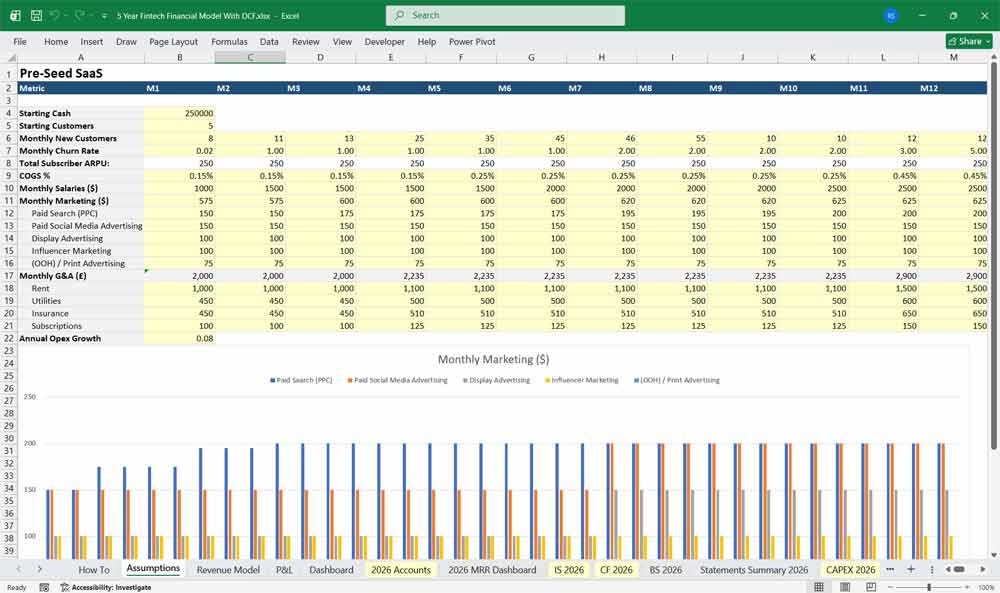
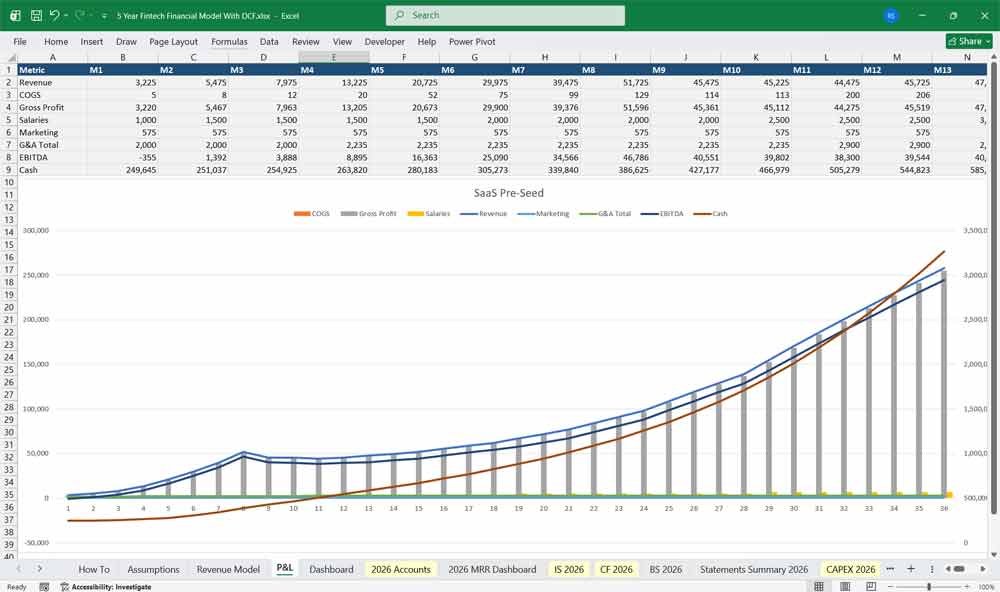
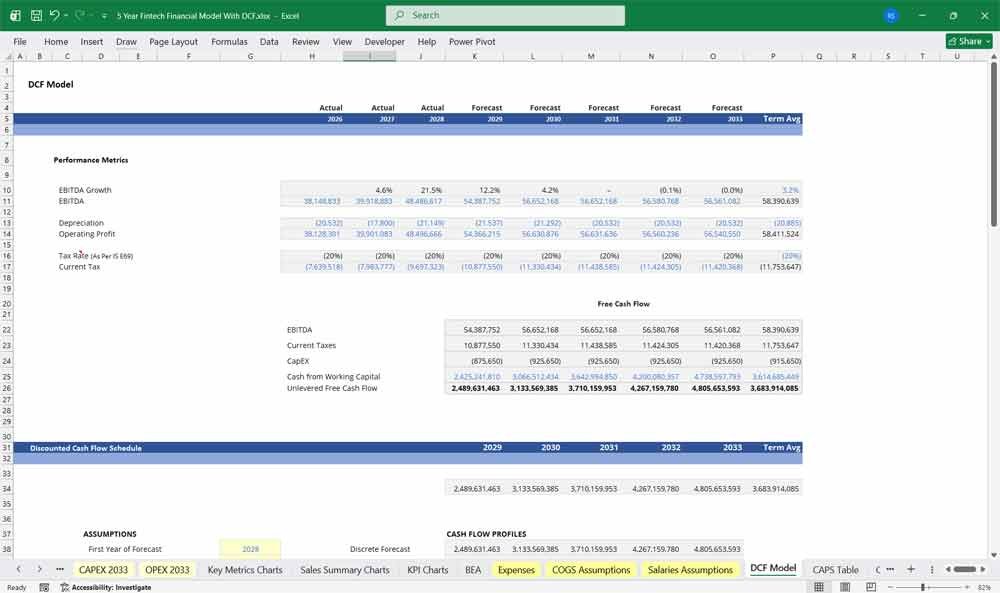
Value Your Fintech as a Service (FaaS) Company With A DCF
This 5-year Discounted Cash Flow (DCF) analysis for a Fintech-as-a-Service (FaaS) company, the valuation captures a hybrid revenue model blending recurring software subscriptions with usage-based transaction fees (such as interchange splits, payment volume take-rates, or per-API call charges). The model projects cash flows offset by upfront CapEx for enterprise-grade security architecture, API integration infrastructure, and regulatory compliance licensing (such as BaaS sponsor-bank agreements and ledgering engines). A 5-year timeframe reflects the rapid evolution of embedded finance and open banking; consequently, the Terminal Value in Year 5 carries tremendous weight, heavily reflecting the assumed Net Volume Retention (NVR) rate and the switching costs created when clients embed the provider’s payment or card-issuing infrastructure directly into their core applications.
WACC: Pricing Regulatory Exposure and Sponsor Bank Risk
The Weighted Average Cost of Capital (WACC) for a FaaS company typically ranges from 11% to 15%, balancing the high margins of a cloud software platform against severe financial regulatory and counterparty risks. Because FaaS providers operate primarily with intangible intellectual property rather than physical assets, their capital structures rely heavily on a high Cost of Equity. The discount rate must factor in a distinct “Regulatory and Sponsor Bank Beta.” Investors demand a steep hurdle rate to discipline future cash flows against the threat of regulatory crackdowns on partner banks, sudden shifts in Interchange Pass-Through regulations, compliance audit failures, and fraud/credit losses that can disrupt the underlying transaction flow.
Sensitivity Analysis: Stress-Testing Take-Rates and Gross Payment Volume
For a FaaS platform, Sensitivity Analysis is the primary tool for testing financial resilience against shrinking payment margins and shifting client transaction volumes. Financial analysts build sensitivity matrices to observe how a 5-basis-point drop in net take-rate or a 20% decline in Gross Payment Volume (GPV) across key enterprise clients impacts the company’s path to profitability. The most critical variables to cross-reference are Client GPV Growth Rate and Sponsor Bank Revenue Share %. Because fixed platform engineering and compliance costs remain high, a squeeze in interchange fees or an increase in the share taken by partner banks can rapidly erode gross margins, revealing the exact transaction volume required to maintain positive operational cash flows.
Further Reading
Neo Bank Financial Model: Fully-linked, formula-driven financial model built to take your Digital Banks actuals through it’s beginnings to it’s commercial offering.
- Embedded Finance Banking-as-a-Service Model: An Embedded Finance Financial Model providing a detailed framework for forecasting the operational and financial performance of a Banking-as-a-Service platform.
Conclusion
This Fintech Banking financial model provides a structured approach to managing revenues, expenses, cash flows, and financial stability for your Fintech company. By tracking financial statements and key metrics, the company can optimize profitability, control costs, and plan for future expansion.
Download Link On Next Page
Download Link On Next Page