
Fintech App Financial Model Template Excel
Plan, fund and launch your fintech with confidence using this professional Fintech Mobile App Financial Model in Excel. Built for neobanks, digital wallets, payments apps and card programmes, it delivers a complete 5-year monthly financial projection with annual roundups, covering user growth, payment volumes, interchange revenue, unit economics, regulatory capital and a fully integrated three-statement forecast in USD.
Financial Model for a Fintech Mobile App
Unlike generic startup templates, this fintech app financial model template is built around how a payments business actually makes money. It forecasts registrations, activation and churn, then converts active users into transactions, total payment volume (TPV) and revenue by stream: interchange, merchant fees, transfers, FX spread, ATM fees, subscriptions and partner commissions. Every assumption sits on one input tab, so you can test pricing, CAC, churn and hiring plans in seconds.
Investors expect a fintech pitch to show LTV to CAC, cash runway, break-even timing and regulatory capital headroom. This neobank financial model answers those questions automatically, with a linked P&L, cash flow statement and balance sheet, a KPI dashboard, base, upside and downside scenarios, and a dedicated audit tab that confirms the balance sheet balances in every month.
What’s Inside: Tab-by-Tab Guide
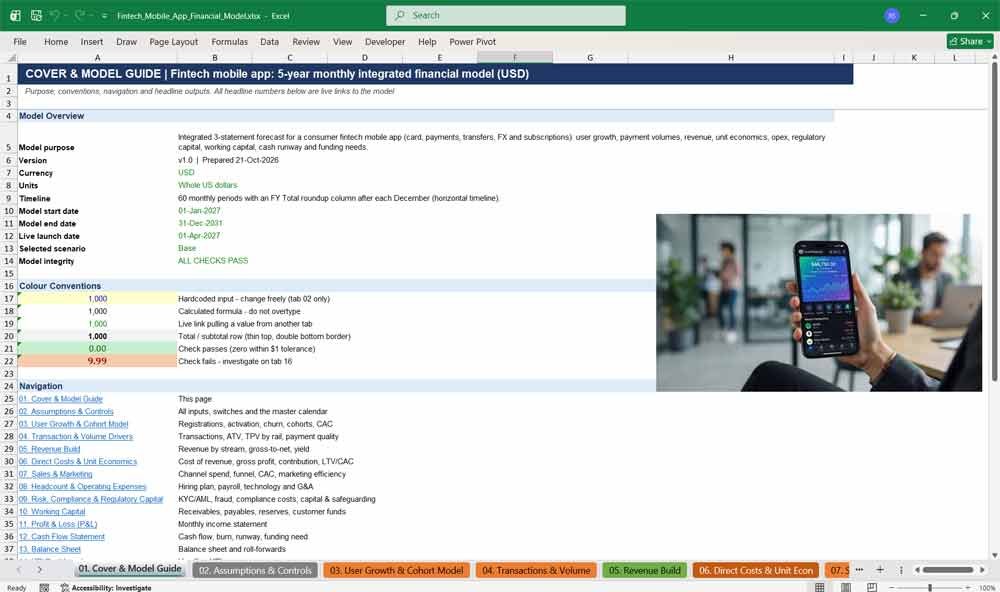
01. Cover & Model Guide
Start here for a clear overview of the fintech financial model, including its purpose, version, currency, units and timeline. Colour conventions explain which cells to edit, clickable navigation links jump to every tab, and live headline outputs summarise five years of results.
- Model purpose, version, currency and units
- Live start date, end date, launch date and selected scenario
- Colour-coded legend for inputs, formulas and links
- One-click navigation to all 16 tabs
- Headline outputs: users, TPV, revenue, EBITDA, cash and headcount
- Model integrity status at a glance
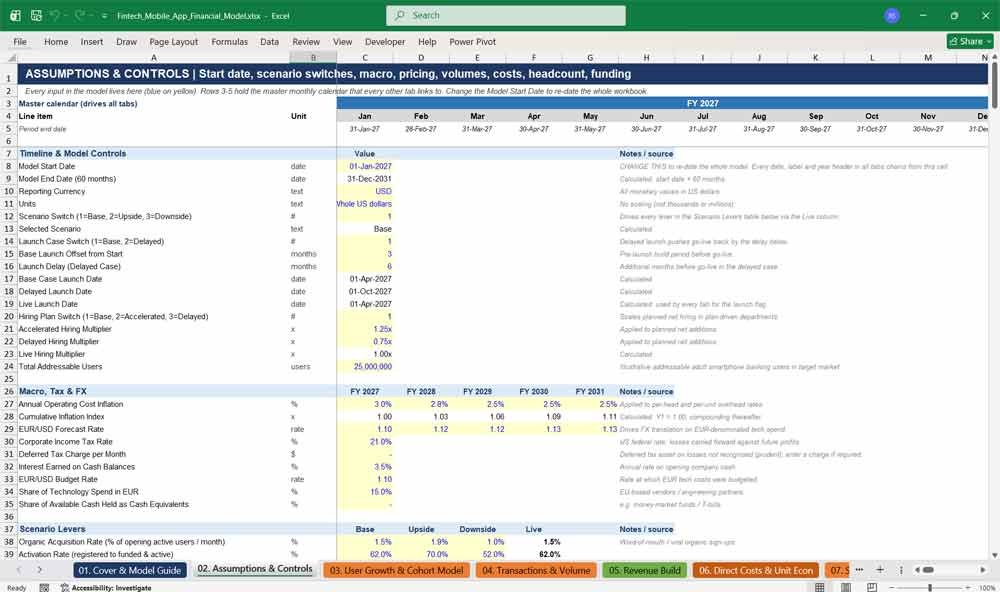
02. Assumptions & Controls
Every input in the fintech model lives on this single control tab. Change the model start date and every date, label and year header updates automatically. Adjust inflation, tax, FX, pricing, growth, salaries, payment fees, funding terms and scenario switches in one place.
- One start date drives the entire 60-month timeline
- Scenario switch for Base, Upside and Downside cases
- Launch case switch (base or delayed launch)
- Hiring plan switch (base, accelerated or delayed)
- Pricing, take rates, payment fees and cost assumptions
- Headcount plan and salaries for 15 departments
- Funding terms for founder, seed, Series A, Series B and venture debt
Fintech Mobile App Economics
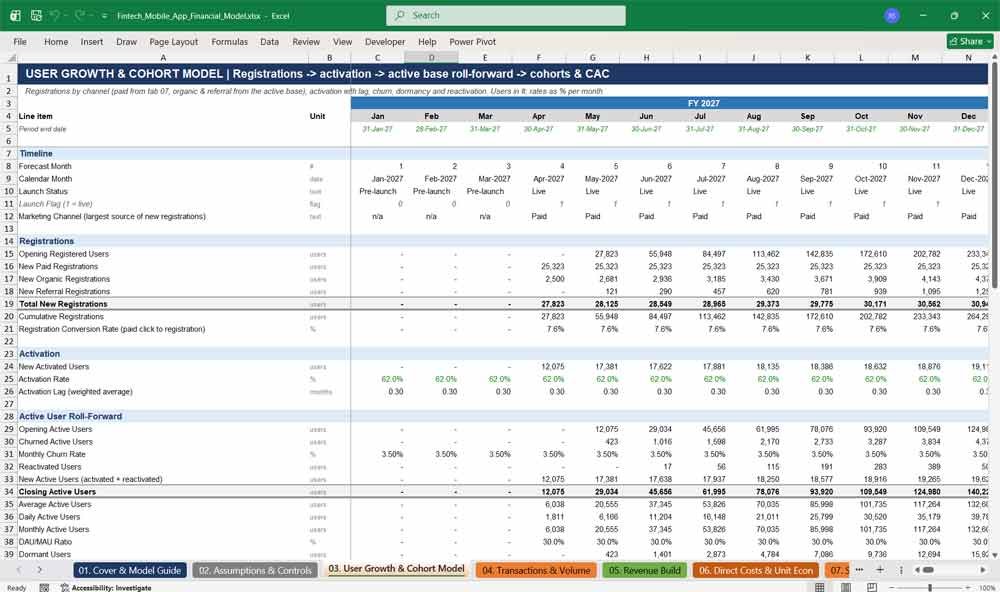
03. User Growth & Cohort Model
Forecast fintech app user acquisition month by month. Paid, organic and referral registrations flow through activation, churn, dormancy and reactivation to closing active users, with DAU, MAU, retention curves, cohort analysis and CAC metrics built in for investor-ready growth projections.
- Paid, organic and referral registration forecasts
- Activation rate and activation lag
- Active user roll-forward with churn and reactivation
- DAU, MAU and DAU/MAU ratio
- 30-day, 90-day, 180-day and 12-month retention
- Monthly acquisition cohorts and market penetration
- User reconciliation check
04. Transaction & Volume Drivers
Turn active users into transactions and total payment volume. This tab models transactions per user, success and failure rates, average transaction value and TPV split across eleven payment rails, from card spend and bank transfers to P2P, ATM, wallet and FX volume.
- Transactions per active user and success rate
- Failed, reversed and refunded transactions
- Gross and net transaction volume
- TPV by rail: domestic and international card, bank transfer, P2P, merchant, ATM, wallet and more
- Payment mix, cross-border share and FX-eligible volume
- Refund, reversal, failure and chargeback rates
- Payment volume reconciliation check
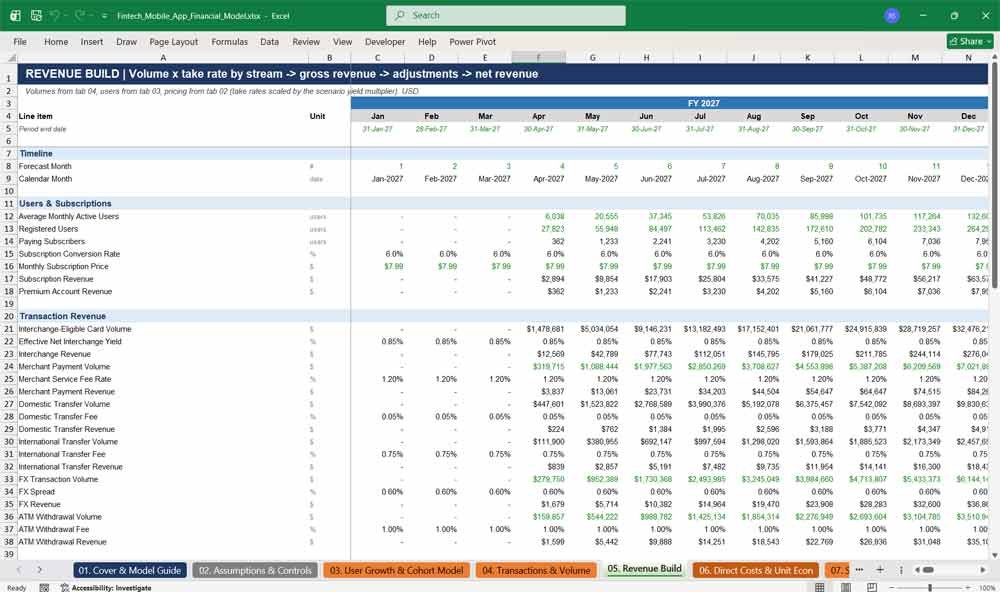
05. Revenue Build
Build fintech revenue bottom-up by stream. Interchange, merchant fees, domestic and international transfers, FX spread, ATM fees, card fees, instant transfers, subscriptions and partner commissions are each calculated from volume and pricing, then reconciled from gross revenue to net revenue.
- Interchange revenue on card volume
- Subscription and premium account revenue
- Transfer, FX, ATM and instant transfer fees
- Card issuance, replacement and premium card fees
- Partner and referral commission revenue
- Revenue share, refunds and promotional credit deductions
- Net revenue yield on TPV and revenue per user
06. Direct Costs & Unit Economics
Understand the true profitability of every user. Processor, card scheme, issuer, KYC, fraud, chargeback and rewards costs roll into gross profit and contribution margin, producing the LTV, CAC, LTV to CAC ratio and payback period investors scrutinise in every fintech pitch.
- Payment processing, card scheme and issuer costs
- Card programme costs: issuance, personalisation and delivery
- KYC, AML, identity verification and fraud costs
- Cashback, rewards and customer support costs
- Gross profit, gross margin and contribution margin
- LTV, blended CAC, LTV to CAC ratio and CAC payback
- Cohort LTV and cohort contribution margin
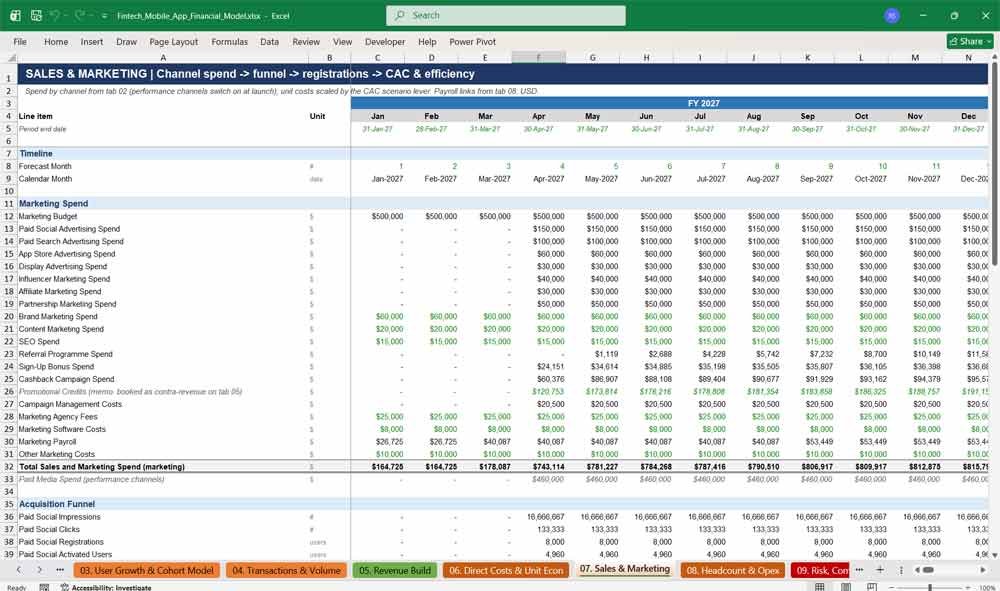
07. Sales & Marketing
Plan every marketing dollar with a channel-level acquisition funnel. Spend on paid social, search, app stores, influencers, affiliates and partnerships converts through impressions, clicks and registrations into activated users, with CAC by channel and marketing efficiency metrics.
- Spend by channel, including brand, content and SEO
- Paid social impressions, clicks and registrations
- Paid search, app store and partnership funnels
- Referral programme, sign-up bonus and cashback campaigns
- Paid, organic, referral and partnership CAC
- Marketing efficiency ratio and budget variance
- Sales payroll and business development costs
08. Headcount & Operating Expenses
Model your team and overheads in detail. A department-level hiring plan drives payroll, taxes, benefits and bonuses, while technology, cloud, software and G&A costs build up to total operating expenses. Customer support headcount scales automatically with active users.
- Headcount for 15 departments plus contractors
- Hires, departures and attrition
- Salaries escalated by salary inflation
- Payroll taxes, benefits, pension, health and bonuses
- Cloud hosting, API, software and cybersecurity costs
- Office, legal, audit, insurance and G&A costs
- Opex per employee, per user and as % of revenue
09. Risk, Compliance & Regulatory Capital
Show investors and regulators you take compliance seriously. This tab forecasts KYC, AML, sanctions screening, fraud losses, chargebacks and licensing costs, then tests regulatory capital requirements and safeguarding of customer funds every month, with a clear compliance status flag.
- KYC, EDD and AML screening volumes and costs
- Sanctions screening and transaction monitoring
- Licence application, renewal and filing fees
- Fraud losses, recoveries and chargebacks
- Regulatory capital requirement, buffer and headroom
- Safeguarding requirement and reconciliation
- Monthly compliance status and capital shortfall flag
Fintech Mobile App Financial Statements
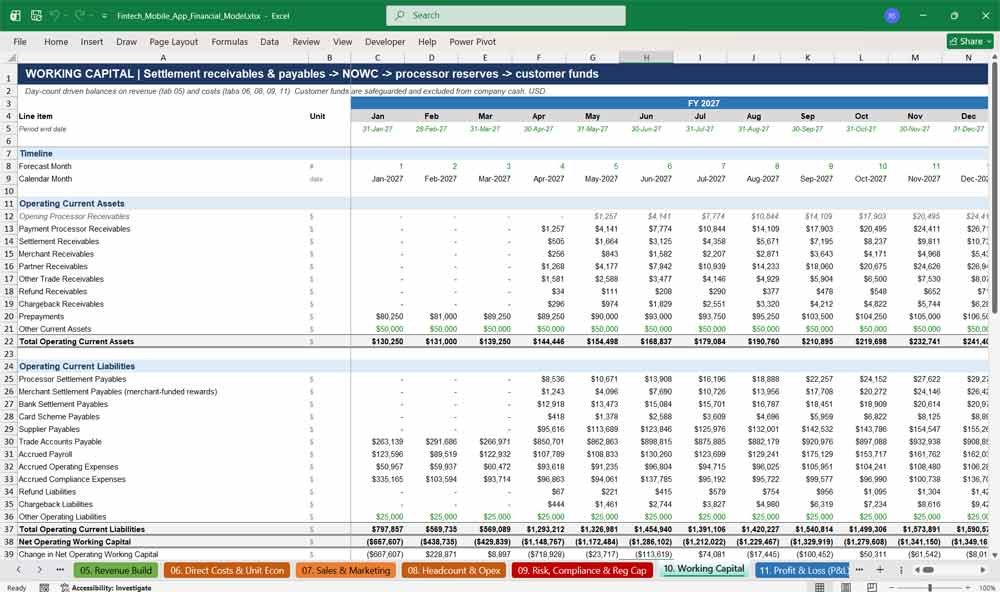
10. Working Capital
Capture the cash timing that makes payments businesses unique. Processor, settlement, merchant and partner receivables, together with processor, scheme and supplier payables, build net operating working capital, plus rolling processor reserves and safeguarded customer funds held outside company cash.
- Processor, settlement, merchant and partner receivables
- Processor, bank, card scheme and supplier payables
- Accrued payroll, opex and compliance expenses
- Net operating working capital and monthly change
- Rolling processor reserves as restricted cash
- Customer funds held and safeguarded funds
- Collection, settlement, receivable and payable days
11. Profit & Loss (P&L)
A complete monthly fintech income statement. Revenue by stream, revenue adjustments, cost of revenue and operating expenses by function flow through to EBITDA, depreciation, interest, tax and net income, with margins, growth rates and a monthly profitability status.
- Revenue by stream from gross to net
- Cost of revenue and gross margin
- Operating expenses by function
- EBITDA and EBITDA margin
- Depreciation, amortisation, interest and tax
- Net income and net income margin
- Tax losses carried forward automatically
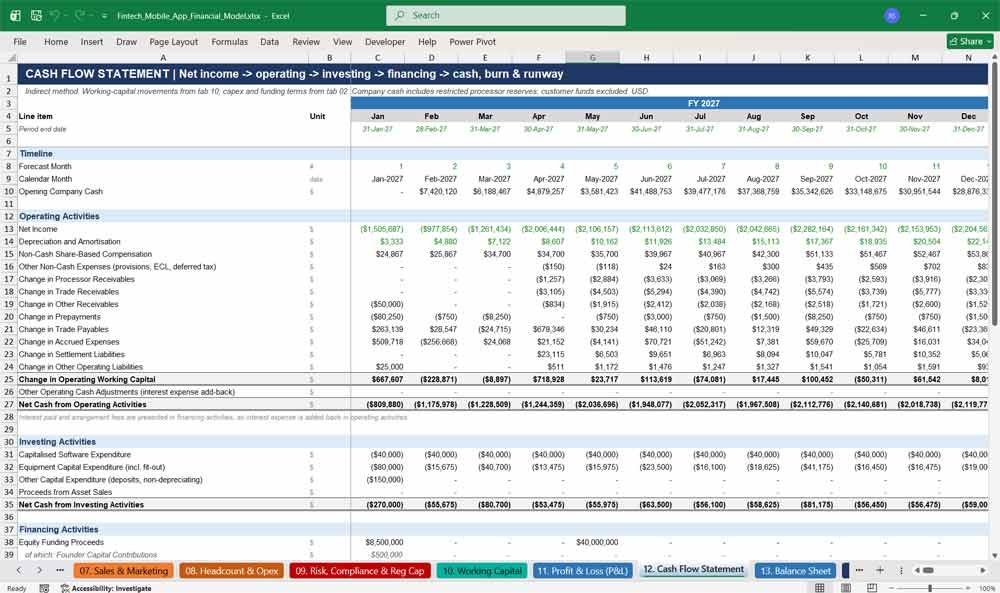
12. Cash Flow Statement
Know exactly how much funding you need and when. The indirect cash flow statement covers operating, investing and financing activities, then calculates gross and net cash burn, cash runway, the month of any shortfall and your next funding requirement.
- Operating, investing and financing cash flows
- Working capital movements by line
- Capex for software, equipment and deposits
- Equity rounds and venture debt drawdown and repayment
- Restricted and available company cash
- Gross burn, net burn and cumulative burn
- Cash runway and next funding requirement
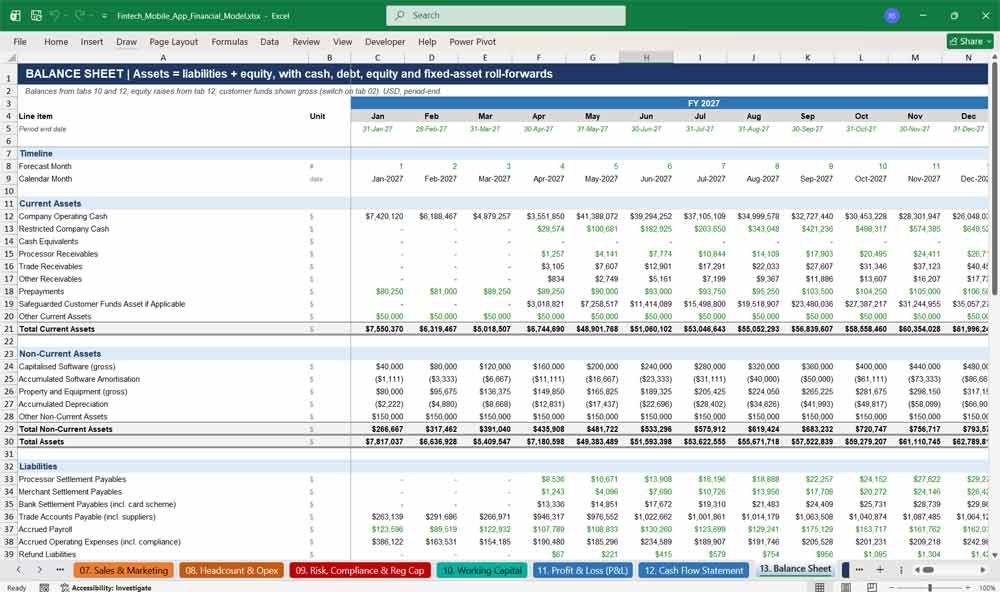
13. Balance Sheet
A fully integrated monthly balance sheet that balances in every period. Assets, liabilities and shareholders’ equity are linked to the P&L and cash flow, with roll-forwards for cash, retained earnings, debt, fixed assets and equity that prove the model’s integrity.
- Operating, restricted and equivalent cash
- Receivables, prepayments and safeguarded funds
- Capitalised software and property, net of depreciation
- Payables, accruals, debt and customer funds liability
- Share capital, premium, SBC reserve and retained earnings
- Cash, debt, fixed asset and equity roll-forwards
- Balance sheet check every month
Fintech Mobile App Financial KPIs
14. KPI Dashboard
Every metric investors ask for, in one place. Track registered and active users, retention, CAC, TPV, net revenue yield, gross margin, contribution, LTV to CAC, EBITDA, cash runway, funding raised and break-even month across all 60 months and five annual totals.
- User, retention and activation KPIs
- CAC, LTV and payback metrics
- TPV, transactions and average transaction value
- Revenue, margins and profitability KPIs
- Cash, burn, runway and peak cash requirement
- Month of EBITDA break-even and funding efficiency
- Base, upside and downside revenue comparison
15. Scenarios & Sensitivities
Stress-test your fintech business plan. Compare base, upside and downside levers side by side, see revenue, EBITDA, cash, peak burn, funding need and break-even under each case, and measure sensitivity to CAC, churn, take rate, fraud, hiring and launch delays.
- 11 scenario levers across three cases
- Base and delayed launch dates
- Base, accelerated and delayed hiring plans
- Scenario revenue, EBITDA and closing cash
- Peak cash burn, funding requirement and break-even month
- One-variable sensitivities for CAC, churn, yield, fraud and payroll
- Valuation and investor ownership sensitivity
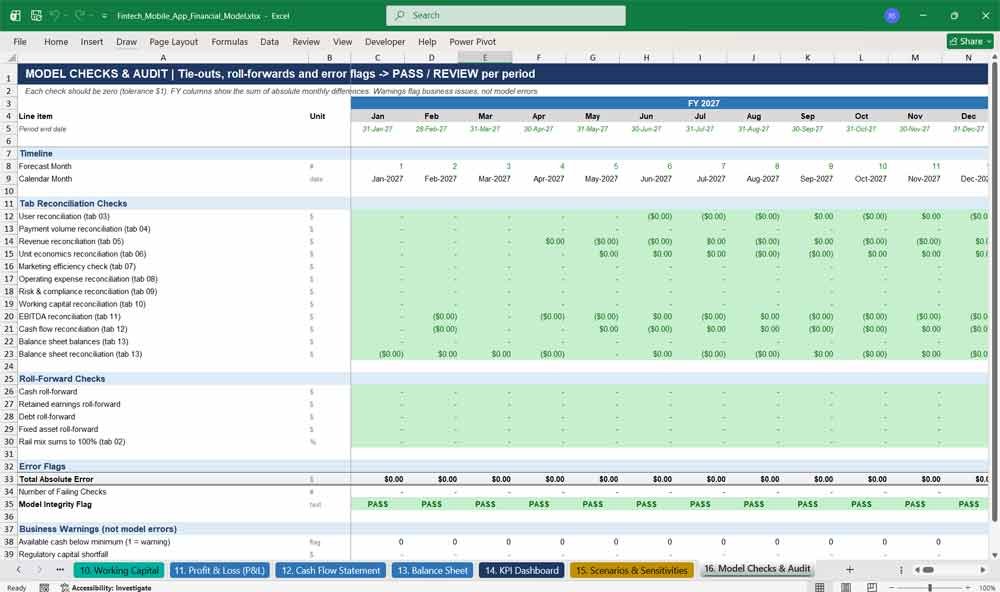
16. Model Checks & Audit
Present your numbers with confidence. This audit tab collects every reconciliation check from across the model, adds cash, retained earnings, debt and fixed-asset roll-forward tests, and returns a clear PASS or REVIEW flag every month, plus separate business warnings.
- 12 tab-level reconciliation checks
- Cash, retained earnings, debt and fixed asset roll-forwards
- Payment mix validation
- Total absolute error and failing-check count
- PASS / REVIEW model integrity flag
- Business warnings for low cash, capital shortfall and safeguarding gaps
Why Buy This Model?
Building a credible fintech app financial model from scratch can take weeks, and one broken link can undermine an investor meeting. This model gives you a lender- and investor-ready structure on day one. It is a fully integrated three-statement forecast, built specifically for payments and neobank economics, with every line driven by clear assumptions on a single input tab. Change the start date, pricing, CAC, churn or hiring plan and the entire model updates instantly. Built-in scenarios, sensitivities and an audit tab let you defend your numbers under scrutiny. Whether you are raising a seed round, preparing a Series A, applying for an e-money or payments licence, or testing a new product idea, you get professional-grade analysis for a fraction of the cost of hiring a financial modeller.
Fintech Mobile App Frequently Asked Questions
Q: What type of business is this model designed for?
A: It is built for consumer fintech mobile apps, including neobanks, digital wallets, payments and P2P apps, and card programmes. The revenue streams are covered: interchange, subscriptions, transfer and FX fees, merchant payments and partner commissions. You can switch any stream off by setting its price or rate to zero.
Q: Do I need to be a financial modelling expert to use it?
A: No. All inputs sit on one tab and are coloured blue on yellow, so you always know which cells to change. Everything else is formula-driven. The Cover tab explains the colour conventions and links to every section.
Q: Can I change the start date of the model?
A: Yes. Change the Model Start Date on the Assumptions & Controls tab, and every date, month label and year header across all 16 tabs updates automatically.
Q: How long is the forecast period?
A: Five years of monthly projections (60 months), with an annual FY Total column after each year, so you get both month-by-month detail and a clean annual view.
Q: What currency is the model in?
A: The model is in US dollars. Because all figures come from your inputs, you can enter assumptions in another currency and relabel the currency field on the Assumptions tab.
Q: Does it include a balance sheet and cash flow statement?
A: Yes. It is a fully integrated three-statement model: profit and loss, cash flow statement and balance sheet are all linked. The balance sheet balances in every month, and this is checked automatically.
Q: Can I run different scenarios?
A: Yes. A single switch moves the whole model between Base, Upside and Downside cases across 11 levers, including acquisition, activation, churn, CAC, transaction value and take rate. There are also switches for a delayed launch and for accelerated or delayed hiring. Tab 15 compares all three cases side by side.
Q: Will it show investors my CAC, LTV and payback period?
A: Yes. Unit economics are calculated monthly, including blended and fully loaded CAC, LTV, the LTV to CAC ratio, CAC payback period and contribution per active user, along with CAC by marketing channel.
Q: Does it calculate how much funding I need to raise?
A: Yes. The cash flow tab calculates net burn, cumulative burn, cash runway, the month of any cash shortfall and your next funding requirement. You can set the size and timing of founder capital, seed, Series A, Series B and venture debt.
Q: Does the model account for regulatory requirements?
A: Yes. A dedicated tab forecasts KYC, AML, sanctions, fraud and licensing costs and tests regulatory capital against a minimum requirement plus a buffer. It also tracks safeguarding of customer funds, and the model flags any capital shortfall.
Q: How do I know the formulas are correct?
A: The Model Checks & Audit tab collects reconciliation checks from every tab, plus roll-forward tests for cash, retained earnings, debt and fixed assets. It shows a PASS or REVIEW flag for every month.
Q: Can I edit the model or add my own revenue streams?
A: Yes. The workbook is fully unlocked, so you can edit formulas, add rows or adapt it to your business. It follows a consistent layout and colour code, which makes changes straightforward.
Q: Are the assumptions based on real data?
A: The model comes pre-filled with illustrative assumptions so you can see how it works straight away. You should replace them with figures for your own market, pricing and plans before sharing with investors.
Q: What software do I need?
A: Microsoft Excel 2019, Excel 2021 or Microsoft 365 is recommended. A few summary formulas use functions (such as MINIFS) that older versions of Excel do not support.
Conclusion On The Financial Model
This Fintech Mobile App Finance Model must focus on balancing capital expenditures with steady revenue growth from diversified subscription-based services. By optimizing operational costs, and power efficiency, and maximizing high-margin services like higher-tier subscriptions and affiliate offerings, the model ensures sustainable profitability and cash flow stability.
Download Link On Next Page