
Embedded Finance Platform Financial Model Excel
This Embedded Finance Banking-as-a-Service (BaaS) Financial Model is a powerful Excel-based financial planning tool designed to model the complex economics of fintech platforms, sponsor bank relationships, payment programs, lending products, and multi-program embedded finance businesses. Unlike a standard SaaS financial model, this BaaS financial model captures program-level revenue, interchange income, sponsor bank fees, fintech revenue sharing, credit risk, fraud losses, FBO balances, regulatory capital, liquidity, and fully integrated three-statement financial statements.
10-Year financial model for an Embedded Finance Platform
Built as a 32-tab, formula-driven Excel financial model, it includes two years of historical monthly data and a detailed five-year, 60-month operating forecast. The model is designed for fintech founders, CFOs, finance teams, program managers, sponsor banks, investors, and advisors who need a detailed and credible view of an Embedded Finance or Banking-as-a-Service business.
This Embedded Finance Financial Model provides a detailed framework for forecasting the operational and financial performance of a Banking-as-a-Service platform. Model active accounts, new customer additions, churn, total payment volume (TPV), transactions, average balances, interchange rates, program fees, interest income, sponsor bank economics, fintech revenue share, credit losses, fraud, compliance costs, and operating expenses.
A Complete Banking-as-a-Service Financial Model in Excel
Whether you are modeling a card issuing program, lending or BNPL product, neobank deposit program, or multi-program BaaS platform serving multiple fintech clients, this Excel financial model provides the tools needed to understand the complete economics of the business.
The model includes revenue and interchange modeling, sponsor bank fees, fintech revenue-share economics, program-level unit economics, credit and fraud risk sharing, FBO funds-flow tracking, liquidity and regulatory capital analysis, a fully integrated Platform P&L, balance sheet and cash flow forecast, valuation, sensitivity analysis, scenario analysis, KPI reporting, and audit checks.
Key Features of the Embedded Finance Financial Model
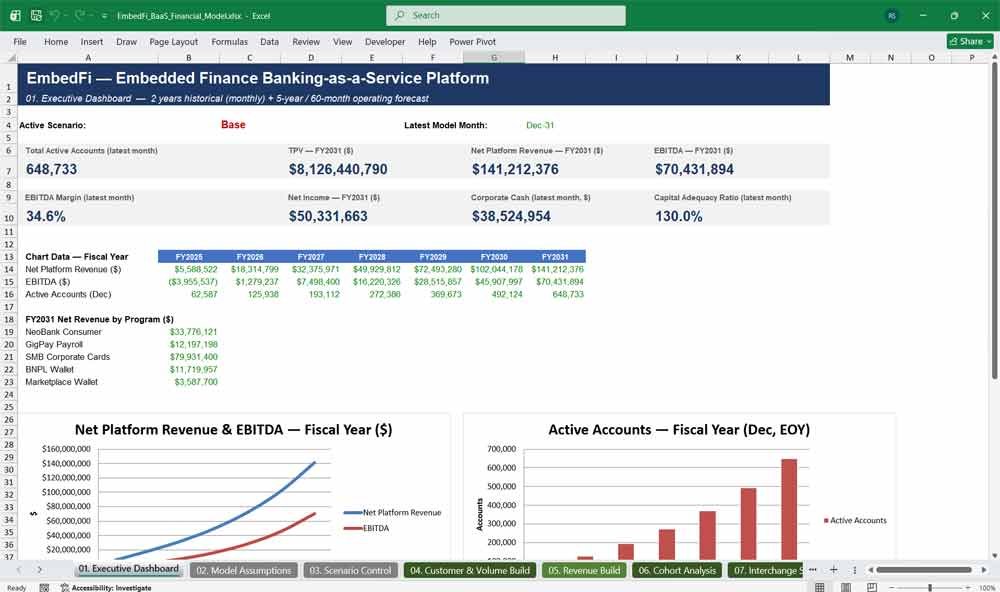
Executive Dashboard
A comprehensive executive dashboard provides a high-level view of the most important BaaS KPIs, including active accounts, TPV, net platform revenue, EBITDA, EBITDA margin, net income, cash, and capital adequacy. Interactive charts provide visibility into revenue, EBITDA, account growth, and program revenue mix.
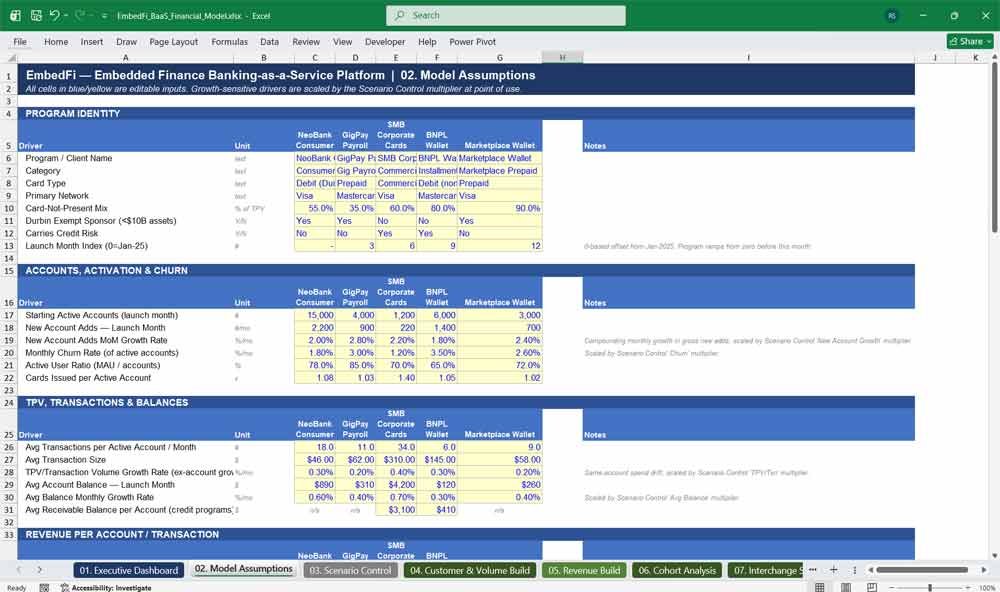
Model Assumptions & Scenario Control
A centralized assumptions section acts as the single source of truth for the model. Editable inputs cover account growth, churn, TPV, balances, revenue per account, take rates, interchange, sponsor bank fees, credit losses, fraud, compliance, headcount, operating expenses, funding, liquidity, tax, and valuation assumptions.
The Scenario Control allows users to switch between Base, Upside, and Downside scenarios using a simple dropdown. Scenario multipliers can adjust growth, churn, take rate, credit loss, fraud, and other key drivers throughout the model.
BaaS Platform Modeling
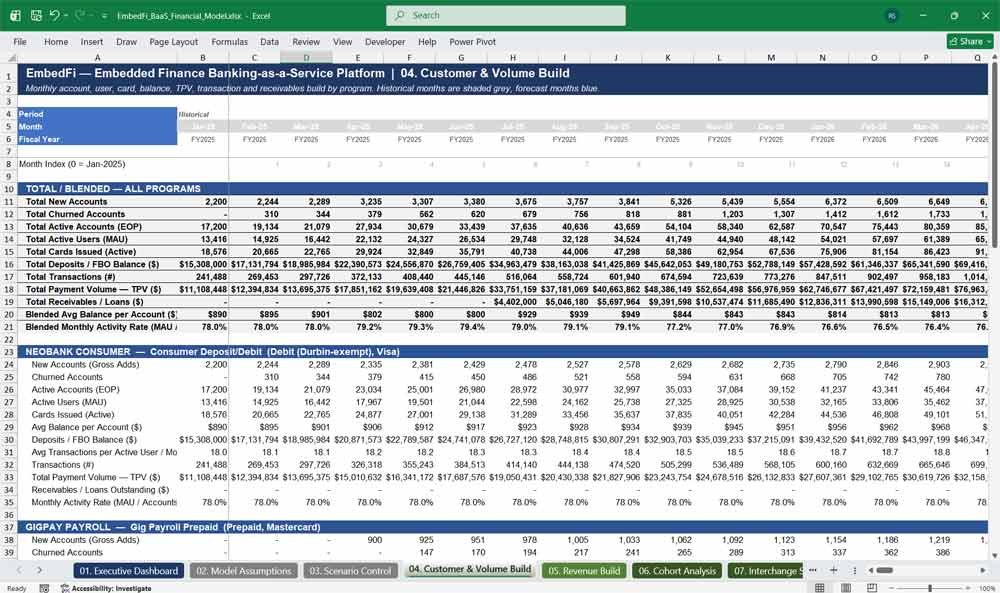
Customer & Volume Build
Build monthly operating forecasts for each fintech program, including new accounts, churn, active accounts, active users, cards issued, deposits, FBO balances, TPV, transactions, and receivables. Program-level data rolls up into consolidated platform totals.
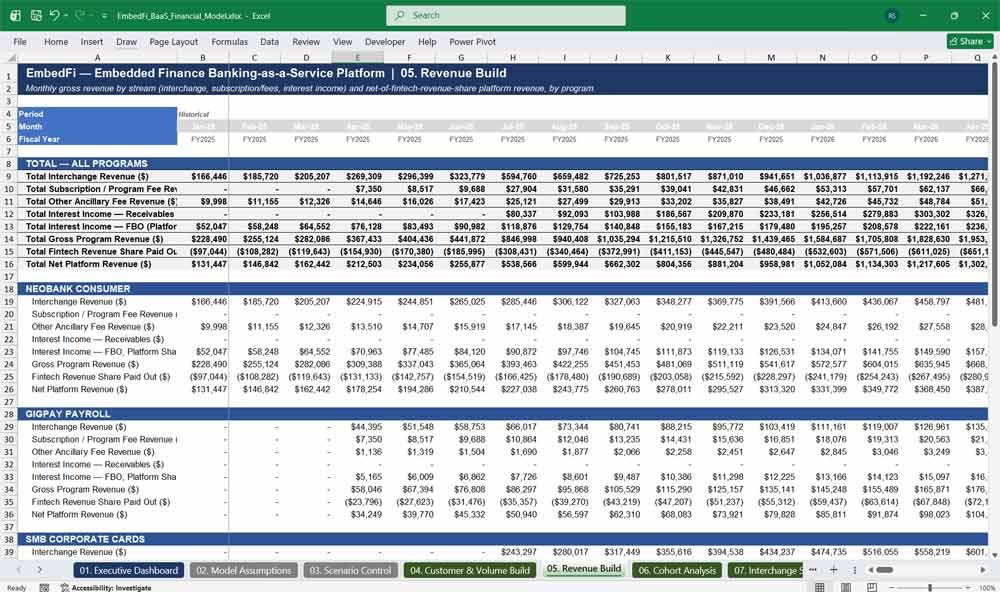
Revenue & Interchange Modeling
Model the major revenue streams of an Embedded Finance platform, including:
- Interchange revenue
- Subscription revenue
- Program fees
- Ancillary fees
- Interest income
- Revenue per account
- Transaction-based revenue
The interchange schedule supports different card types, networks, transaction types, and Durbin exemption status, allowing users to build more detailed card-program economics.
Sponsor Bank Economics
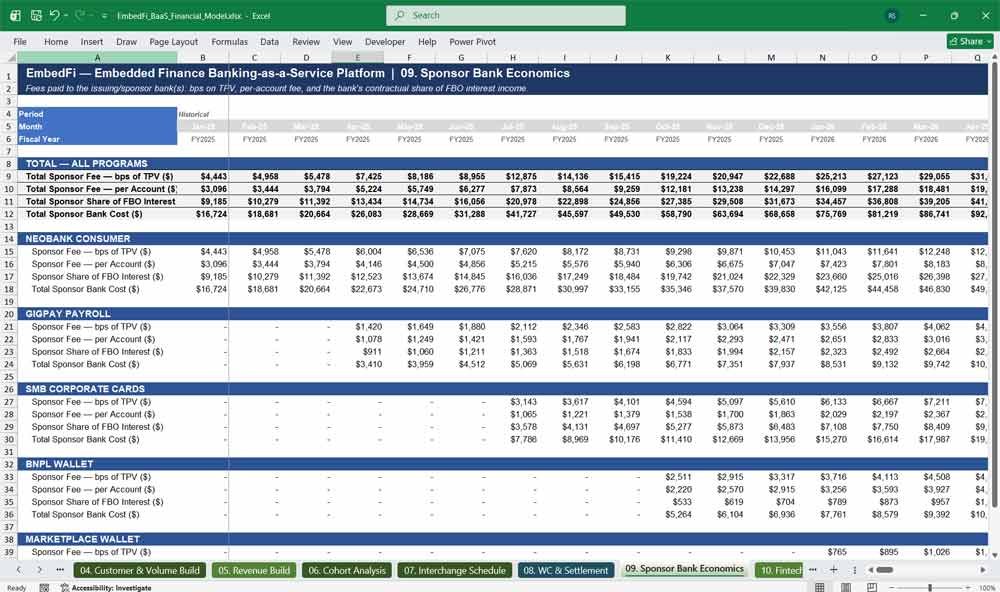
Model the economics of sponsor bank relationships, including basis-point fees on TPV, per-account fees, and the sponsor bank’s share of FBO interest income. Program-level and consolidated sponsor bank costs can be analyzed to support financial planning, benchmarking, and sponsor bank negotiations.
Fintech Revenue Share
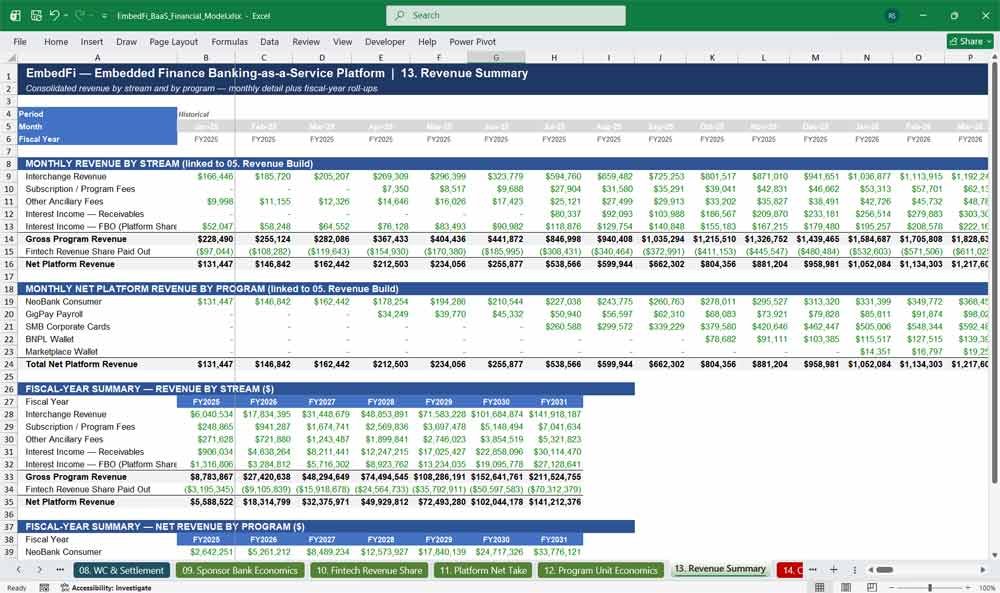
Track the revenue-sharing arrangements between the BaaS platform and its fintech clients. The model calculates monthly and cumulative revenue-share payments, program-level revenue-share percentages, and the blended platform revenue-share rate.
Embedded Banking Mechanics
Platform Net Take
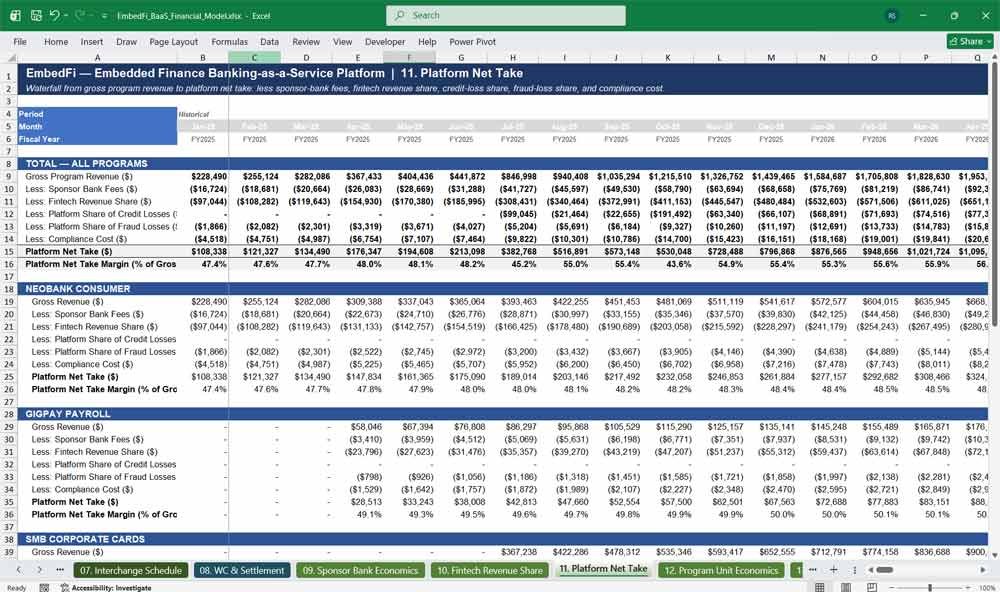
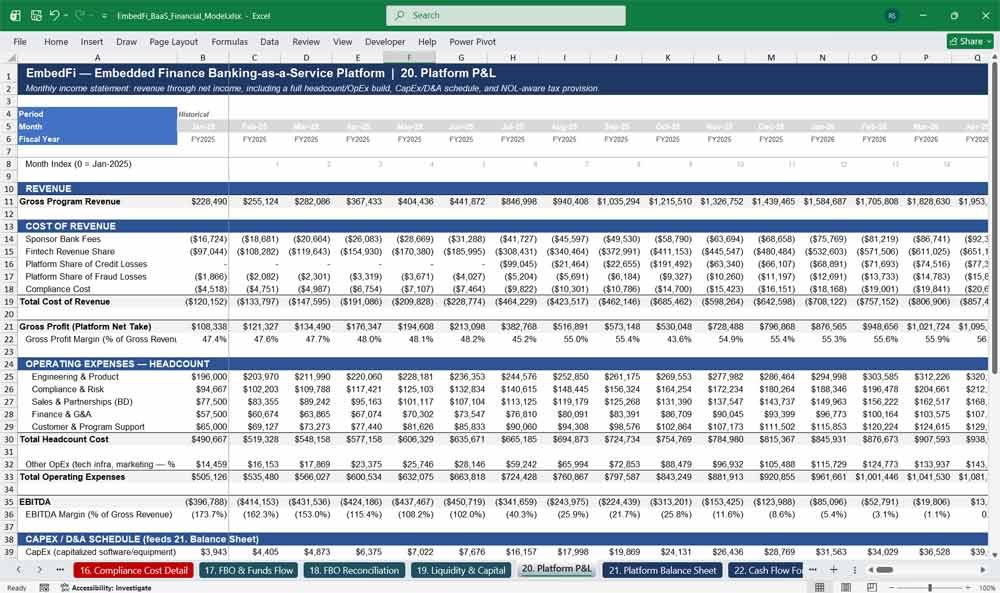
The Platform Net Take waterfall shows what the BaaS platform actually retains after accounting for sponsor bank fees, fintech revenue share, credit-loss share, fraud-loss share, and compliance costs. Net take margin is calculated as a percentage of gross program revenue, providing a clear view of the platform’s underlying economics.
Program Unit Economics
Analyze the economics of individual fintech programs with metrics including net take per active account, net take per basis point of TPV, customer acquisition cost (CAC), lifetime value (LTV), LTV/CAC, and CAC payback period.
Credit Risk & Fraud Modeling
For programs with lending or credit exposure, the model includes receivables, delinquency buckets, net charge-offs, provisions, and allowance-for-credit-losses calculations. Contractual platform credit-loss sharing is isolated for P&L analysis.
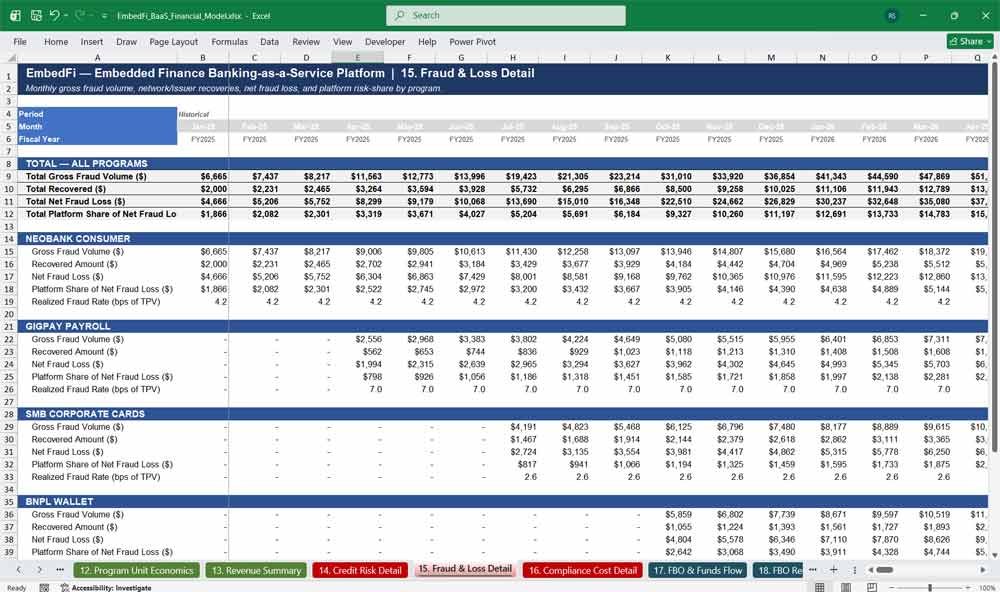
Fraud economics are also modeled using gross fraud volume, recoveries, net fraud loss, platform risk share, and realized fraud rates in basis points.
Compliance Cost Modeling
Model the cost of regulatory compliance as the business scales. The model includes KYC and onboarding costs per new account and ongoing BSA/AML transaction-monitoring costs per active account, providing visibility into the cost of compliance across fintech programs.
FBO & Funds Flow
Track customer funds through FBO accounts with a detailed monthly roll-forward covering beginning balances, new-account funding inflows, existing-balance growth, and ending FBO balances. Consolidated funds flow provides additional visibility into customer funds held across the platform.
FBO Reconciliation
Monitor book ledger balances against bank-reported balances with deposits in transit, outstanding settlements, reconciling items, and unreconciled variances. The reconciliation feeds directly into the model’s audit checks.
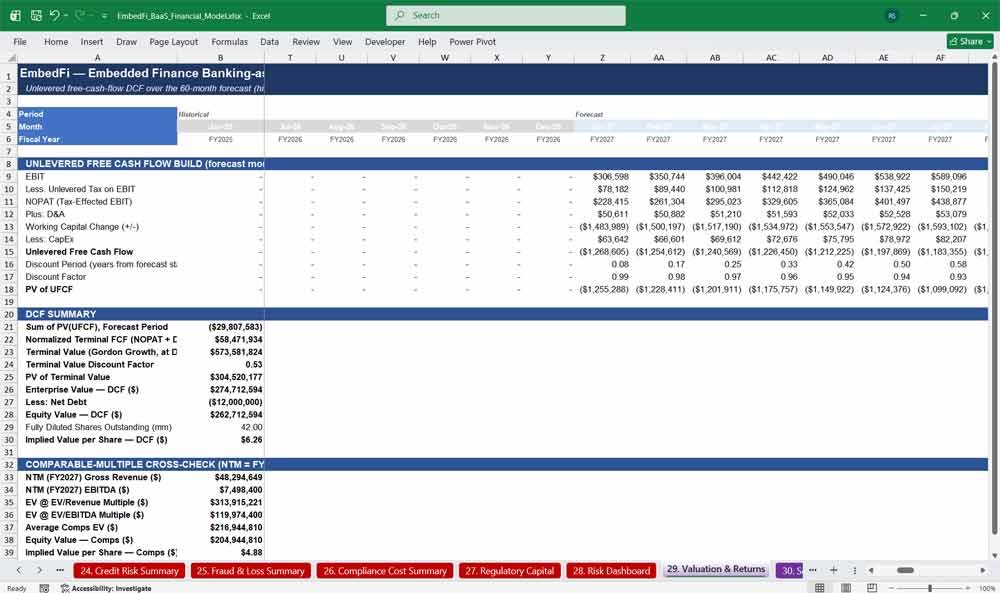
Embedded Platform (BaaS) Valuation
Liquidity & Regulatory Capital
Monitor corporate cash, minimum cash buffers, liquidity coverage, FBO deposits, receivables, and regulatory capital adequacy. The model calculates required capital reserves, capital held, surplus or deficit, and capital adequacy ratios.
Integrated Three-Statement Financial Model
The Platform P&L, Balance Sheet, and Cash Flow Forecast are fully linked to the operational and revenue drivers.
The P&L includes revenue, cost of revenue, headcount, operating expenses, CapEx, depreciation and amortization, NOL carryforwards, taxes, and net income.
The balance sheet includes cash, restricted FBO cash, receivables, PP&E, liabilities, equity, FBO client funds, and retained earnings, with built-in balance checks.
The cash flow forecast uses the indirect method and incorporates net income, D&A, working capital, CapEx, investing activities, and financing activities, with the ending cash balance tied directly to the balance sheet.
KPI, Risk & Management Reporting
Track the KPIs that matter most for an Embedded Finance business, including active accounts, TPV, transaction volume, revenue, take rate, ARPA, EBITDA margin, net income, credit-loss rates, fraud rates, and liquidity metrics.
The Risk Dashboard consolidates credit risk, fraud, compliance, and capital adequacy into a single management view with red/amber/green indicators.
Valuation, Scenarios & Sensitivity Analysis
Evaluate the value and investment returns of the BaaS platform using a discounted cash flow (DCF) valuation with unlevered free cash flow and Gordon Growth terminal value, alongside EV/Revenue and EV/EBITDA comparable-multiple analysis.
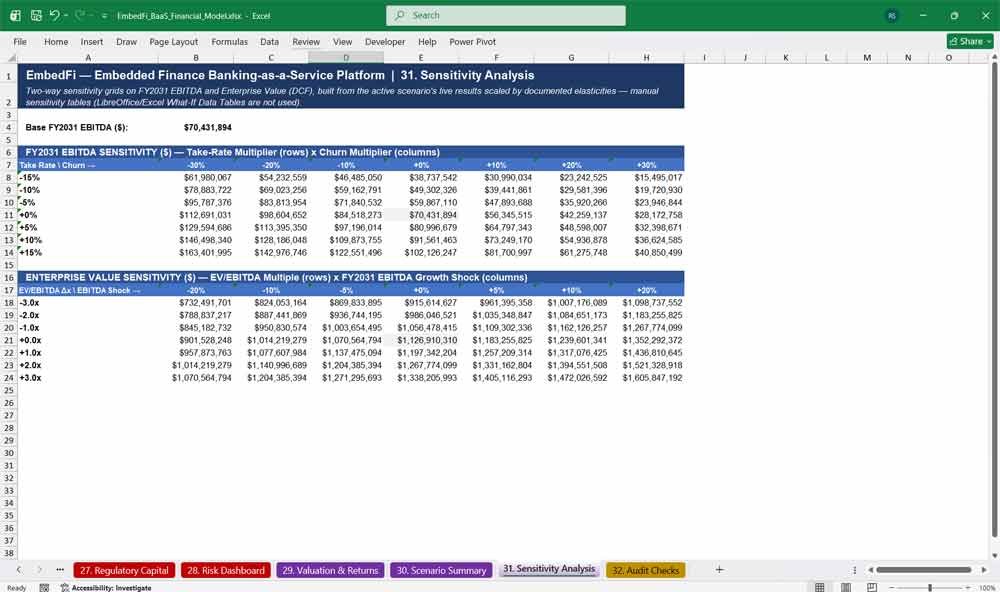
Compare Base, Upside, and Downside scenarios and test the impact of key assumptions through two-way sensitivity analysis covering take rate, churn, valuation multiples, and EBITDA growth.
Audit Checks
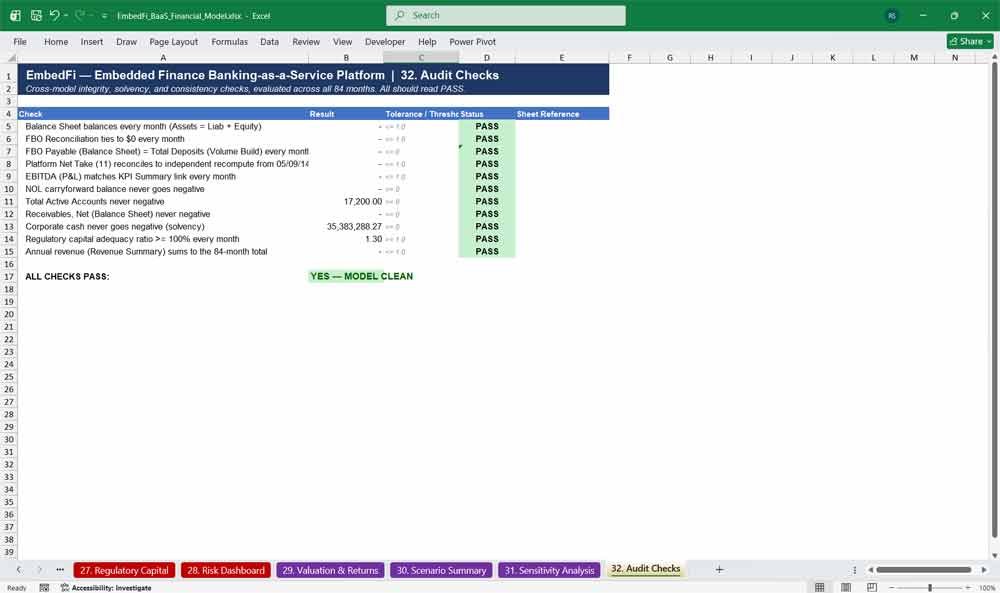
The model includes dedicated integrity checks covering balance sheet balancing, FBO reconciliation, cross-tab consistency, cash, capital, and solvency. A master PASS/FAIL status provides an immediate indication of whether the model is operating correctly.
Who Is This BaaS Financial Model For?
This Embedded Finance Banking-as-a-Service Financial Model is suitable for:
- Embedded Finance platforms
- Banking-as-a-Service providers
- Fintech companies
- Card issuing platforms
- Program managers
- Neobanks
- Lending and BNPL platforms
- Fintech founders and CFOs
- Sponsor banks and banking partners
- Investors and investment teams
- Corporate finance and strategy teams
- Financial advisors and consultants
What Can You Use the Model For?
Use the BaaS financial model to:
- Build a detailed fintech financial forecast
- Forecast Embedded Finance revenue and profitability
- Model sponsor bank economics
- Analyze fintech revenue-share agreements
- Evaluate program-level unit economics
- Forecast interchange revenue and TPV
- Model credit and fraud risk exposure
- Plan compliance and regulatory costs
- Monitor FBO balances and funds flow
- Assess liquidity and capital requirements
- Prepare for fundraising and investor discussions
- Support sponsor bank negotiations
- Evaluate strategic or M&A opportunities
- Build valuation and investment return scenarios
- Prepare board and management reporting
Embedded Banking Frequently Asked Questions
What exactly do I get when I buy this embedded finance financial model?
You get a single, fully built Excel workbook — 32 interconnected tabs covering everything from customer and volume build to interchange revenue, sponsor bank economics, credit risk, fraud, compliance, a complete three-statement model, valuation, and sensitivity analysis. There are no missing links, no placeholder tabs, and no separate add-ons to buy — every formula is live, every tab is populated with a realistic illustrative dataset spanning 2 years of historical months and a 5-year, 60-month forecast, and the whole model is pre-checked for errors so it opens ready to use.
Do I need advanced Excel skills to use this financial model?
No. All of the complexity lives inside the formulas, not in the way you interact with the model. Every input you’re meant to change is clearly marked in blue text with a yellow highlight, every formula cell is black, and every cross-tab link is green, so you always know what’s safe to edit and what will recalculate automatically. If you can type a number into a spreadsheet cell, you can drive this model — and if you want to go deeper, every tab is fully transparent so you can trace any number back to its source.
Is this model built on real company data, or is it a hypothetical example?
The model ships with a fully worked illustrative dataset — five representative fintech programs (a consumer neobank, a gig-payroll prepaid program, a commercial credit card program, a BNPL wallet, and a marketplace prepaid program) with realistic account growth, interchange, and cost assumptions. It is not built from any single real company’s confidential data. That’s by design: it gives you a complete, internally consistent example to learn from and benchmark against, while every assumption cell is yours to overwrite with your own actual numbers in minutes.
Can I change the number of fintech programs, rename them, or add my own?
Yes. The five programs included are a starting structure, not a hard limit — the Model Assumptions, Customer & Volume Build, Revenue Build, and every downstream tab are built with the same repeatable column-and-formula pattern for each program, so renaming an existing program or copying its formulas across to add another follows the same logic already used throughout the workbook. Buyers who want a guided walkthrough of extending the program count typically just copy an existing program’s formula column and adjust the driver inputs.
How does the Base / Upside / Downside scenario toggle actually work?
The Scenario Control tab holds a single dropdown cell. Choosing Base, Upside, or Downside instantly rescales nine key driver multipliers — covering account growth, churn, TPV, average balance, take rate, credit loss, fraud, OpEx growth, and FBO yield — which flow through every dependent tab in the model, from the customer build all the way down to EBITDA, net income, and valuation. There’s no macro, no plugin, and no manual re-entry required; it’s a native Excel formula mechanism that works the moment you open the file.
Will this model actually fit my specific embedded finance or BaaS business?
If your business issues cards, holds customer funds in an FBO account, works with a sponsor bank, shares revenue with fintech clients, or carries any credit or fraud risk, this model’s structure will map onto your business closely. Because every driver — interchange rates, sponsor bank fees, revenue share percentages, credit-loss rates, compliance costs — lives in its own labeled input cell, adapting the model to your actual numbers is a matter of replacing assumptions, not rebuilding formulas. Buyers running single-program card issuing businesses, multi-program BaaS platforms, and lending-heavy embedded finance products have all used this same structure.
Can I use this model for fundraising, board reporting, or a sponsor bank negotiation?
Yes — that’s exactly the use case it was built for. The model includes a dedicated Executive Dashboard and KPI Summary for board and investor updates, a DCF and comparable-multiples Valuation & Returns tab for fundraising conversations, and Sponsor Bank Economics and Fintech Revenue Share tabs built specifically to support fee negotiations and partner discussions. Because the balance sheet balances every month by construction and the workbook includes a dedicated Audit Checks tab confirming eleven separate integrity tests all pass, you can put this model in front of investors or partners with confidence that the numbers actually tie out.
Why Buy This Financial Model?
Building a robust Embedded Finance or Banking-as-a-Service financial model from scratch can require significant time, specialist fintech knowledge, and extensive formula development. This Excel financial model gives you a structured starting point with the complex relationships between customers, TPV, interchange, sponsor bank fees, revenue sharing, risk, compliance, FBO balances, liquidity, financial statements, and valuation already connected. Instead of building dozens of interconnected schedules from the ground up, you can focus on entering your assumptions, adapting the model to your business, and using the outputs to make better financial, strategic, fundraising, and investment decisions.
Further Reading
Neo Bank Financial Model: Fully-linked, formula-driven financial model built to take your Digital Banks actuals through it’s beginnings to it’s commercial offering.
- Fintech-as-a-Service Model: Comprehensive financial planning template designed to help FaaS companies, investors, and financial analysts evaluate the financial feasibility and profitability of your FaaS company.