
Neo Bank Financial Model
Professional 10 Year Neo Bank Financial Model Excel This is a fully-linked, formula-driven financial model built to take your Digital Banks actuals through it’s beginnings to it’s commercial offering. and out to a five-year forward plan. It spans ten fiscal years, all tabs (Cohorts, Revenue Engine, Opex, Funding, Financial Statements, Valuation) read only from Active Assumptions, so the entire model re-flows from one switch.
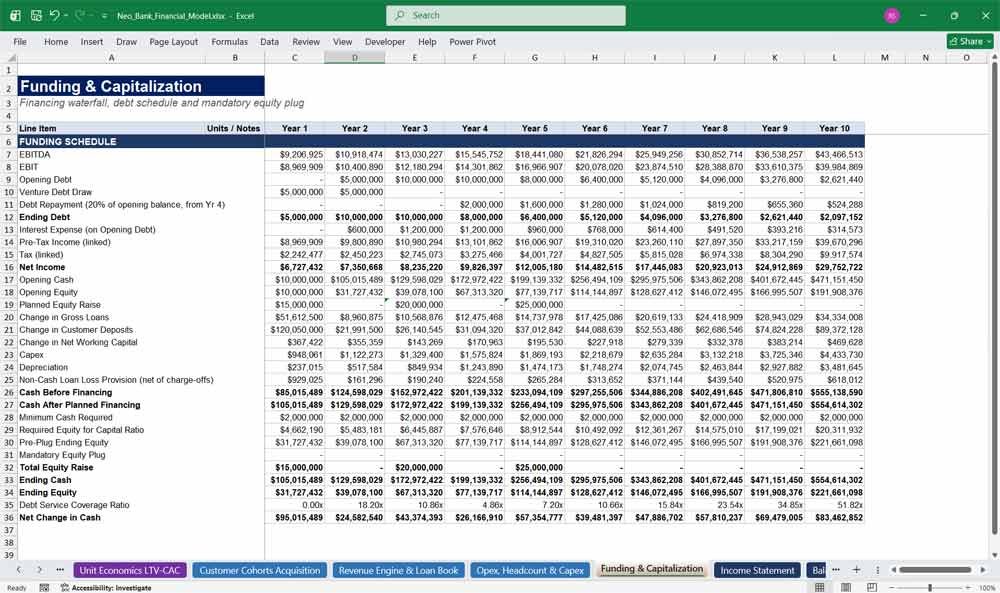
A Funding & Capitalization tab derives the cash and equity roll-forward. Where a scenario would produce a cash shortfall against the Minimum Cash Required (set on Control), the model inserts a Mandatory Equity Plug so the Balance Sheet always balances — check the Balance Sheet Check row, which must equal zero in every period.
10-Year financial model for a Neo Bank
The front page of the workbook — a title screen with model metadata (currency, base year, live scenario link, version) and a quick-reference guide listing what every other tab contains, so a new reader can navigate without opening each sheet.
Highlights Of The 23 Tab Model
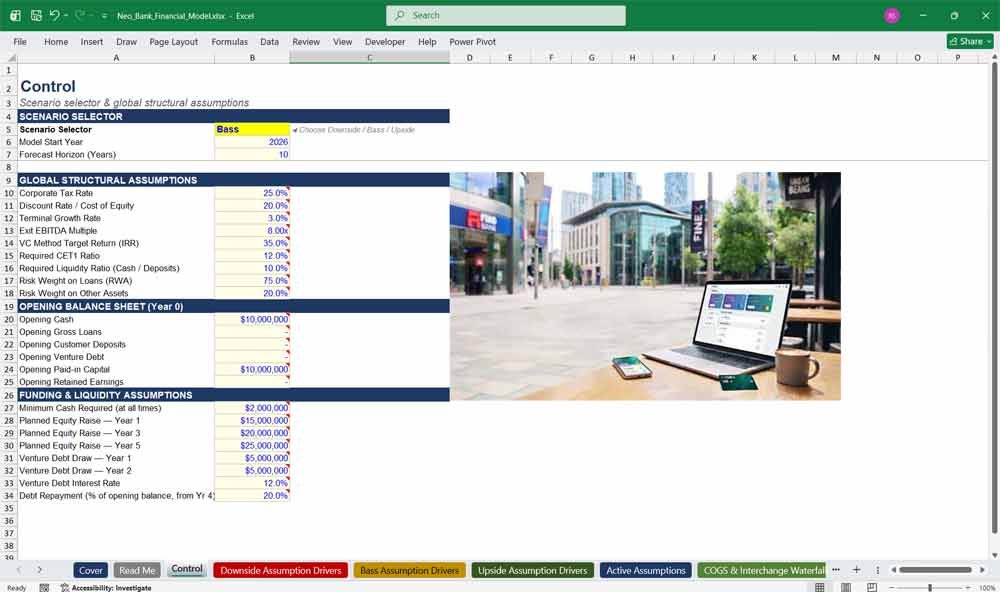
Control
The cockpit of the model — one dropdown selects the active scenario, and every global, non-scenario-varying assumption (tax rate, discount rate, capital ratios, opening balance sheet, financing schedule) lives here in one place.
- Scenario Selector dropdown (Downside / Bass / Upside) driving the entire workbook
- Opening balance sheet inputs (cash, debt, equity, deposits)
- Financing schedule inputs (planned equity raises, venture debt draws, repayment rate)
- Regulatory thresholds (required CET1, liquidity ratio, risk weights)
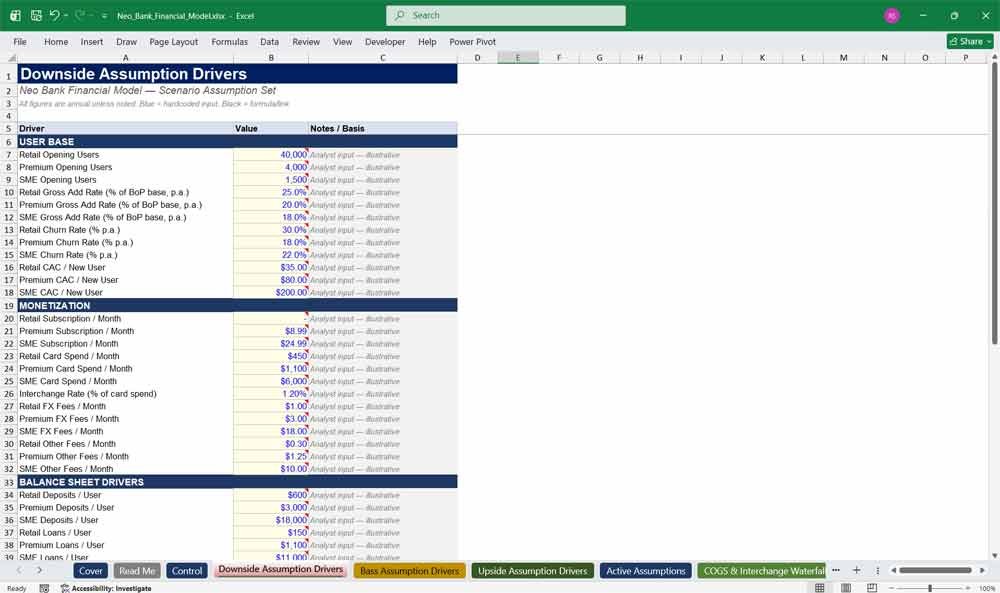
Downside / Bass / Upside Assumption Drivers
Three parallel, identically-structured input sheets holding every user-base, monetization, balance-sheet, and operating-model driver you specified, each calibrated to a distinct stress case — Downside assumes weaker growth and higher risk costs, Upside assumes stronger economics, Bass sits in between as the base case.
- Identical row structure across all three for clean comparison
- All growth/churn/CAC/monetization/balance-sheet drivers you listed, fully populated
- Additional “model support” block (salaries, cloud %, fraud %, capex %) clearly separated and labeled
- Illustrative seed/Series-A-stage starting values, ready to be overwritten
Active Assumptions
The single live feed for the rest of the model — every row here is a formula that reads whichever scenario is selected on Control, so nothing downstream ever touches the three scenario tabs directly.
- IF-formula per row selecting Downside/Bass/Upside based on Control!B5
- Green font signaling cross-sheet links, not hardcoded inputs
- Sole source of truth for every other calculation tab
Balancing The Neo Bank
Loan Book & Amortization
A dedicated roll-forward of the lending book — tracks how the loan balance moves from origination through repayment, charge-off, and provisioning each year, and reconciles to the target loan balance driven by user growth.
- Opening/closing gross loan balance roll-forward
- Origination computed as a plug to hit the Revenue Engine’s target loan stock
- Allowance for loan losses roll-forward (provision less charge-offs)
- Net loans (gross minus allowance) feeding the Balance Sheet
Working Capital & Tax
Handles the non-obvious balance-sheet items a card business accumulates — prepaid card stock, capitalized software, network settlement receivables, and payables — and computes the tax expense that flows into the Income Statement and Funding tab.
- Four working-capital line items with clearly documented illustrative bases
- Change in Net Working Capital feeding the cash flow build
- Tax expense calculation (no NOL carryforward modeled, flagged as such)
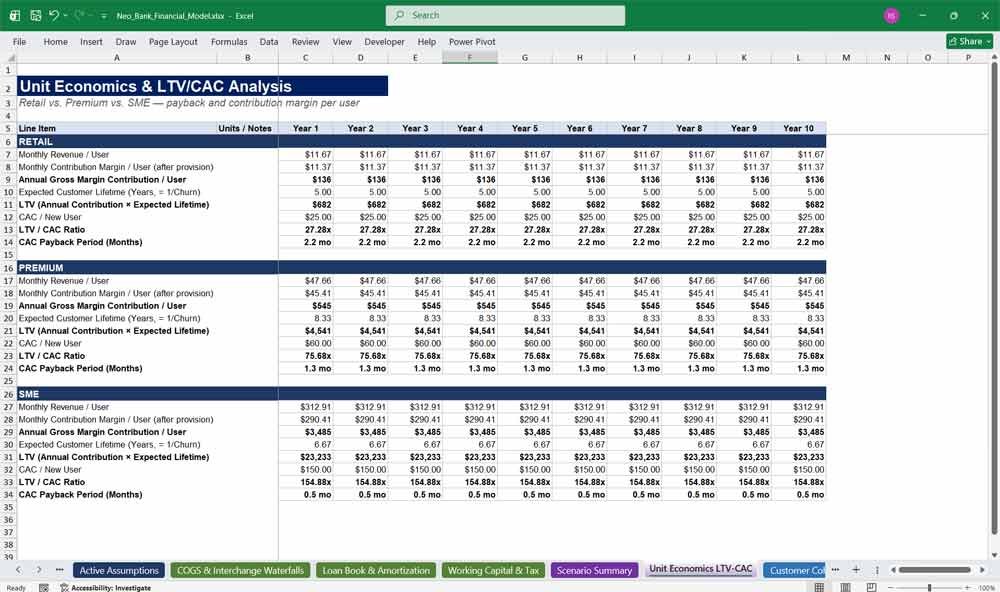
Unit Economics LTV-CAC
Breaks down customer economics by segment — for Retail, Premium, and SME separately, it builds monthly revenue and contribution margin per user up to LTV, CAC payback, and LTV/CAC ratio.
- Segment-by-segment monthly revenue and contribution margin per user
- LTV computed from annual contribution × expected customer lifetime (1/churn)
- LTV/CAC ratio and CAC payback period in months, per segment, per year
Neo Bank Model Three-Statement Engine
Opex, Headcount & Capex
Builds the cost base — headcount scales with user growth (Ops/Risk FTEs tied to users-per-FTE ratios), payroll and other opex layer on top, and the tab bridges all the way down to EBITDA and EBIT.
- Headcount by function, with Ops/Risk FTE driven by total user count
- Full payroll, benefits, marketing, cloud, fraud, and rent build
- Capex and a rolling 4-year straight-line depreciation schedule
- EBITDA, EBIT, EBITDA margin, and cash EBITDA after capex
Income Statement
The consolidated P&L, fully linked line-by-line to the Revenue Engine, Opex, and Funding tabs — no hardcoded figures, just a clean roll-up from revenue to net income.
- Revenue-to-EBITDA-to-Net-Income bridge in standard P&L format
- Every line linked, not recalculated, from its source tab
- atches exactly the line items you specified
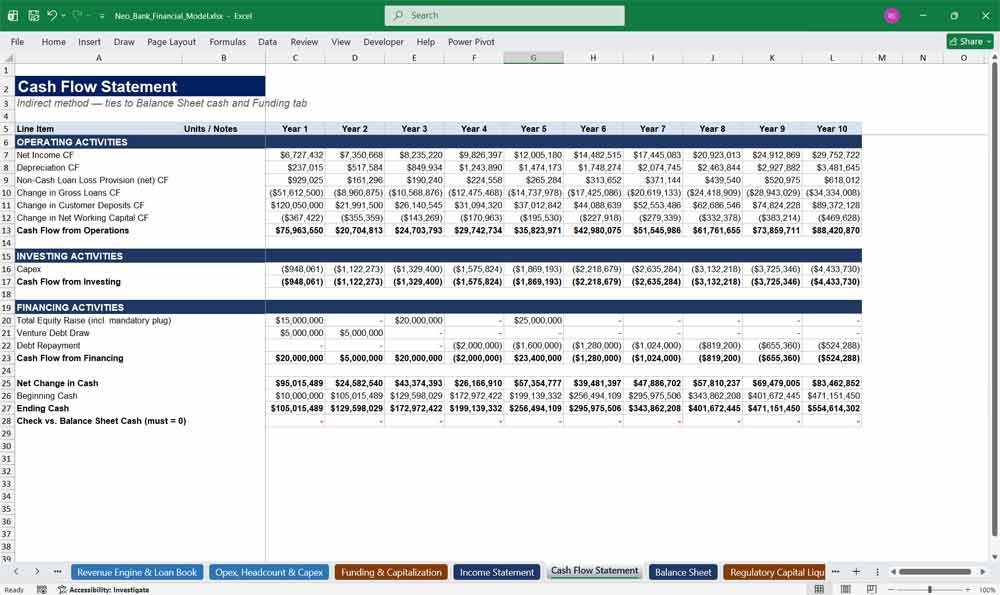
Cash Flow Statement
The indirect-method cash flow statement, reconciling net income back to the change in cash — includes a non-cash provision addback that was essential to getting the balance sheet to actually balance.
- Operating, investing, and financing sections in standard format
- Non-cash loan-loss provision addback (net of charge-offs)
- Check row confirming ending cash ties exactly to the Funding tab
Balance Sheet
The fully linked balance sheet — every asset, liability, and equity line ties back to its driving tab, and it balances to zero in every single year because of the equity plug mechanism on Funding.
- Assets: cash, gross loans net of allowance, net PP&E, working-capital assets
- Liabilities: customer deposits, venture debt, accounts payable
- Equity: paid-in capital and retained earnings rolled forward independently
- Balance Sheet Check row (proven to equal exactly zero, all 10 years, all scenarios)
Regulatory Capital Liquidity
Monitors the bank’s capital and liquidity health against the thresholds you’d expect a regulator to enforce — risk-weighted assets, CET1 ratio, leverage, and liquidity, each with a pass/fail flag.
- Risk-weighted assets computed from loans and PP&E
- CET1 ratio, leverage ratio, and liquidity ratio, year by year
- Capital required, capital surplus/deficit, and capital headroom
- Automatic PASS/FAIL flags against your Control-tab thresholds
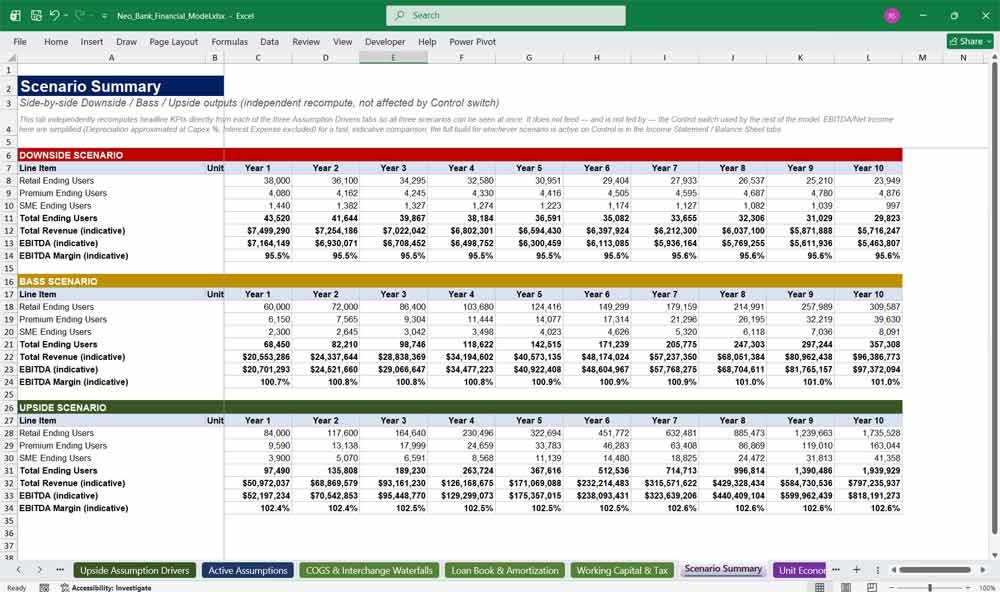
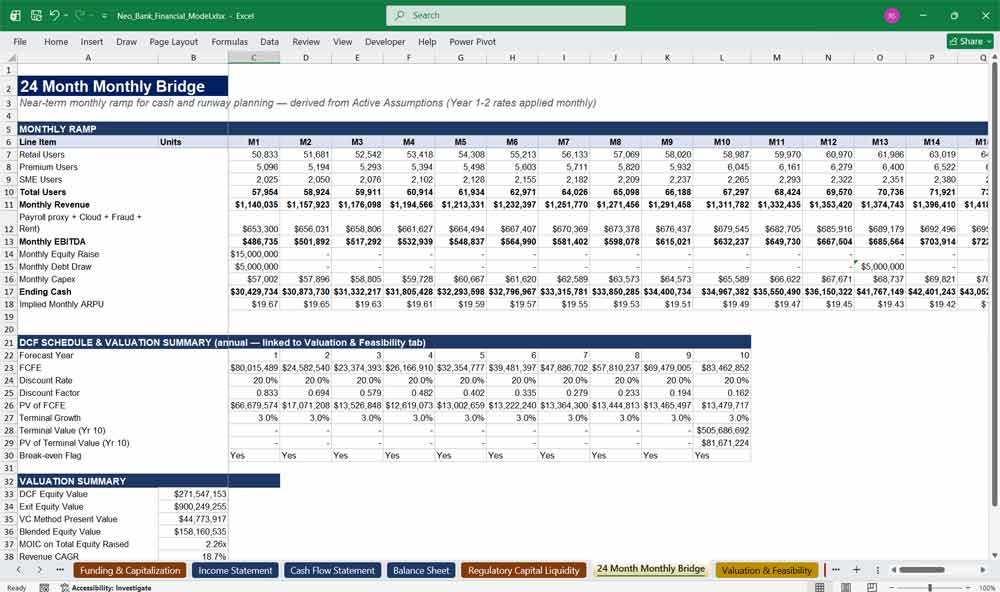
24 Month Monthly Bridge
A near-term, month-by-month view for cash and runway planning — takes the annual Active Assumptions and applies them monthly, so you can see the ramp in the first two years in much finer detail than the annual tabs allow.
- Monthly user, revenue, and EBITDA ramp for 24 months
- Monthly ending cash roll-forward, including planned raises and debt draws
- A linked copy of the annual DCF schedule and valuation summary for quick reference in the same view
Neo Bank Valuation & Sensitivity
Valuation & Feasibility
Puts a value on the business three different ways and blends them — a full 10-year DCF with terminal value, an EBITDA-multiple exit, and a VC-method present value — then derives MOIC, revenue CAGR, and break-even year.
- Full DCF schedule with discount factors and terminal value
- Exit-multiple and VC-method valuations computed independently
- Blended equity value, MOIC on total equity raised, and automatic break-even year detection
Sensitivity & Tornado
Stress-tests the model’s most consequential drivers one at a time — cost of deposits, loan yield, interchange rate, NPL ratio, and discount rate — showing exactly how much each swing moves NIM, EBITDA, or valuation.
- Four NIM sensitivities (cost of deposits and loan yield, ±100bps)
- Four EBITDA sensitivities (interchange rate, NPL ratio)
- Two valuation sensitivities (discount rate ±200bps)
- Tornado bar chart visualizing the EBITDA sensitivities
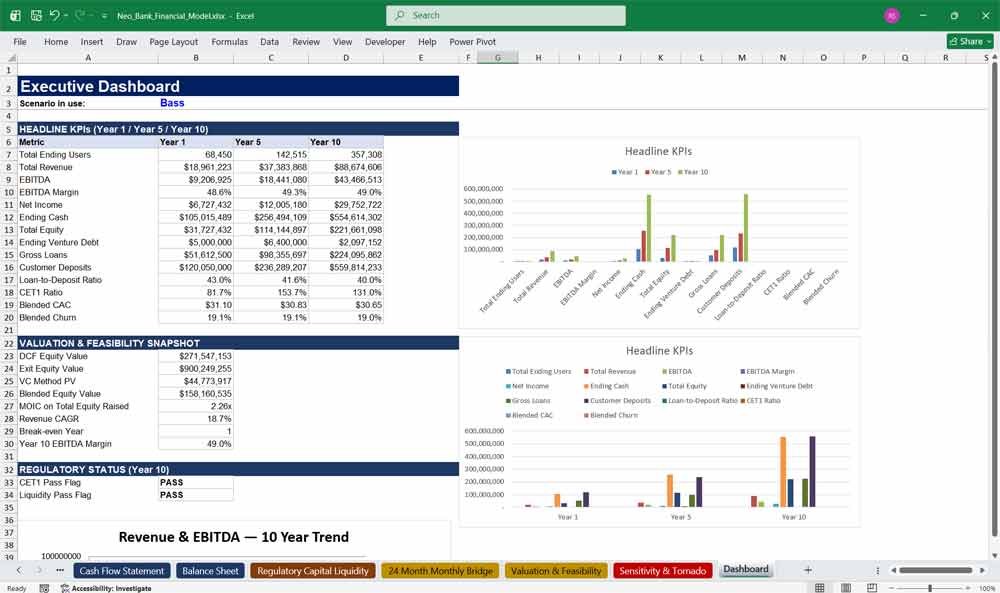
Dashboard
The executive summary — a one-page view of headline KPIs at Year 1/5/10, the valuation snapshot, regulatory pass/fail status, and two charts (revenue/EBITDA trend and user growth by segment) for whichever scenario is currently selected.
- Live scenario indicator pulled straight from Control
- 14 headline KPIs across three time horizons
- Valuation and regulatory snapshots in one place
- Revenue/EBITDA trend chart and stacked user-growth-by-segment chart
Value Your Neo Bank With A DCF
A Full Neobank DCF (Discounted Cash Flow) schedule projects a digital bank’s future unlevered free cash flows—typically over a 5 to 10-year forecast horizon—and discounts them back to the present value using the Weighted Average Cost of Capital (WACC) or a specialized cost of equity. Because fast-growing neobanks often experience heavy initial losses due to high customer acquisition costs (CAC) before scaling into profitability, the schedule meticulously applies a discount factor.
Each specific period’s cash flow progressively dilutes the financial weight of further-out years. To capture the neo bank’s worth beyond this explicit forecast window, a terminal value (TV) is calculated at the end of the schedule—most commonly using the Gordon Growth Method for steady-state perpetual growth or an Exit Multiple Method based on forward-looking Price-to-Earnings (P/E) or Price-to-Tangible-Book-Value (P/TBV) industry benchmarks. This terminal value is then multiplied by the final year’s discount factor and added to the sum of the discounted discrete cash flows, ultimately yielding the total enterprise or equity value of the neobank.
Further Reading
Fintech-as-a-Service Financial Model: Comprehensive financial planning template designed to help FaaS companies, investors, and financial analysts evaluate the financial feasibility and profitability of your FaaS company.
- Embedded Finance Banking-as-a-Service Model: An Embedded Finance Financial Model providing a detailed framework for forecasting the operational and financial performance of a Banking-as-a-Service platform.