
Construction Company Financial Model
This 20-Year, 3-Statement Construction Company Financial Model in Excel provides a structured framework, Discounted Cash Flow (DCF) with Terminal Value, Sensitivity Analysis, and WACC, to analyze the financial health and project profitability.
Financial Model for a Construction Company
130 spreadsheets of data provide a structured framework to analyze the financial health, project profitability, and overall sustainability of your company.
Easily track Deposits and Milestone Payments in color-coded tabs and cells on multiple projects. Individual cell columns for costings examples such as concrete, steel, lumber, drywall, doors, and windows, view equipment hire expenditure from cranes and diggers, to power tools. View subcontractor fees, such as HVAC installation and plumbing, and track site preparation costs like land clearing, demolition, excavation, and grading. View temporary utility expenditure and waste recycling costs, amounts spent on permits and legal fees such as structural, civil, and mechanical, monitor contingency funding like weather delays and unstable soils, and view money spent on Insurance and Bonds for accidents and performance bonuses. Over 140 Excel tabs.
It includes three core financial statements:
- Income Statement (Profit & Loss Statement)
- Cash Flow Statement
- Balance Sheet
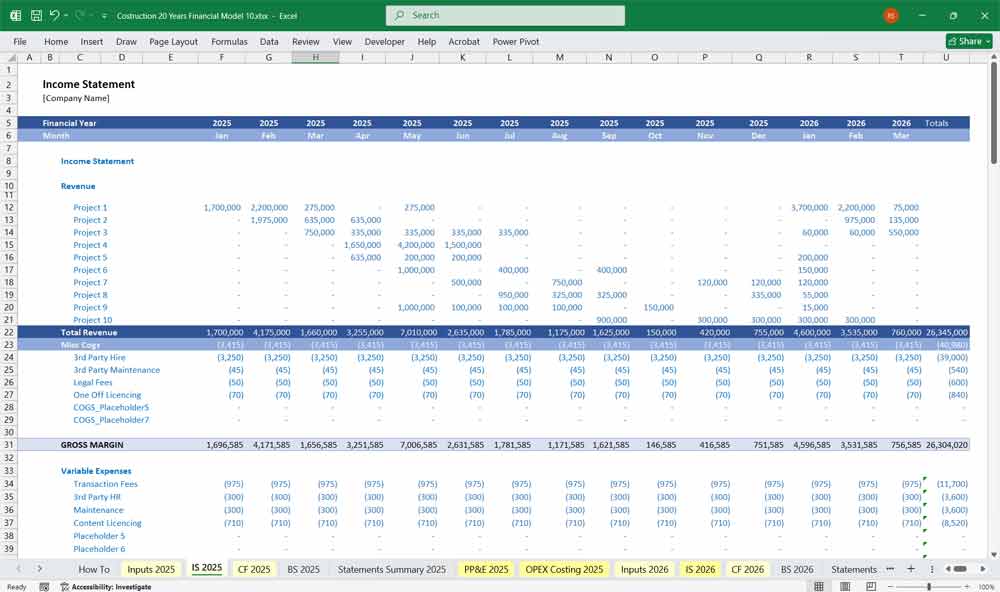
Income Statement (P&L Statement)
The income statement for a construction company reflects revenue, costs, and profitability over a given period. It follows this structure:
A. Revenue (Top Line)
- Construction Contracts Revenue – Revenue from projects undertaken, including residential, commercial, and infrastructure projects.
- Change Orders & Extra Work Revenue – Additional revenue from contract modifications.
- Consulting & Design Fees – Income from architectural and design services.
- Retentions Receivable – Portion of revenue withheld until project completion.
- Other Income – Revenue from equipment rentals, subcontracting work, or government grants.
B. Cost of Goods Sold (COGS)
- Direct Materials – Cost of raw materials (concrete, steel, wood, etc.).
- Direct Labor – Wages for workers, subcontractors, and site supervisors.
- Equipment & Machinery Costs – Depreciation, leasing, or fuel costs for machinery.
- Subcontractor Costs – Payments to external contractors.
- Site Overheads – Security, temporary facilities, utilities.
C. Gross Profit
Gross Profit = Revenue – COGS
Indicates profitability before operating expenses.
D. Operating Expenses
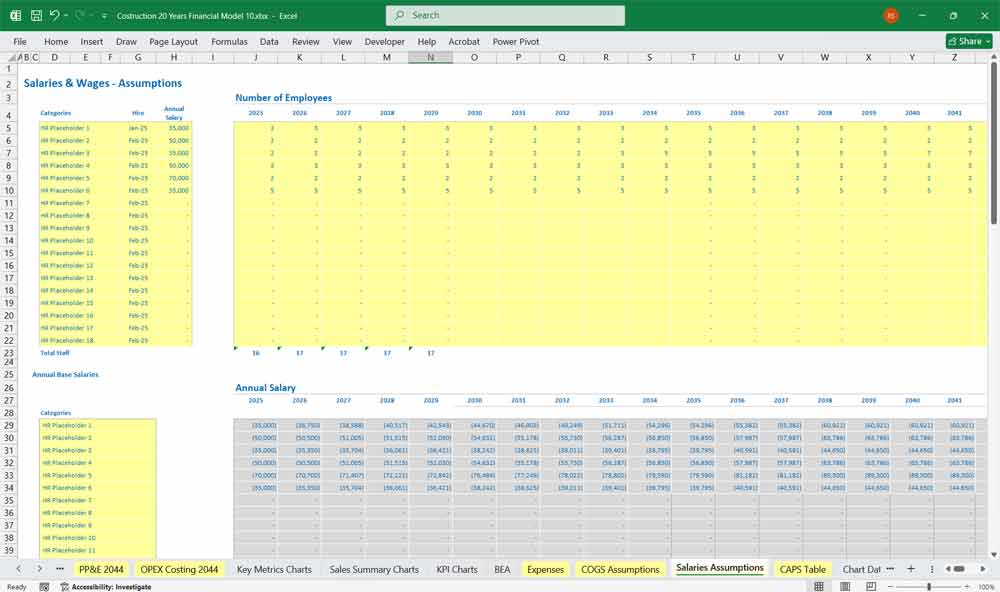
- Salaries & Wages – Administrative and corporate staff salaries.
- Office Expenses – Rent, utilities, supplies.
- Marketing & Business Development – Advertising, client acquisition.
- Legal & Compliance Costs – Licenses, insurance, regulatory fees.
- Depreciation & Amortization – Non-cash expenses for asset wear and tear.
E. Operating Profit (EBIT)
EBIT = Gross Profit – Operating Expenses
Represents earnings before interest and taxes.
F. Interest & Taxes
- Interest Expense – Loans and credit facility interest payments.
- Taxes – Corporate tax, VAT, or industry-specific taxes.
G. Net Profit (Bottom Line)
Net Profit = EBIT – Interest – Taxes
Indicates final profitability after all expenses.
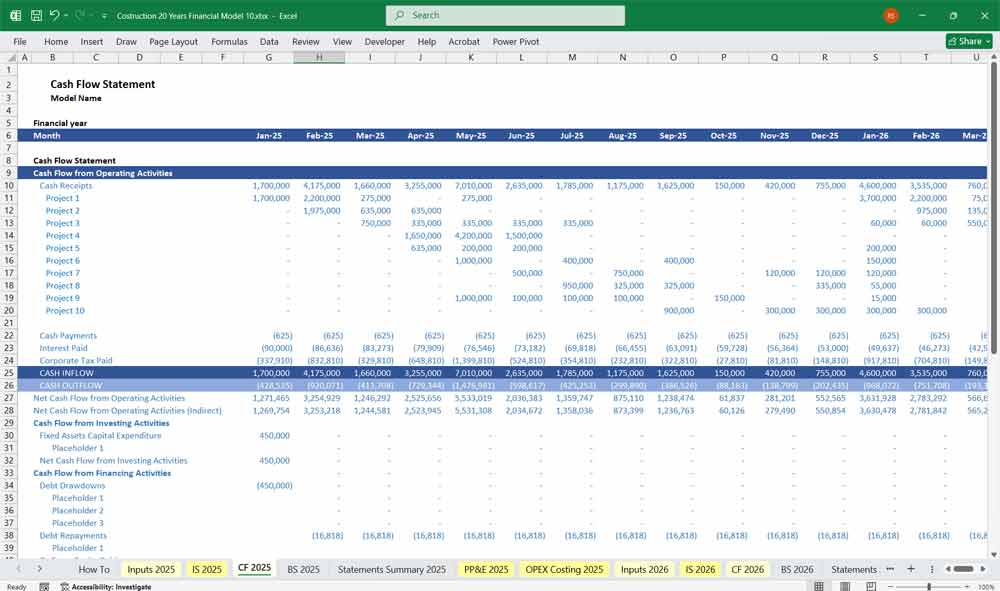
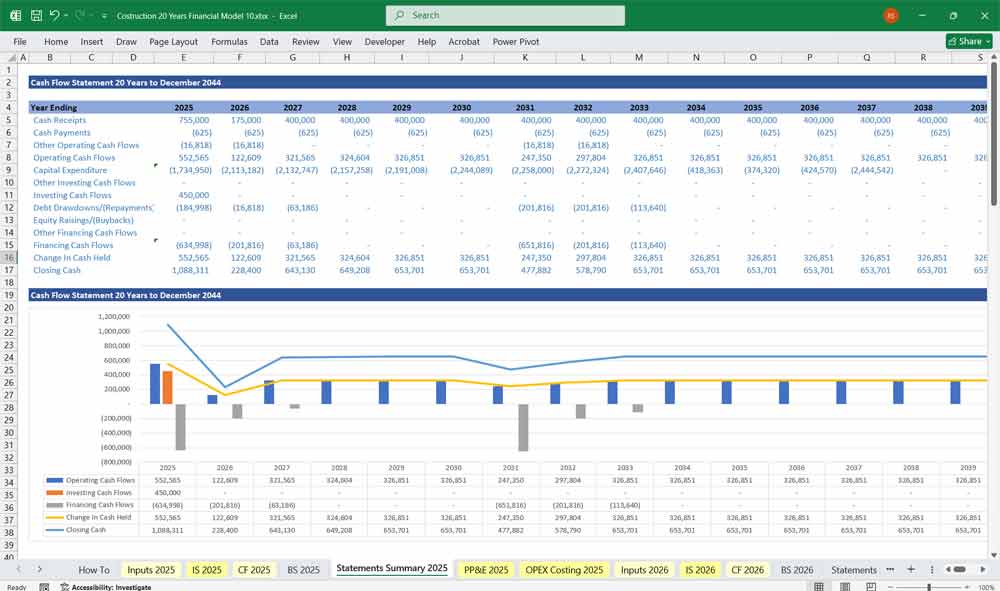
Construction Company Financial Model Cash Flow Statement
The cash flow statement tracks cash inflows and outflows, divided into three main sections:
A. Cash Flow from Operating Activities
- Net Income – From the income statement.
- Adjustments for Non-Cash Items – Depreciation & amortization.
- Changes in Working Capital:
- Accounts Receivable – Cash impact of unpaid invoices.
- Accounts Payable – Payments due to suppliers.
- Inventory – Purchase and usage of materials.
- Retentions Payable/Receivable – Held-back amounts in construction contracts.
B. Cash Flow from Investing Activities
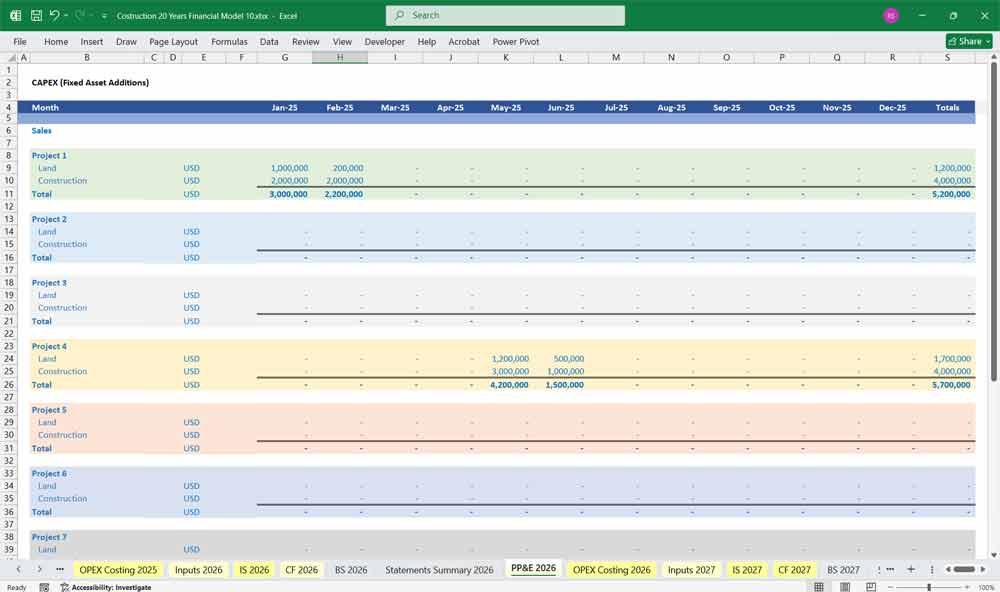
- Capital Expenditures (CapEx) – Purchase of land, buildings, and machinery.
- Sale of Fixed Assets – Proceeds from selling old machinery or real estate.
- Investments in Joint Ventures – Funds allocated to new projects.
C. Cash Flow from Financing Activities
- New Debt Issuance – Loans, bonds, or credit lines secured.
- Debt Repayment – Paying down existing loans.
- Equity Issuance – New shares issued for capital.
- Dividends Paid – Distributions to shareholders.
Final Cash Flow Position:
Net Cash Flow = Operating CF + Investing CF + Financing CF
Represents the actual cash available for future operations.
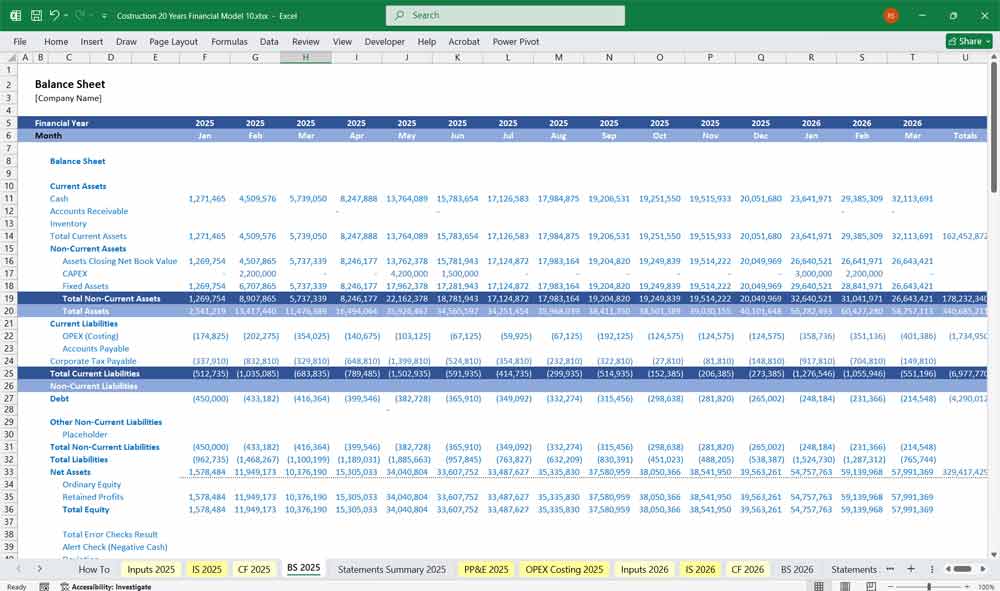
Construction Company Financial Model Balance Sheet
The balance sheet provides a snapshot of the company’s financial position at a given time.
A. Assets
1. Current Assets (Short-Term)
- Cash & Cash Equivalents – Bank balances and liquid investments.
- Accounts Receivable – Money owed by clients.
- Inventory & Work-in-Progress (WIP) – Raw materials and ongoing projects.
- Retentions Receivable – Funds withheld until project milestones.
- Prepaid Expenses – Rent, insurance, and supplier advances.
2. Non-Current Assets (Long-Term)
- Property, Plant & Equipment (PPE) – Machinery, construction tools.
- Land & Buildings – Real estate owned.
- Intangible Assets – Goodwill, patents, brand recognition.
- Long-Term Investments – Stakes in other construction firms or infrastructure projects.
B. Liabilities
1. Current Liabilities (Short-Term)
- Accounts Payable – Due payments to suppliers.
- Short-Term Loans – Credit lines, overdrafts.
- Taxes Payable – Corporate and VAT taxes owed.
- Accrued Expenses – Unpaid salaries, utilities, and operational costs.
- Retentions Payable – Amounts owed to subcontractors upon project completion.
2. Non-Current Liabilities (Long-Term)
- Long-Term Loans & Bonds – Bank loans for large-scale projects.
- Leases – Equipment or office rental obligations.
- Deferred Tax Liabilities – Taxes owed due to accounting differences.
C. Equity
- Share Capital – Funds from equity investors.
- Retained Earnings – Profits reinvested in the business.
- Additional Paid-in Capital – Extra funds raised beyond nominal share value.
- Shareholder Loans – Capital injections from owners.
Final Balance Sheet Equation:
Assets = Liabilities + Equity
Ensures financial equilibrium.
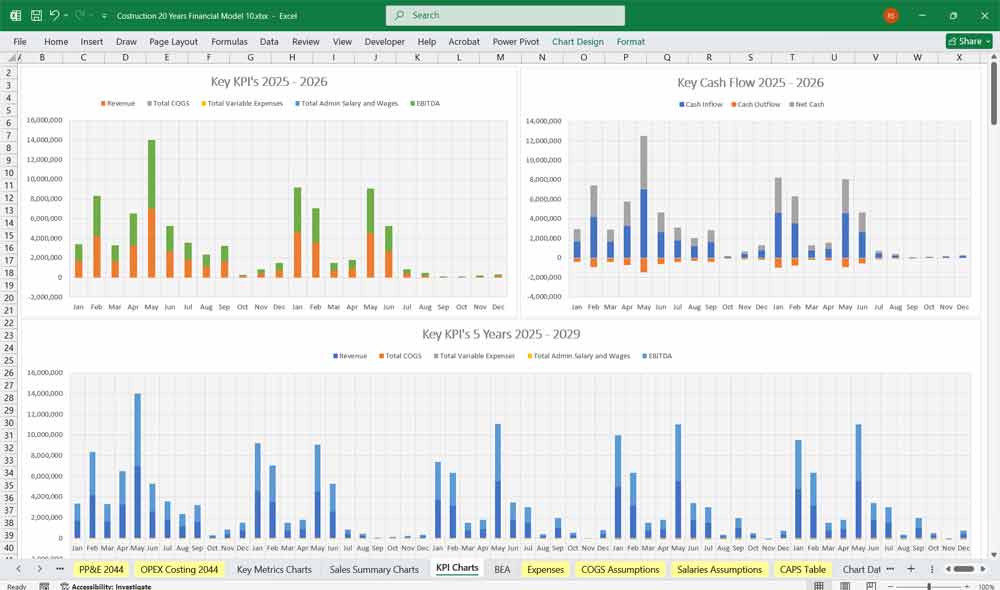
Key Metrics & Ratios for a Construction Financial Model
To analyze financial health, these ratios can be tracked:
- Gross Margin (%) = (Gross Profit / Revenue) × 100
- Operating Margin (%) = (EBIT / Revenue) × 100
- Net Profit Margin (%) = (Net Profit / Revenue) × 100
- Current Ratio = Current Assets / Current Liabilities (Measures liquidity)
- Debt-to-Equity Ratio = Total Debt / Total Equity (Measures leverage)
- Return on Assets (ROA) = Net Income / Total Assets
- Return on Equity (ROE) = Net Income / Shareholder Equity
- Cash Conversion Cycle (CCC) = Days Inventory Outstanding + Days Sales Outstanding – Days Payable Outstanding
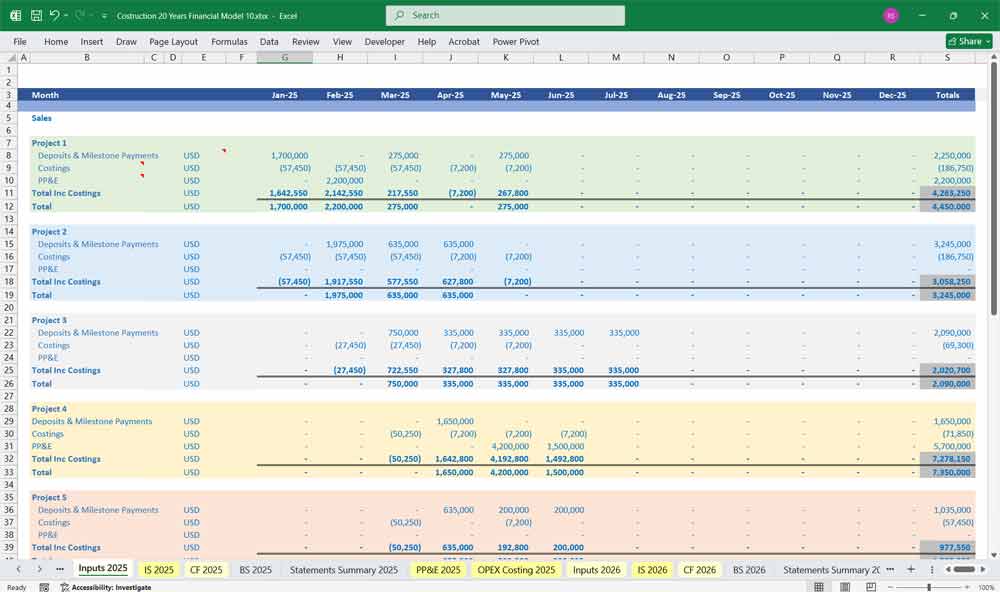
Construction Model Inputs Tab
Inputs for Deposits and Milestone Payments
Costings, this link to the “OPEX Costings” tab where financial details of materials, equipment hire, subcontractor fees, etc are added.
- PP&E is where you can total values from your physical assets used to generate revenue and operate the business, such as buildings, machinery, vehicles, and land.
Construction Model PP&E Tab
Monetary inputs for the value of land bought by your company.
Inputs for buildings built by you for sale later.
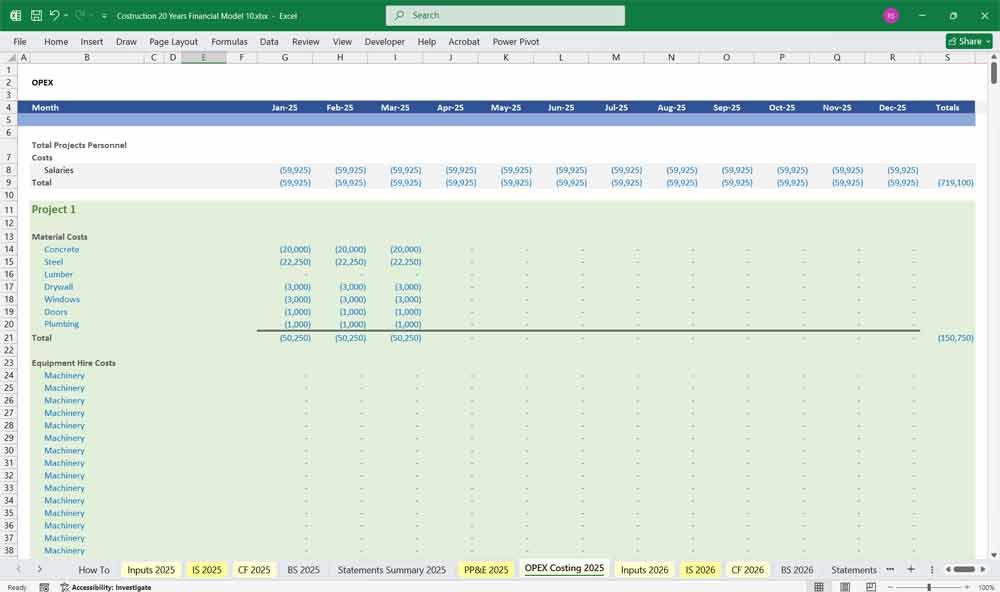
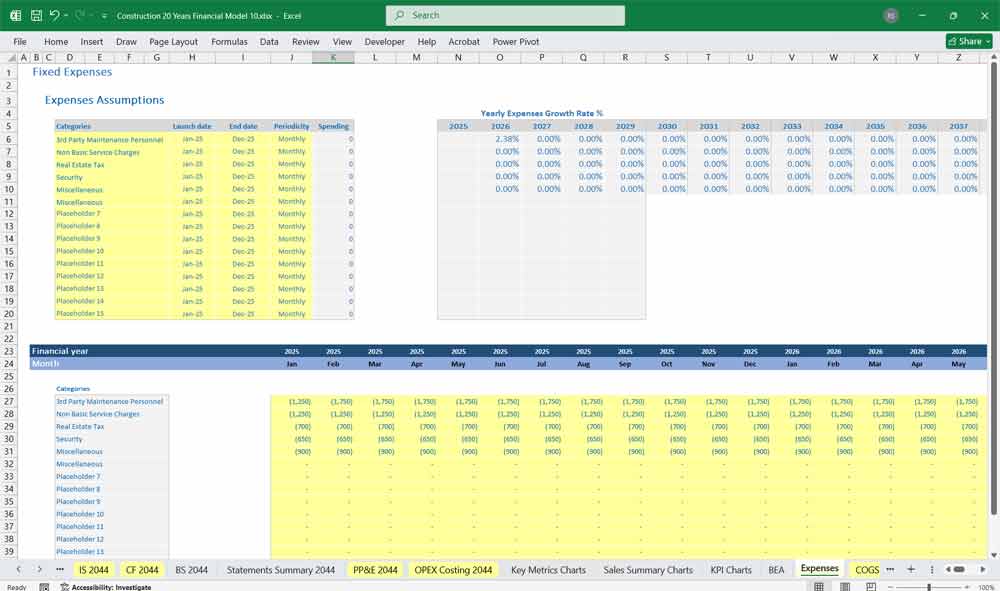
OPEX Costing Tab In The Construction Model
Total personnel costs for your projects
Material costs such as concrete, timber, steel, drywall, windows, doors, etc.
- Equipment hire costs, add values here for all your equipment, from cranes and bulldozers to electric drills.
- Subcontractor fees, like HVAC and landscaping.
- Site preparation costs, land clearing, demolition, and excavation.
- Temporary utilities
- Waste recycling and 3 more sections
Construction: Residential Housing Developments
This financial model can be used for residential housing developments as it can help developers, investors, and lenders evaluate a project’s financial feasibility and potential. By building a detailed spreadsheet, it can forecast all the project’s costs and revenues from beginning to end, including land acquisition, construction costs, financing, and future sales.
Construction Of Retail Complexes
Use it for evaluating profitability and managing risk. It’s a dynamic spreadsheet that projects all the revenues and costs of the development over a period of time. The model also incorporates development costs like land acquisition, construction, and financing fees.
Construction Of Industrial Warehouses
Use he financial model for an industrial warehouse development, show investors, and lenders a detailed forecast of the project’s financial performance by accounting for all costs, from land acquisition and construction to operating expenses like maintenance and property taxes.
Construction Of Healthcare Facilities
Tis model is an indispensable tool for the construction of a healthcare facility, as it provides a dynamic, data-driven framework to evaluate the project’s viability and guide decision-making. It integrates the significant capital costs of construction, equipment, and staffing with complex revenue projections based on service offerings, payer mix, and utilization rates. This allows stakeholders to stress-test assumptions, secure financing by demonstrating a clear path to profitability.
Construction Of Educational Institutions
This workbook is critical for constructing an education facility; it can translate the capital-intensive building process into a clear roadmap for financial viability and strategic planning. It integrates massive upfront costs—from land acquisition and construction to outfitting classrooms and technology—with long-term revenue projections based on student enrollment, tuition fees, and funding sources. This allows stakeholders to secure necessary financing, optimize the project’s scope and phasing to stay within budget,
Construction Of Hospitality Resorts
Constructing a hospitality resort? This model can transform a complex vision into a quantifiable blueprint for success. It integrates high construction costs, pre-opening expenses, and financing terms with detailed revenue forecasts based on occupancy rates, average daily rates (ADR), and ancillary income from amenities like spas and restaurants. This enables developers to stress-test variables, secure investment by demonstrating a clear return on investment (ROI), and make critical design and phasing decisions to ensure the completed resort is not only luxurious but also operationally efficient and financially profitable.
Construction Of Infrastructure Projects
This financial model can be crucial for the construction of an infrastructure project like a bridge or road, it can provide a comprehensive framework to evaluate its long-term economic feasibility and secure necessary funding. It integrates immense upfront capital costs for materials, labor, and permits with complex long-term revenue streams, which may include tolls, public-private partnership (PPP) availability payments, or projected economic benefits from reduced travel time. This allows government entities and private investors to analyze different funding scenarios, assess the project’s lifecycle costs against its public value, and ensure the structure is not only engineered to last but is also financially sustainable throughout its decades-long operational life.
Construction Of Sports Complexes
This model can be used to integrate substantial construction costs for specialized features like fields, courts, and ice rinks with diverse revenue projections from ticket sales, league fees, concessions, corporate partnerships, and community event rentals. This enables stakeholders to optimize the facility’s design for revenue generation, secure funding by demonstrating a clear path to operational sustainability, and ensure the complex is not only a community asset but also a financially self-sufficient enterprise after completion.Construction Of High-Rise Buildings
It is indispensable as an aid in the construction of a high-rise building, as it provides a dynamic framework to assess the immense capital outlay against the project’s potential for profitability. It meticulously integrates towering construction costs, land acquisition, financing expenses, and extended timelines with sophisticated revenue forecasts from pre-sales, leasing rates, and commercial space absorption. This allows developers and investors to analyze the project’s financial feasibility under various market conditions, secure debt and equity financing by demonstrating a strong return on investment (ROI)Construction Of Renewable Energy Facilities
The construction process involves meticulous site assessments, environmental impact studies, and regulatory compliance to minimize ecological disruption while maximizing efficiency. A financial model can help in the development of these facilities which often include creating access roads, installing monitoring equipment, and establishing grid connectivity to ensure seamless energy distribution to the broader community.
Valuing a construction company with Discounted Cash Flow (DCF), & Weighted Average Cost of Capital (WACC)
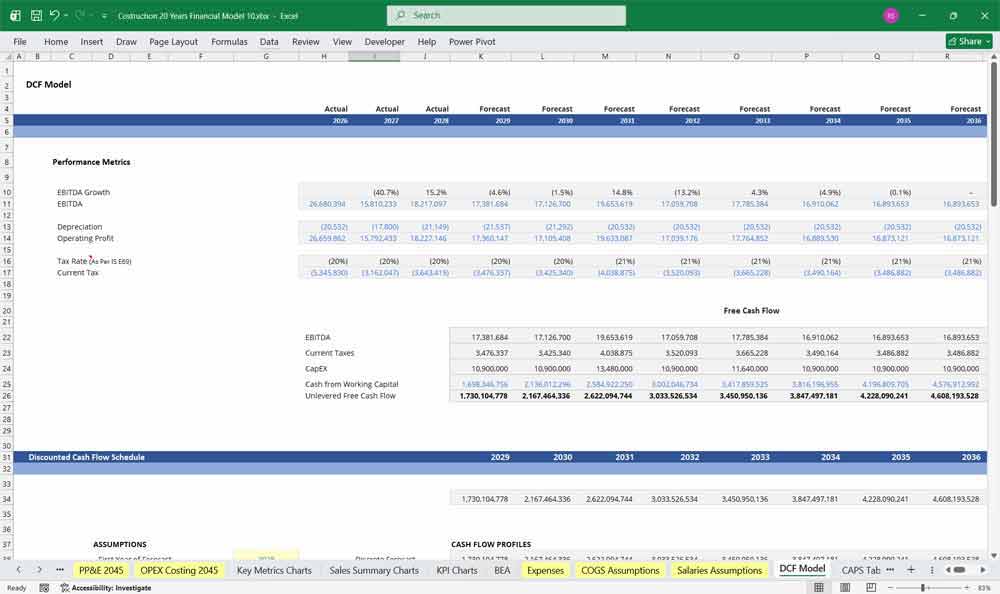
DCF: Valuing the Project Pipeline and Working Capital
This 20-year Discounted Cash Flow (DCF) analysis for a construction company is less about steady “annuity-style” income and more about the “lumpy” cycle of winning and executing a backlog of contracts. The model balances the revenue recognized from percentage-of-completion accounting against the actual, often volatile, cash inflows and outflows. Over a two-decade horizon, the DCF projects a “normalized” win rate for new bids and accounts for heavy working capital swings—where the company must often fund labor and materials long before the final milestone payment arrives. The resulting Net Present Value (NPV) represents the firm’s ability to consistently turn “blueprints into bottom-line cash” across multiple economic cycles.
WACC: Pricing High Beta and Operational Leverage
The Weighted Average Cost of Capital (WACC) for a construction firm typically carries a higher risk premium to account for the industry’s extreme sensitivity to the broader economy. Because construction is a high-beta sector, the cost of equity is elevated to compensate investors for the risk of “cyclical whiplash”—where a single recession can dry up the project pipeline. Furthermore, the WACC must reflect the cost of the surety bonds and performance guarantees required to bid on major infrastructure. This higher hurdle rate ensures that the valuation appropriately “punishes” future cash flows for the operational leverage and thin margins that leave little room for error.
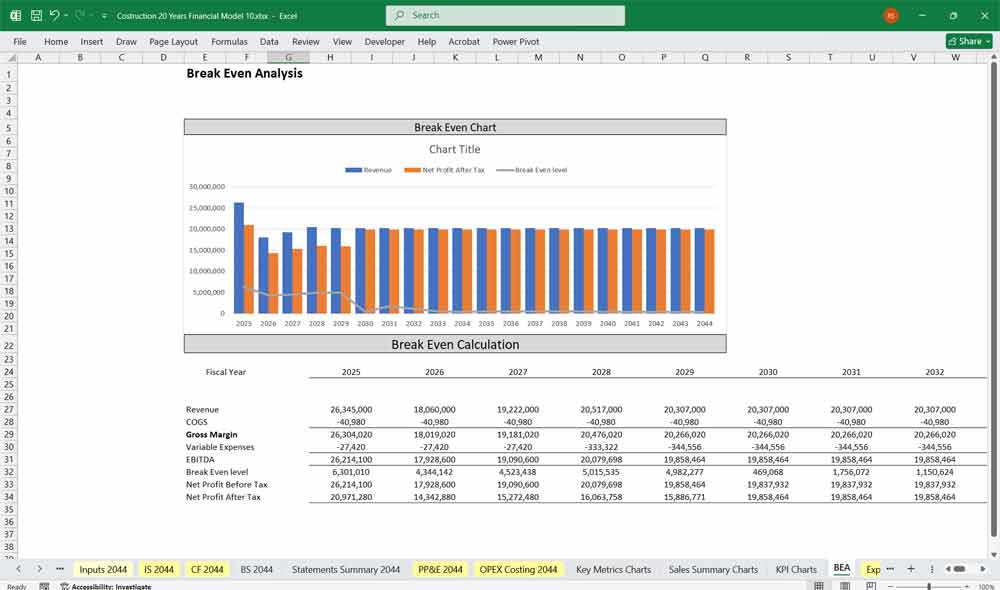
Sensitivity Analysis: Stress-Testing Margins and Delays
For a construction company, Sensitivity Analysis is the “stress test” for project profitability, focused primarily on labor costs and material price inflation. Analysts use sensitivity tables to see how a 5% spike in steel prices or a 10% increase in union wages eats into the fixed-price contracts that often define the industry. Additionally, the model must stress-test for project delays and “liquidated damages”—penalties paid for missing deadlines. By identifying the break-even margin on a portfolio basis, the sensitivity analysis reveals whether the company can survive a “margin squeeze” where costs rise faster than the ability to pass them on to clients.
Summary Of The Financial Model
This 20 Year financial model for a construction company is dynamic and project-driven, allowing for:
- Scenario analysis for delays, cost overruns, or economic downturns.
- Cash flow forecasting to manage liquidity.
- Project-specific profit analysis.
- Debt management planning.
Download Link On Next Page
Download Link On Next Page