
30 Year Solar Farm Financial Model Template
Financial Model For A Solar Farm
Key Assumptions and Drivers
Every driver of solar project economics is modeled explicitly: monthly construction cash flows over a 12-month build, 30 years of operations, granular monthly operating detail for Years 1–5 with automatic annual roll-ups, and clean annual reporting for Years 6–30 — all indexed to real calendar years (2027, 2028, 2029…) instead of generic “Year 1, Year 2” labels investors have to decode. The model includes a complete, non-circular debt schedule with straight-line amortization, a periodic inverter-replacement capex line around Year 12–15, PPA and merchant revenue logic, escalating opex, tax depreciation with NOL carry-forward, and a full three-statement output (P&L, Balance Sheet, Cash Flow Statement) that ties out to the penny every year.
Whether you’re preparing an investment memorandum, pitching a lender for non-recourse debt, running sensitivity analysis on PPA pricing or interest rate shocks, or simply need a clean, auditable solar financial model to hand to your finance team, this template gets you there instantly. Every input is clearly colour-coded, every formula is fully transparent, and a dedicated Checks tab confirms the model balances, reconciles, and contains zero circular references — so you spend your time on decisions, not on debugging spreadsheets.
Why Buy This Solar Farm Model
Building a bankable solar project finance model from scratch typically takes an analyst days or weeks — and even then, subtle formula errors in debt sizing, tax timing, or cash flow waterfalls can quietly undermine an entire investment case. This model eliminates that risk: it’s pre-built, pre-tested, and pre-validated against every check a lender or investment committee would run, including zero balance-sheet imbalances, zero circular references, and DSCR/LLCR calculated using industry-standard methodology. Buy it once and reuse it across every solar deal you evaluate — simply update the blue input cells on the Assumptions tab and the entire 15-tab model recalculates instantly. No rebuilding, no guesswork, and no risk of hidden formula errors undermining your numbers when it matters most.
Tab-by-Tab Breakdown
01 · Cover Control
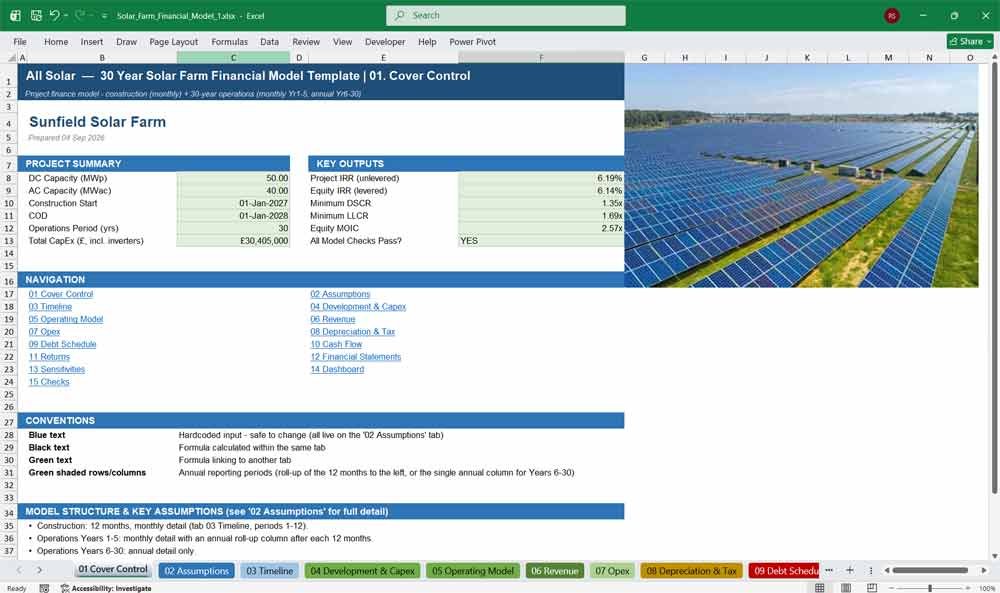
The Cover Control tab is the command centre of this solar financial model, consolidating headline Project IRR, Equity IRR, DSCR, and LLCR into a single dashboard. Navigate instantly to any of the 15 tabs, review key assumptions, and confirm every model integrity check passes before presenting to investors or lenders.
- One-click hyperlink navigation to all 15 tabs
- Live-linked headline KPIs: Project IRR, Equity IRR, Min DSCR, Min LLCR, Equity MOIC
- “All Model Checks Pass?” status pulled straight from the Checks tab
- Colour-coding legend and model-structure notes for fast onboarding
02 · Assumptions
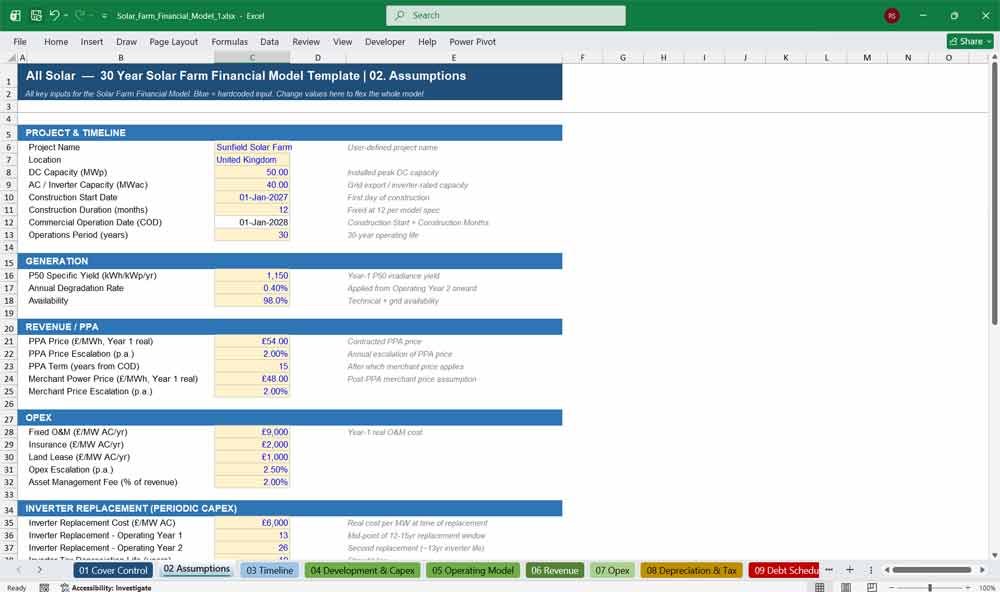
The Assumptions tab is the single control panel for this solar Excel model — 45 clearly labeled, colour-coded input cells covering capacity, yield, PPA pricing, opex, capex, gearing, interest rates, and tax. Change any blue cell and the entire model recalculates instantly across all 15 tabs.
- 45 named, editable input cells grouped into 9 logical sections
- Drives every downstream tab via Excel named ranges — no hunting for hardcoded cells
- Built-in scenario/sensitivity toggles for price, yield, capex, opex, and interest rate
- Fully documented with inline notes explaining every assumption
If you sell Solar panels, and accessories view this solar solutions model.
Solar Farm Financing & Revenues
03 · Timeline
The Timeline tab is the master period schedule anchoring this solar project finance model to real calendar dates — 2027 through 2057 — instead of generic Year 1/Year 2 labels. Every other tab shares these exact 102 periods, so construction and operating phases always align perfectly.
- 12 monthly construction periods plus 90 operating periods (monthly Yrs 1–5, annual Yrs 6–30)
- Automatic period-end dates, calendar years, and period-type flags
- Annual roll-up columns clearly flagged and colour-shaded for easy scanning
- Single source of truth that every detail tab links back to
04 · Development & Capex
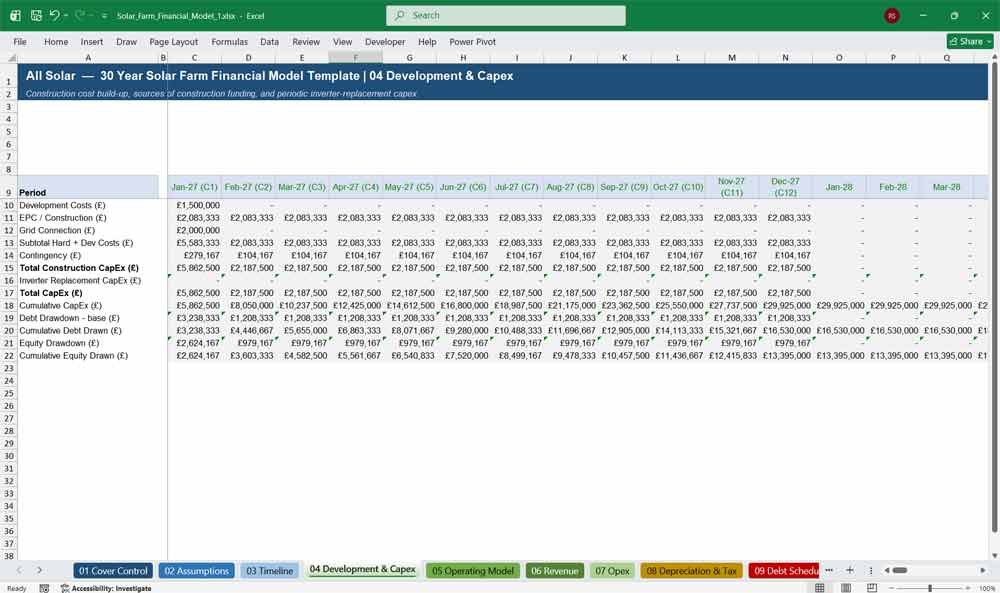
This tab builds up total solar construction cost line by line — development, EPC, grid connection, and contingency — then sources it with a live sculpted debt/equity split. A dedicated periodic inverter-replacement capex line captures Year 12–15 replacement costs automatically.
- Full construction cost build-up (development, EPC, grid connection, contingency)
- Automatic sources & uses: debt drawdown vs. equity funding, period by period
- Periodic inverter-replacement capex modeled explicitly, with fully editable timing and cost
- Life-of-model TOTAL column for every cost and funding line
05 · Operating Model
The Operating Model tab converts DC/AC capacity, specific yield, degradation, and availability into net energy generation (MWh) across all 30 operating years. Implied load factor is calculated automatically, giving lenders and investors an instant technical sanity-check on generation assumptions.
- Annual degradation curve applied automatically from Operating Year 2 onward
- Net generation (MWh) at both monthly and annual granularity
- Implied load factor calculated automatically for quick plausibility checks
- Feeds directly into the Revenue tab
06 · Revenue
The Revenue tab monetizes generation using contracted PPA pricing during the PPA term and merchant power pricing thereafter, both escalated annually. This solar PPA revenue model handles the merchant tail automatically — no manual switch-over needed as contracts expire.
- Automatic PPA-to-merchant price switch-over at contract expiry
- Independently escalating PPA and merchant price curves
- Revenue calculated at monthly and annual granularity
- Fully sensitized via the live price-adjustment toggle
Solar Farm Expenses
07 · Opex
Operating costs — fixed O&M, insurance, land lease, and asset management fees — are each escalated annually and calculated automatically from capacity and revenue inputs. This keeps opex assumptions transparent, auditable, and easy to stress-test for any solar operating cost scenario.
- Four distinct opex lines, each independently escalated
- Asset management fee calculated automatically as a % of revenue
- Fully linked to the live Opex sensitivity toggle
- Monthly and annual reporting for easy audit
08 · Depreciation & Tax
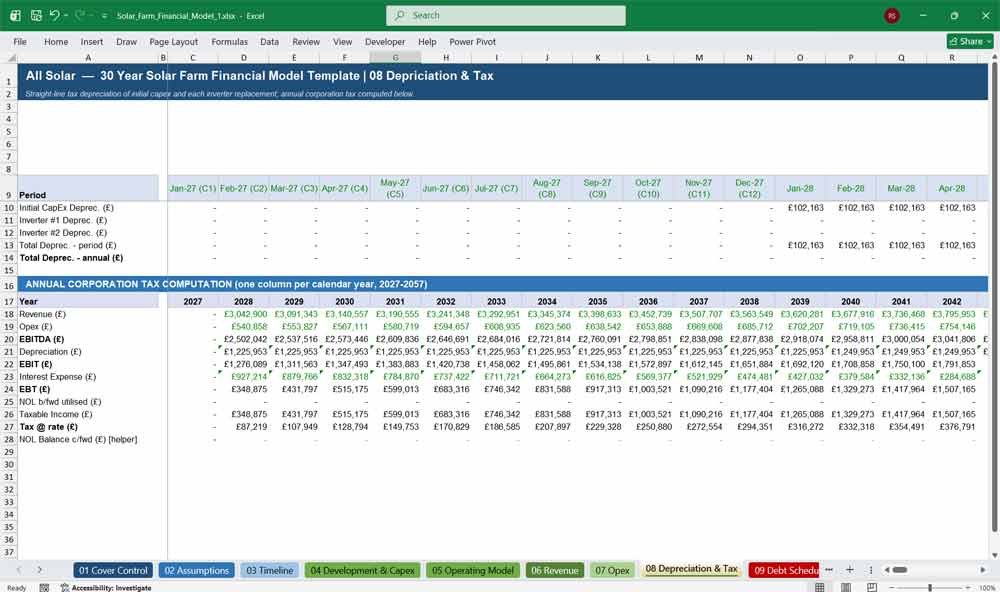
This tab calculates straight-line tax depreciation on initial capex and both inverter replacements, then runs a full annual corporation tax computation with NOL carry-forward logic. Cash tax — not just book tax — flows straight into project cash flow.
- Straight-line depreciation on initial capex plus both inverter replacements
- Full annual tax computation: EBITDA through to taxable income and cash tax
- Net operating loss (NOL) carry-forward automatically tracked and utilised
- Corporate tax rate fully editable on the Assumptions tab
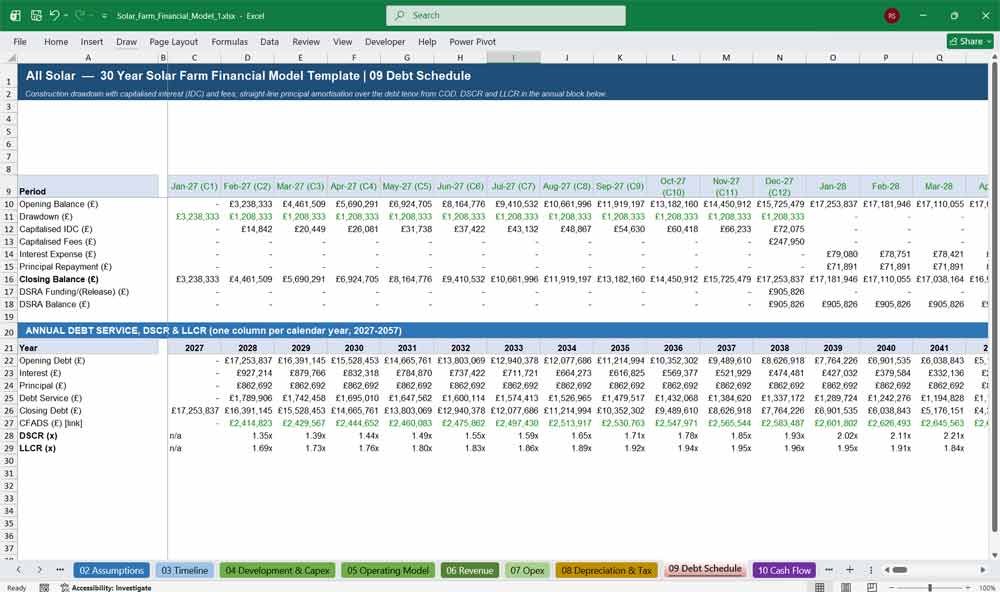
09 · Debt Schedule
A complete, non-circular debt schedule: construction drawdowns with capitalised interest and fees, then straight-line principal amortization from COD. DSCR and LLCR are calculated annually using industry-standard methodology, giving lenders the exact metrics they need to assess bankability.
- Zero circular references — interest is charged on the opening balance only
- Capitalised construction interest (IDC) and arrangement fees
- DSCR and LLCR calculated automatically, every single year
- DSRA funding and release modeled explicitly
Solar Farm Financial Statements
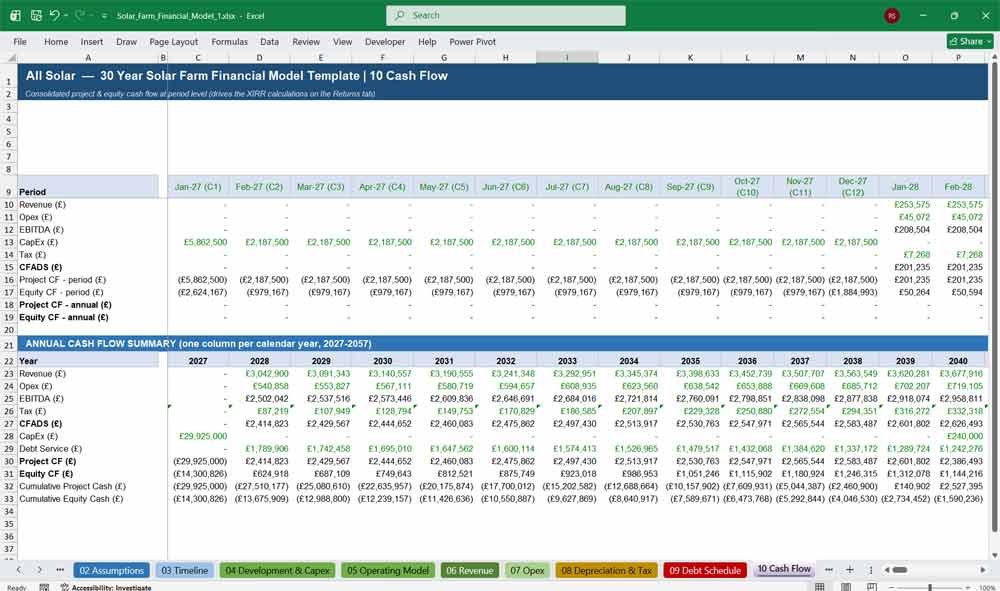
10 · Cash Flow
The Cash Flow tab consolidates project and equity cash flow at both period and annual level, feeding the XIRR-based return calculations on the Returns tab. Every cash outflow — capex, opex, tax, debt service — is fully traceable back to its source tab.
- Period-level and annual cash flow, ready for XIRR/XNPV
- Clean separation of Project Cash Flow (unlevered) and Equity Cash Flow (levered)
- Cumulative cash tracking to identify payback timing
- Every line links transparently back to its source tab
11 · Returns
Project IRR, Equity IRR, NPV, Equity MOIC, and payback period — all calculated with XIRR/XNPV over exact, uneven period dates for maximum accuracy. This is the tab investors and lenders look at first, and it’s built to withstand scrutiny.
- Project IRR and Equity IRR via XIRR — handles uneven monthly/annual cash flows correctly
- Equity MOIC, total equity invested, and total distributions
- Minimum and average DSCR/LLCR summary
- Equity payback year calculated automatically
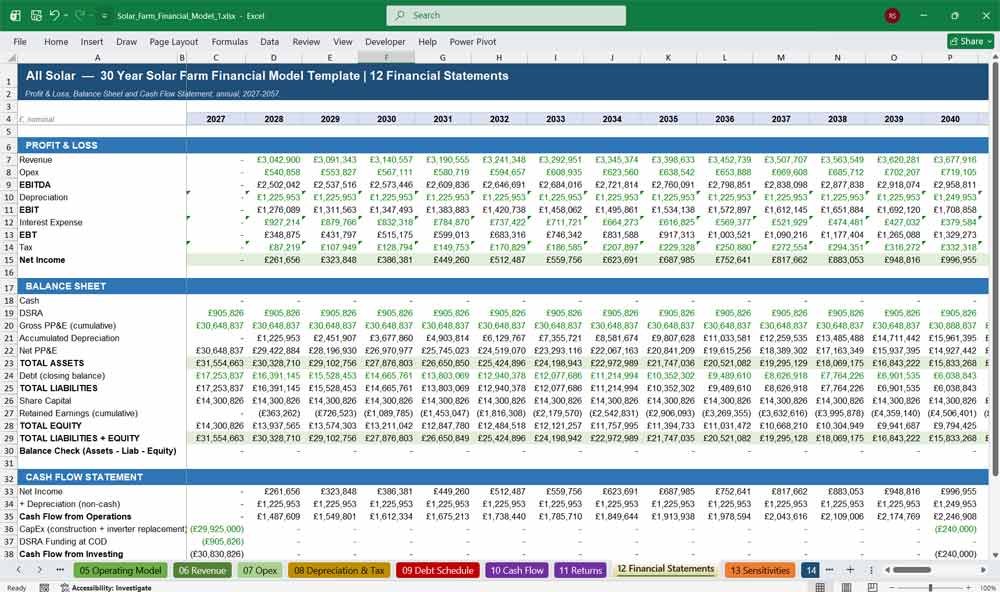
12 · Financial Statements
A full three-statement output — Profit & Loss, Balance Sheet, and Cash Flow Statement — presented annually across the full 30-year operating life. Every year is checked to balance and reconcile to the penny, giving you audit-ready financial statements straight out of the box.
- Complete P&L, Balance Sheet, and Cash Flow Statement, 2027–2057
- Balance sheet balances (Assets = Liabilities + Equity) in every single year
- Cash Flow Statement reconciles to zero every year
- Presented horizontally, year by year, for easy investor review
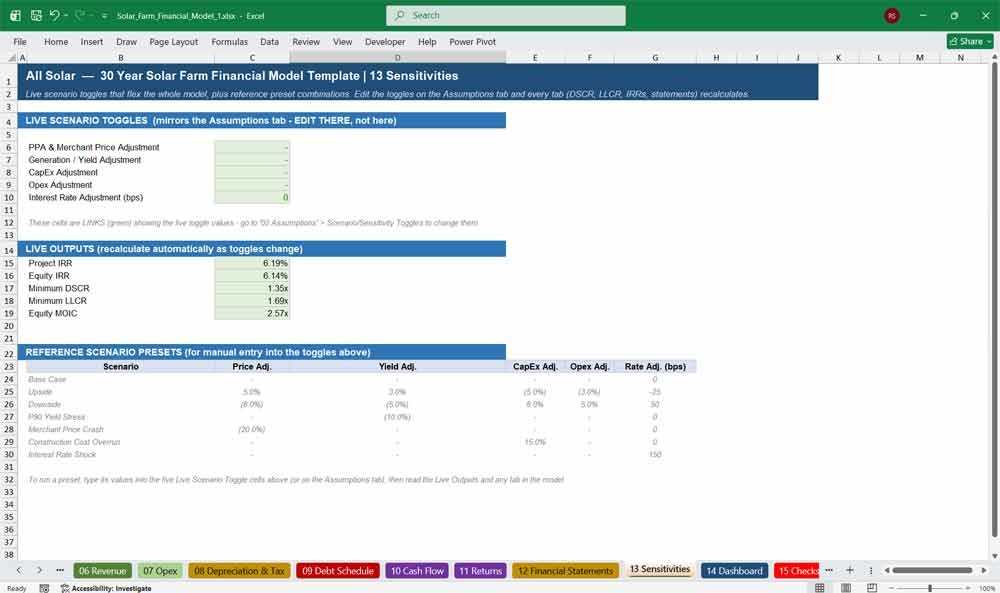
13 · Sensitivities
Stress-test the entire model instantly with five live toggles — price, yield, capex, opex, and interest rate — plus seven ready-built reference scenarios from upside to construction cost overrun. See exactly how bankability and returns shift under pressure.
- Five live sensitivity toggles flexing the whole model in real time
- Seven pre-built reference scenarios (Upside, Downside, P90 Yield Stress, Rate Shock, and more)
- Instantly see the impact on IRR, DSCR, and LLCR
- No macros or VBA required — pure, transparent Excel formulas
14 · Dashboard
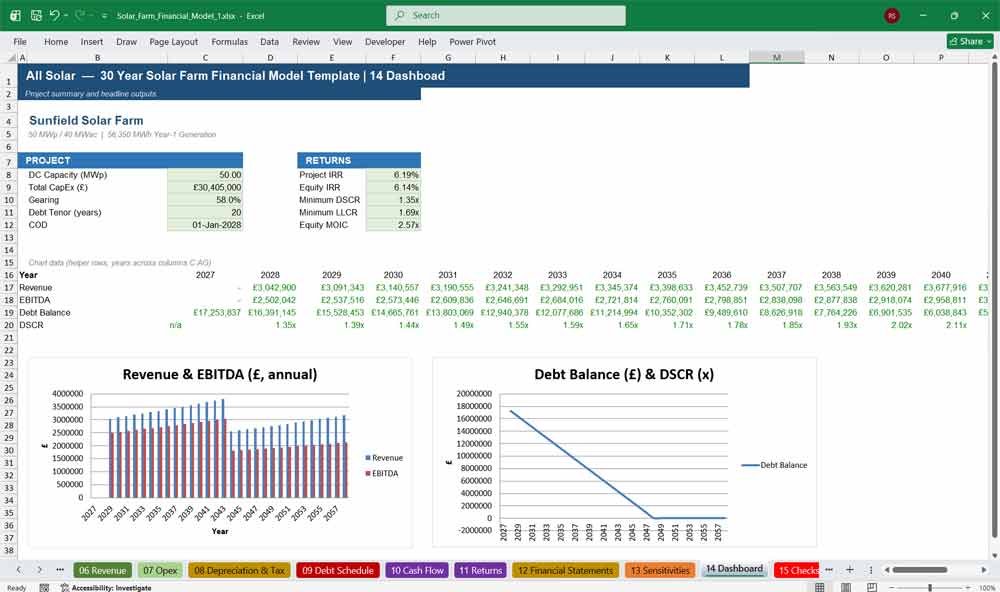
A clean, presentation-ready dashboard summarizing project specs, headline returns, and two built-in charts — Revenue & EBITDA, and Debt Balance & DSCR — across the full 30-year life. Perfect for board packs, lender presentations, or investor memoranda.
- Presentation-ready summary of capacity, capex, gearing, and returns
- Built-in Revenue & EBITDA chart
- Built-in Debt Balance & DSCR chart
- Ideal for board packs and investor presentations
15 · Checks
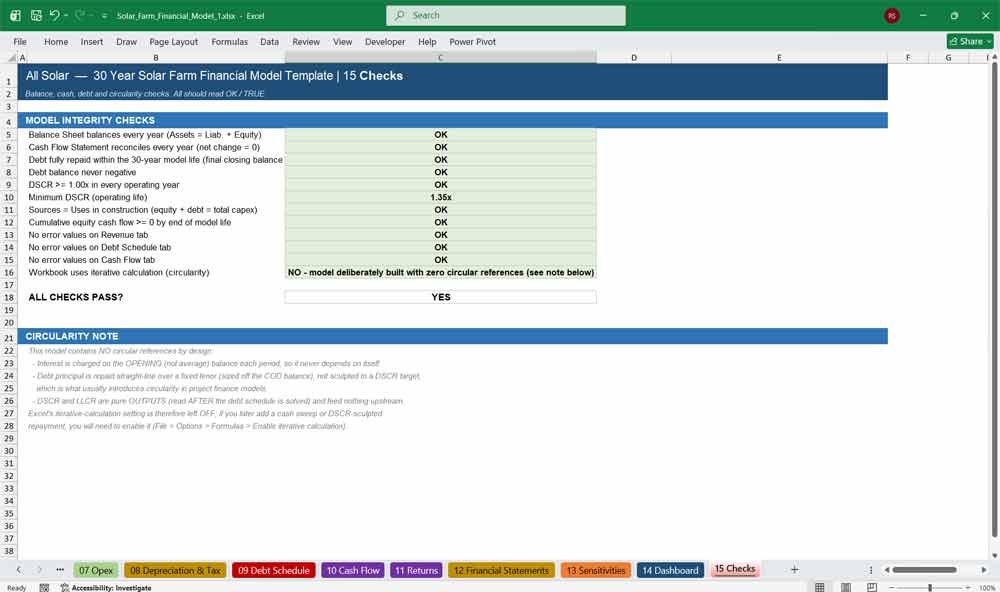
An independent integrity layer running 12 automated checks — balance sheet, cash flow reconciliation, debt amortization, DSCR breaches, and circularity — so you know the model is error-free before relying on it for an investment or financing decision.
- 12 automated integrity checks with instant OK/ERROR flags
- Explicit confirmation of zero circular references
- Single “ALL CHECKS PASS?” master flag
- Gives lenders and investors confidence the model is error-free
Solar Farm Frequently Asked Questions (FAQ)
Is this model suitable for utility-scale solar projects, or only small installations?
It’s built for utility-scale solar farms (default example: 50 MWp DC / 40 MWac), but every capacity, cost, and pricing input is fully editable, so it scales down to smaller distributed-generation projects or up to larger portfolios just as easily.
Do I need to be an Excel expert to use this model?
No. All you need to do is enter your project’s figures into the clearly labeled blue input cells on the Assumptions tab — the rest of the model recalculates automatically. Every formula is fully visible and colour-coded, so you can trace any number if you want to.
Does the model calculate DSCR and LLCR automatically?
Yes. Both DSCR and LLCR are calculated automatically, every year, using standard project finance methodology, and are summarized on the Returns, Sensitivities, Dashboard, and Checks tabs.
Can I change the PPA term, price, or switch to a fully merchant revenue profile?
Yes. PPA price, escalation, and term length are all editable inputs, and the model automatically switches to merchant pricing once the PPA term expires — no formula changes required.
Is the debt schedule circular, or does it require iterative calculation?
No. The model is deliberately built with zero circular references — interest is charged on the opening balance and principal amortizes straight-line from COD — so it opens and recalculates instantly with iterative calculation switched off.
What version of Excel do I need?
The model uses standard, widely compatible Excel functions (SUMIFS, INDEX/MATCH, XIRR, XNPV, NPV, IFERROR) and works in Excel 2007 and later, as well as Excel for Microsoft 365.
Can I use this model to raise debt financing from a lender?
Yes — that’s exactly what it’s designed for. The Debt Schedule, DSCR/LLCR outputs, and three-statement Financial Statements are built to the standard lenders expect for non-recourse project finance due diligence.
Does it include sensitivity or scenario analysis?
Yes. The Sensitivities tab includes five live toggles (price, yield, capex, opex, interest rate) plus seven pre-built reference scenarios, so you can instantly see how returns and bankability shift under different conditions.
How is inverter replacement capex handled?
Inverter replacement is modeled explicitly as periodic capex around Operating Years 12–15 (both the timing and cost per MW are editable inputs), including its own tax depreciation schedule.
How do I know the model is error-free?
The dedicated Checks tab runs 12 automated integrity tests — balance sheet balance, cash flow reconciliation, debt checks, DSCR breaches, and error-value sweeps — and displays a single master “ALL CHECKS PASS?” flag so you can verify the model at a glance.
Final Notes On The Financial Model
To assess the project’s robustness, perform sensitivity analysis on key variables:
Energy Production: Impact of lower-than-expected output.
Tariff Rate: Impact of changes in PPA rates.
CapEx: Impact of cost overruns.
Interest Rates: Impact of higher borrowing costs.
This 30 Year Solar Farm Financial Model provides a comprehensive framework for evaluating the feasibility and profitability of a solar energy farm. It can be built in Excel or specialized financial modeling software, and should be tailored to the specific project’s parameters and market conditions.