
Wind Farm Financial Model Template
Financial Model For A Wind farm
Whether you’re structuring project finance debt for a wind farm acquisition, preparing an investment memorandum, running sensitivity analysis on power price and capacity factor assumptions, or teaching renewable energy finance, this Excel financial model template adapts to your own inputs. Every assumption — turbine count, capacity factor, availability, degradation, PPA pricing, gearing, interest rate and corporation tax rate — lives in a single, clearly labelled Assumptions tab, so changing one number reflows the entire 13-tab model automatically. It’s built around real-world project finance workflows: construction drawdown, capitalised interest, debt amortisation, tax loss carry-forward and a fully reconciled three-statement output.
The download includes thirteen interconnected tabs spanning a cover dashboard, technical assumptions, energy production, capex, opex, revenue, debt financing, tax and depreciation, full financial statements, discounted cash flow and returns sensitivities — all colour-coded by function and verified formula-by-formula with zero calculation errors. Whether you need a standalone wind farm valuation model, a lender-ready DSCR and returns analysis, or an editable financial model template you can repurpose for any onshore wind project, this workbook gives you an institutional-quality starting point built on realistic renewable energy assumptions and industry-standard project finance modelling conventions.
Why Buy This Model?
Building a bank-grade wind farm financial model from scratch typically takes an experienced financial analyst several weeks — sourcing the right project finance structure, building a 27-year monthly forecast, linking a three-statement model, and stress-testing returns before it’s fit to show a lender or investment committee. This template compresses that build into a single download: a fully linked, formula-driven Excel model covering construction, operations, debt financing, tax and returns analysis, recalculated and verified formula-by-formula with zero calculation errors and a balance sheet that reconciles to zero in every one of the 27 forecast years. Every assumption is editable, so you can repurpose it for any onshore wind project — a different turbine count, capacity, jurisdiction, power price or financing structure — without rebuilding the underlying logic from scratch. Whether you’re a developer preparing a feasibility study, an investor underwriting an acquisition, a lender running credit analysis, an advisor building a client deliverable, or a student learning project finance modelling, this wind farm financial model gives you a professional, audit-ready foundation you can trust and adapt in minutes rather than weeks.
- Saves weeks of build time versus modelling from a blank workbook
- Zero formula errors, fully recalculated and QA-checked before delivery
- Fully editable assumptions — adapt to any turbine count, capacity or market
- Genuine three-statement integrity, with a balance sheet that ties out every year
- Covers the full project life cycle: construction, operations, financing, tax and returns
- Suits developers, investors, lenders, advisors, consultants and students alike
Wind Farm Model Tab Guide
Tab 1 — Cover Dashboard
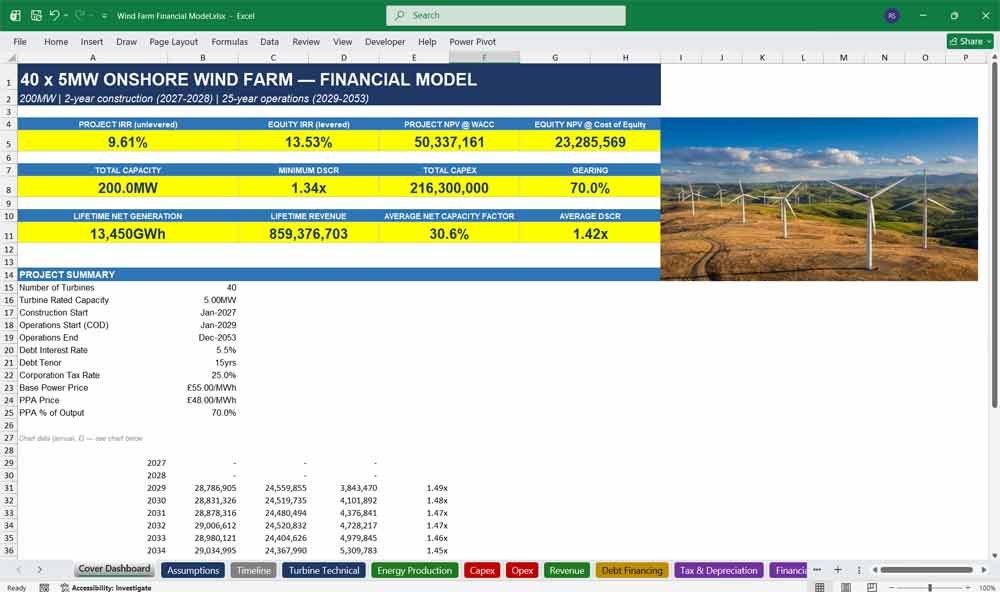
The Cover Dashboard summarises headline wind farm investment metrics — project IRR, equity IRR, NPV, minimum DSCR, installed capacity and lifetime revenue — in one visual summary, turning a complex 200MW project finance model into an at-a-glance decision-making tool.
- Headline project IRR, equity IRR, project NPV and equity NPV in one view
- Minimum and average DSCR displayed for instant lender/covenant checks
- Lifetime net generation (GWh) and lifetime revenue summarised automatically
- Built-in charts for annual revenue, EBITDA, net profit and DSCR trends
Tab 2 — Assumptions
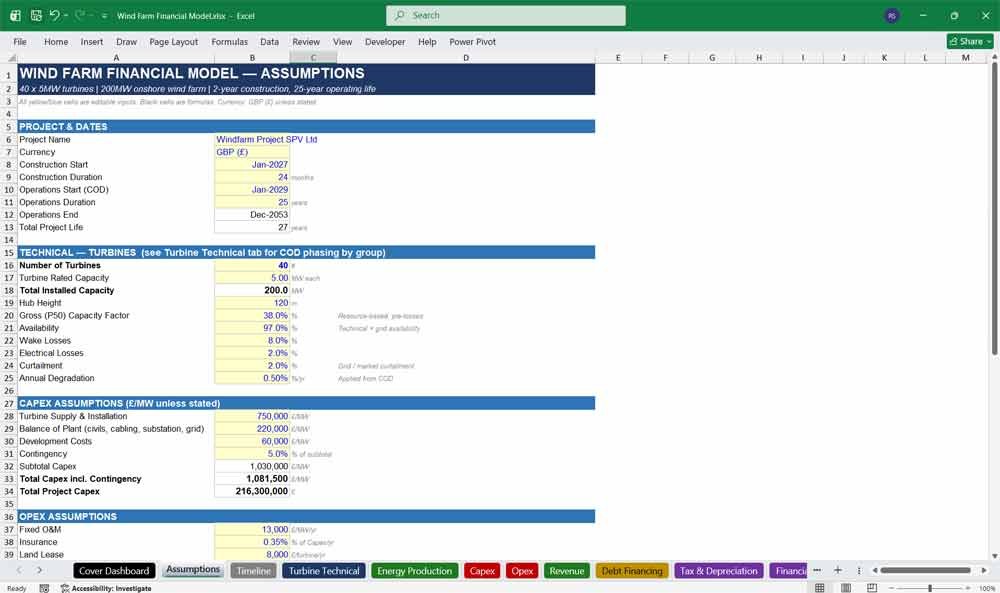
The Assumptions tab centralises every technical, financial and tax input driving this wind farm financial model — turbine specs, capacity factor, availability, degradation, capex, opex, PPA pricing, gearing and tax rate — in editable blue input cells.
- Single source of truth for every model input — change once, updates everywhere
- Covers technical, capex, opex, revenue, debt, tax and valuation assumptions
- Colour-coded blue input cells clearly separate editable data from formulas
- Pre-loaded with realistic onshore wind market assumptions as a starting benchmark
Wind Farm Energy Producton
Tab 3 — Wind Farm Timeline
The Timeline tab maps the full project lifecycle — 24 months of construction followed by 25 years of operations — month by month with annual roll-ups, driving phasing logic across every tab in this wind farm financial model.
- Automatically classifies every month as construction or operations
- Tracks operating year number for degradation and price escalation formulas
- Flags commercial operation date (COD) for downstream revenue and debt logic
- Fully dynamic — shift construction start or COD and the whole model updates
Tab 4 — Turbine Technical
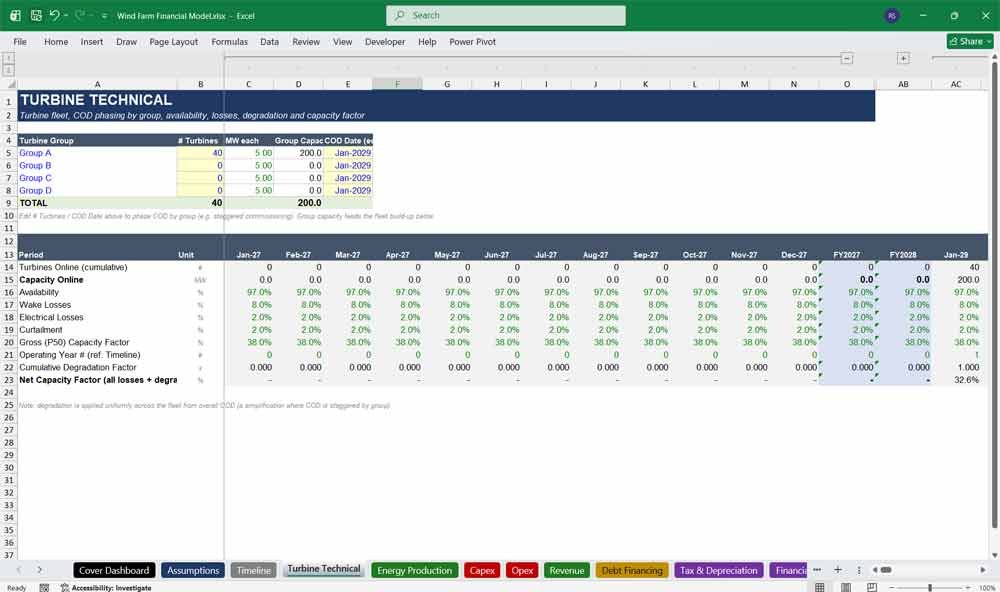
The Turbine Technical tab configures your 40 x 5MW turbine fleet — editable count, hub height, capacity factor, availability, wake and electrical losses, curtailment and degradation. A COD-by-group table models staggered commissioning for any project configuration.
- Editable turbine count, rated capacity and hub height
- Group-based COD phasing for staggered commissioning schedules
- Availability, wake loss, electrical loss and curtailment inputs feed net capacity factor
- Annual degradation curve applied automatically from commercial operation date
Tab 5 — Energy Production
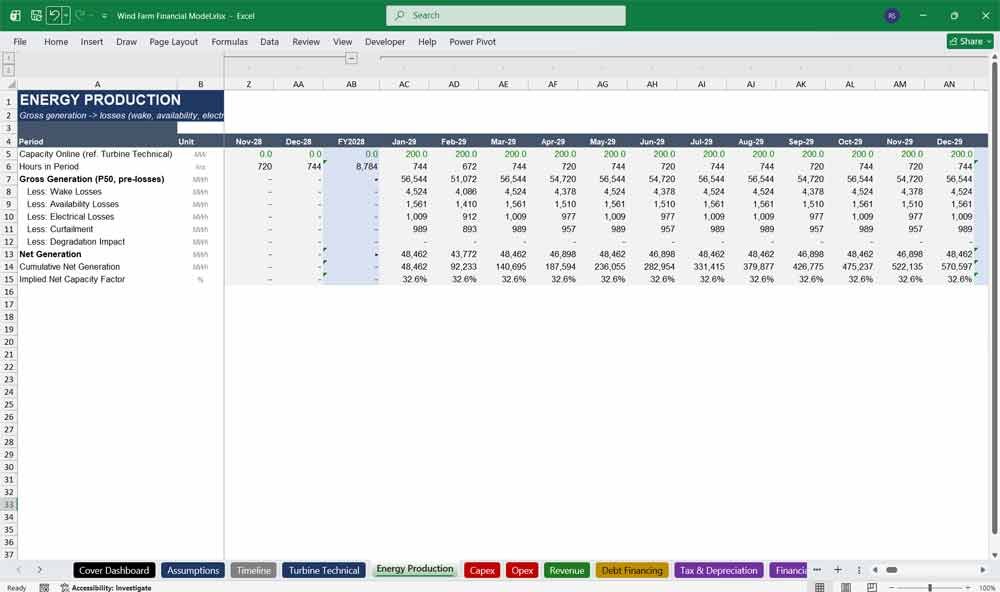
The Energy Production tab converts turbine capacity into net MWh through a transparent loss waterfall — gross generation less wake losses, availability, electrical losses, curtailment and degradation — underpinning every revenue and returns calculation in the model.
- Full gross-to-net generation waterfall broken out by loss category
- Monthly generation profile with annual totals across 27 years
- Implied net capacity factor calculated automatically for quality checks
- Cumulative lifetime generation tracked in MWh/GWh
Tab 6 — Capex
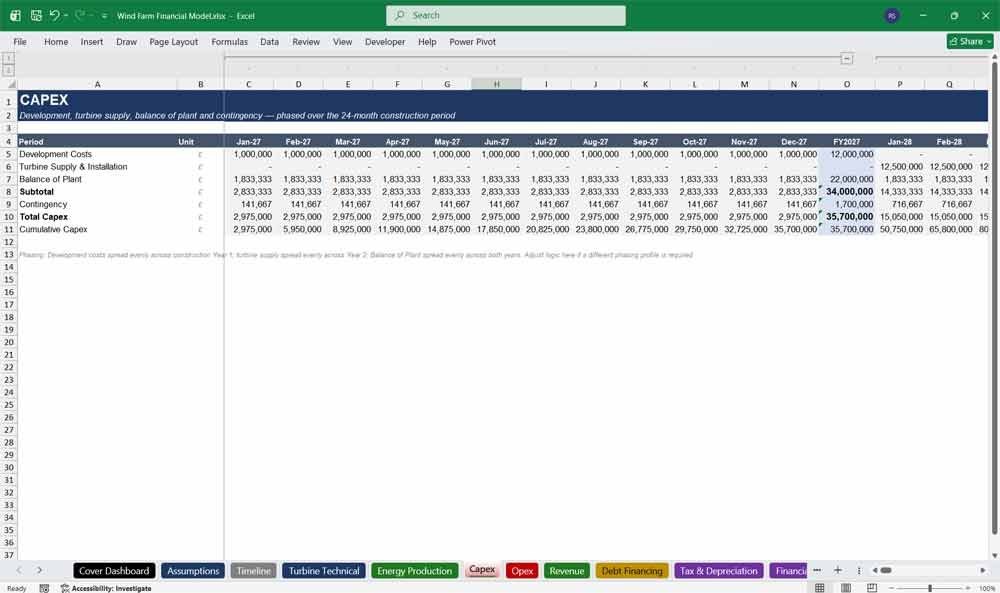
The Capex tab breaks down total construction cost into turbine supply, balance of plant, development costs and contingency, phased automatically across the 24-month build — feeding debt drawdown and equity funding throughout the project finance model.
- Itemised turbine, balance of plant, development and contingency costs
- Automatic monthly phasing across the two-year construction period
- Editable £/MW cost assumptions for instant re-costing
- Cumulative capex tracked to drive construction funding drawdown
Tab 7 — Opex
The Opex tab forecasts fixed and variable operating costs — O&M, insurance, land lease, management fees and business rates — escalated annually from COD, giving lenders and investors a realistic, editable operating cost base for the wind farm.
- Fixed O&M, insurance, land lease, management fee and rates modelled separately
- Annual cost escalation applied automatically across the 25-year operating life
- Editable £/MW and £/turbine cost assumptions
- Cumulative opex tracked for full lifecycle cost analysis
Wind Farm Financing & Revenues
Tab 8 — Revenue
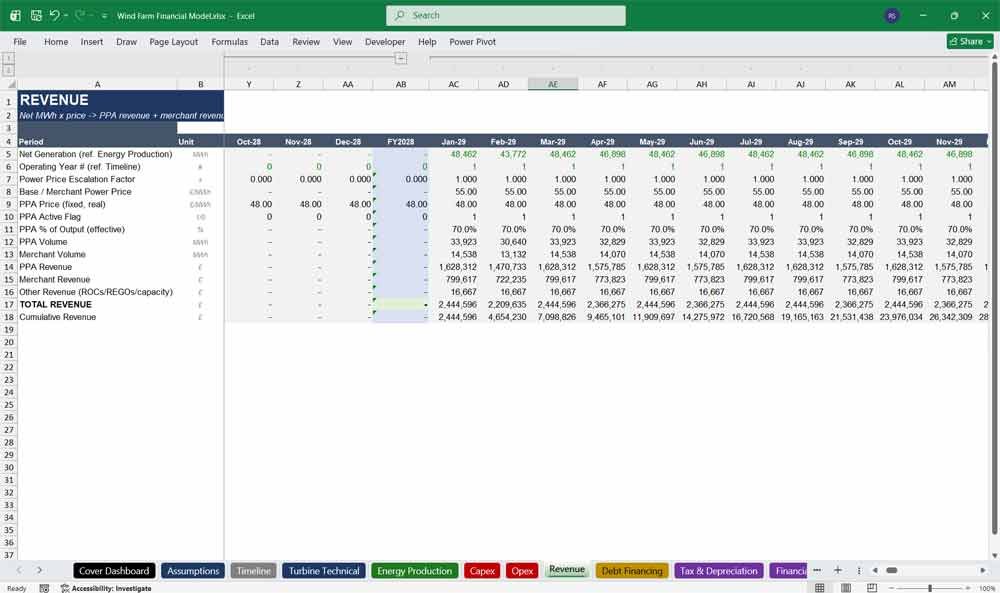
The Revenue tab models total wind farm income from net generation, blending escalating merchant power prices with a fixed-price PPA plus other revenue streams. Editable PPA percentage, price and escalation assumptions adapt the forecast to any offtake strategy.
- Splits net generation between PPA and merchant sale volumes
- Editable PPA price, PPA term and PPA percentage of output
- Escalating merchant power price assumption with adjustable growth rate
- Other revenue line for ROC/REGO or capacity market income
Tab 9 — Debt Financing
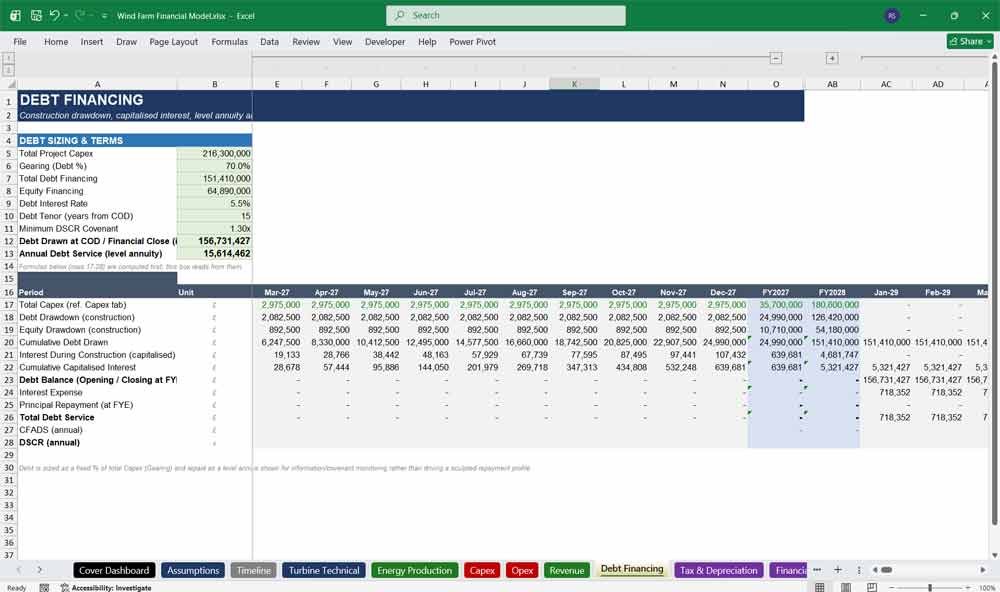
The Debt Financing tab sizes project debt by gearing ratio, capitalises interest during construction, and amortises the loan as a level annuity over a lender-defined tenor — with built-in DSCR calculation ready for lender due diligence.
- Automatic debt sizing from gearing ratio and total capex
- Capitalised interest during construction rolled into the opening debt balance
- Level annuity amortisation schedule over an editable debt tenor
- Annual DSCR calculated and tested against the covenant minimum
Tab 10 — Tax & Depreciation
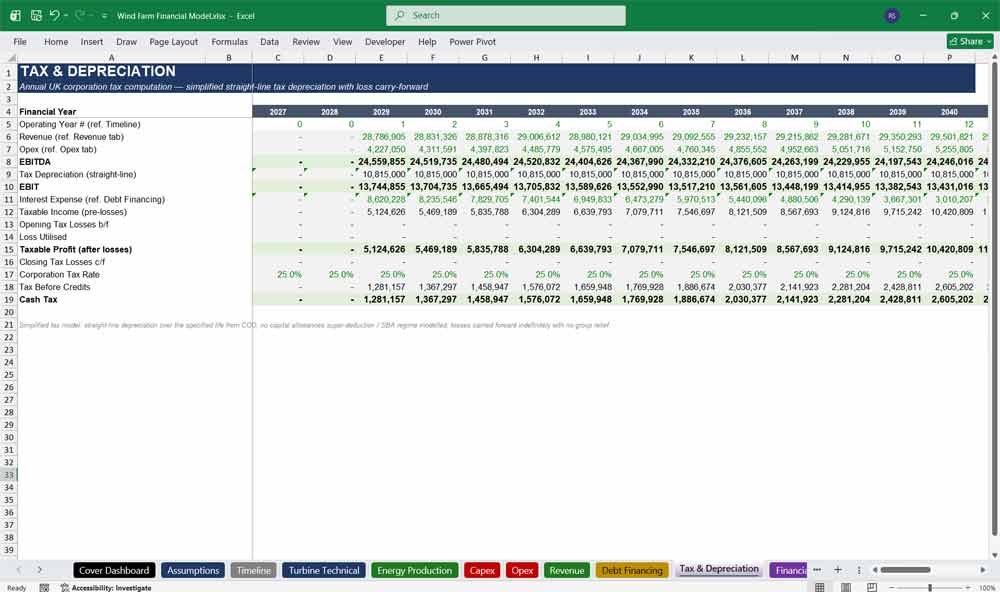
The Tax & Depreciation tab runs a full annual corporation tax computation — EBITDA, straight-line depreciation, EBIT, interest, taxable income, tax loss carry-forward and cash tax payable — ensuring accurate after-tax cash flow throughout the wind farm model.
- Complete EBITDA-to-cash-tax computation for every financial year
- Straight-line tax depreciation over an editable asset life
- Tax loss carry-forward and utilisation tracked automatically
- Editable corporation tax rate, adaptable to any jurisdiction
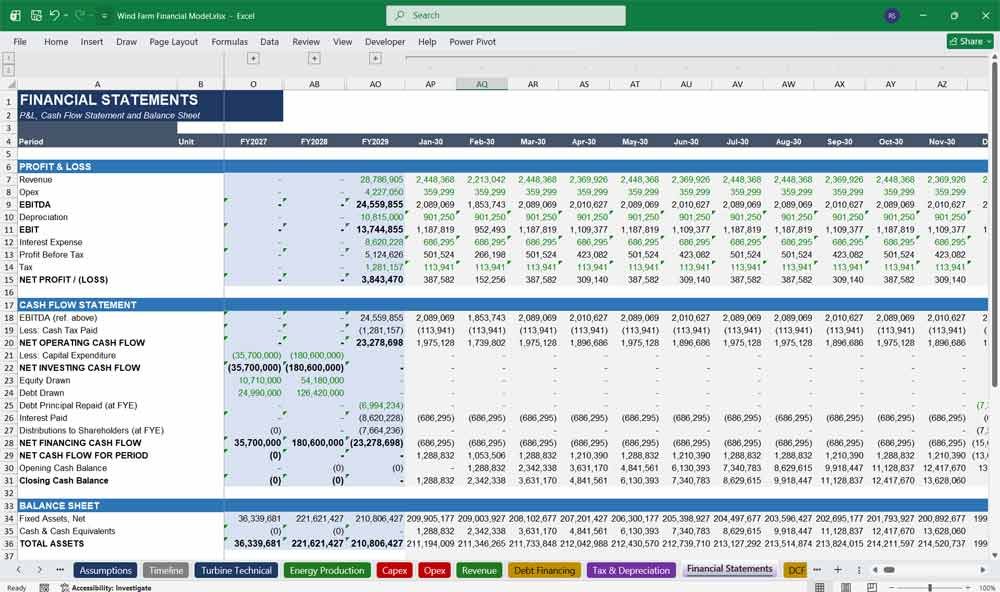
Tab 11 — Financial Statements
The Financial Statements tab delivers a fully reconciled profit & loss, cash flow statement and balance sheet, with an automatic check confirming the accounts tie out to zero every year — giving investors complete confidence in the model.
- Integrated profit & loss, cash flow statement and balance sheet
- Automatic dividend/distribution sweep to shareholders
- Built-in balance sheet check — verified to reconcile every year
- Monthly detail with annual summaries across the full project life
Wind Farm Key Performance Indicators
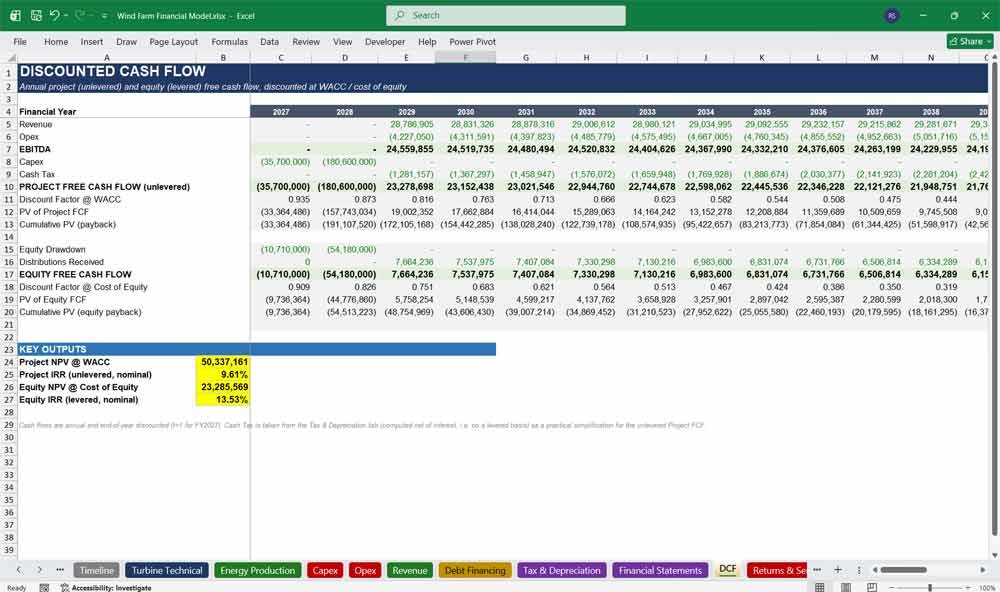
Tab 12 — DCF
The DCF tab discounts unlevered project and levered equity free cash flows at WACC and cost of equity to calculate NPV and IRR — the core investment appraisal metrics for any wind farm acquisition or development decision.
- Separate project (unlevered) and equity (levered) cash flow analysis
- Automatic NPV and IRR calculation using Excel’s native financial functions
- Editable WACC and cost of equity discount rate assumptions
- Cumulative discounted cash flow shows investment payback timing
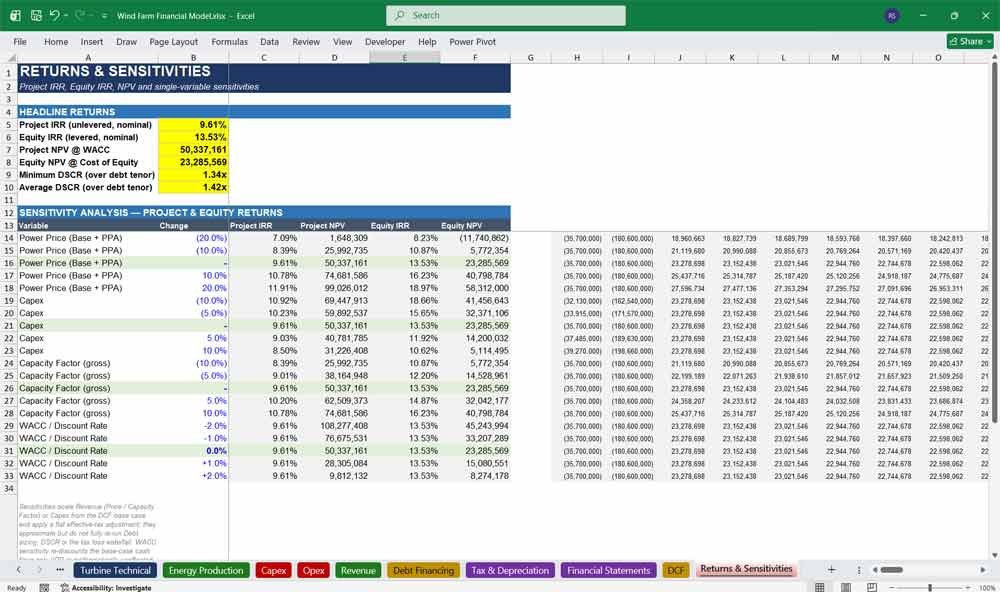
Tab 13 — Returns & Sensitivities
The Returns & Sensitivities tab stress-tests project and equity IRR and NPV against power price, capex, capacity factor and discount rate movements, plus combined downside and upside scenarios — essential for lender and investment committee risk review.
- Five-point sensitivity tables across price, capex, capacity factor and WACC
- Combined downside/base-case/upside scenario comparison
- Project and equity IRR and NPV recalculated live for every scenario
- Headline returns and DSCR summary linked directly from the model
Wind Farm Frequently Asked Questions
What software do I need to open this wind farm financial model? The model is built natively in Microsoft Excel (.xlsx) and works in Excel 2016 and later, including Excel for Microsoft 365. It uses standard Excel formulas only — no macros, add-ins or plugins required — so it also opens in Google Sheets with minor formatting adjustments.
Can I change the number of turbines, turbine size or project location? Yes. Every technical, financial and tax input lives in clearly labelled, editable cells on the Assumptions and Turbine Technical tabs — turbine count, rated capacity, hub height, capex and opex rates, power price, tax rate and financing terms can all be changed to fit a different onshore wind project, market or currency.
Is the model fully formula-driven, or are the outputs hardcoded? Fully formula-driven throughout. There are no hardcoded results anywhere in the workbook — every output, from monthly net generation to project IRR, recalculates automatically whenever you change an assumption.
Has the model been checked for errors? Yes. The full workbook has been recalculated and QA-checked with zero formula errors, and the Financial Statements tab includes a built-in balance-check row confirming the balance sheet reconciles to zero in every one of the 27 forecast years.
Does the model use monthly or annual detail? Both. Every operational tab runs monthly across the full 27-year project life — construction and operations — with annual roll-ups and collapsible column groups, so you can work at monthly granularity or collapse straight to annual summaries.
Can I use this model for a live financing, acquisition or investment decision? The workbook is a professional starting template built on realistic project finance conventions — debt sizing, DSCR testing, tax loss carry-forward, capitalised construction interest and full three-statement reconciliation. As with any financial model, you should review and tailor every assumption to your specific project, market and lender requirements before relying on it for a live transaction; it is a modelling tool, not financial or investment advice.
Can this be adapted for offshore wind, solar or battery storage projects? The Debt Financing, Tax & Depreciation, Financial Statements, DCF and Returns & Sensitivities tabs are structured generically enough to adapt to other renewable energy asset classes. The Turbine Technical and Energy Production tabs are wind-specific and would need reworking to reflect a different technology’s generation profile.
Scenario Of The Financial Model
This 25 Year Wind Farm Financial Model includes modules to simulate different scenarios and analyze sensitivities:
- Production Sensitivity: Impact of changes in wind speeds or turbine efficiency.
- Tariff Sensitivity: Changes in power purchase agreement (PPA) prices or escalation rates.
- Cost Sensitivity: Variations in capex, opex, or financing terms.
This comprehensive structure ensures that the financial viability and investment returns for the wind farm project are rigorously evaluated, offering valuable insights to developers, lenders, and investors.