
EV Charging Station Financial Model Template
Plan, finance and value your electric vehicle charging network with confidence using this professional EV charging station financial model Template in Excel. Built for developers, charge point operators (CPOs), investors, lenders and consultants, the model covers the full project lifecycle: a 24-month monthly construction period followed by 10 years of operations. It covers site pipeline and rollout, charger deployment, utilization, revenue, operating costs, capex, debt, tax and returns. Every figure flows from one central assumptions sheet, so you can test a business case in minutes rather than weeks.
10-Year Financial Model for an EV Charging Station
At its core is a transparent, driver-based EV charging revenue model: Sites → Chargers → Availability → Utilization → Sessions → kWh → Revenue. Energy sold is calculated as chargers × operating hours × availability × utilization × kW. Charging revenue is kWh sold × price per kWh. Electricity cost of sales is modelled separately as kWh purchased × cost per kWh, adjusted for charging efficiency losses. AC (Level 2), DC fast and ultra-fast chargers are modelled separately, with peak, off-peak and fleet pricing, demand charges, site host revenue share, subscriptions and ancillary income.
The workbook is designed to the standards lenders and investors expect: colour-coded inputs, formulas and links; a fully integrated three-statement model (P&L, cash flow and balance sheet); a debt schedule with DSCR; and a dedicated checks tab that confirms the balance sheet balances in every period. Change the model start date once and every date, year label and escalation index updates automatically. Switch between Base, Upside and Downside scenarios with one selector to see project IRR, equity IRR, NPV and MOIC respond instantly.
What’s Inside: Tab-by-Tab Guide
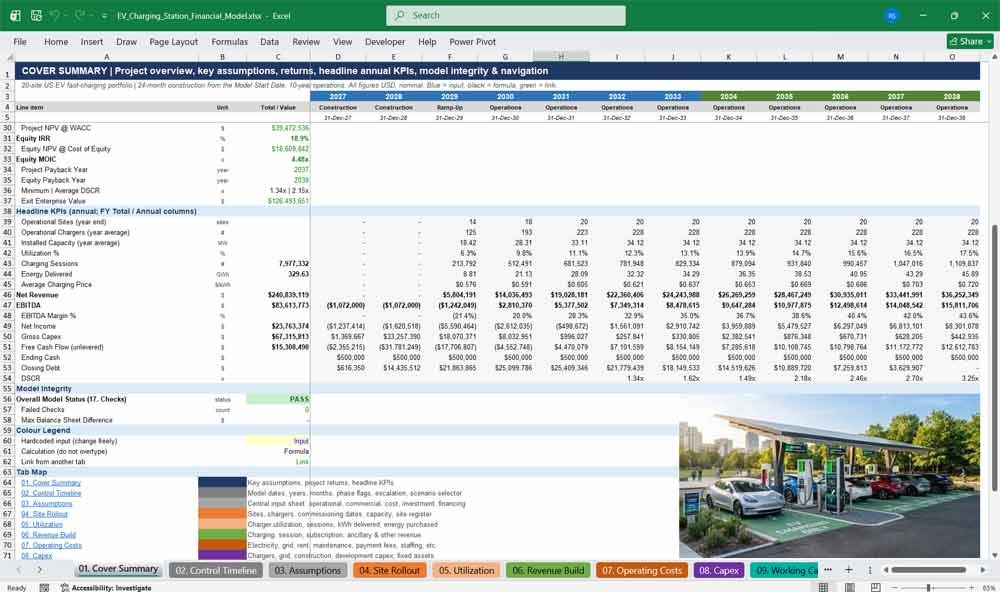
01. Cover Summary
The Cover Summary is your EV charging investment dashboard. It shows the project overview, key assumptions, project and equity returns, and a 12-year annual KPI table, so investors and credit committees can review the whole business case on one professional summary page.
- Project IRR, equity IRR, NPV, MOIC, payback year and DSCR at a glance
- Annual sites, chargers, MW capacity, utilization, GWh, revenue and EBITDA
- Live model integrity status (PASS / REVIEW)
- Hyperlinked tab map and colour legend
02. Control Timeline
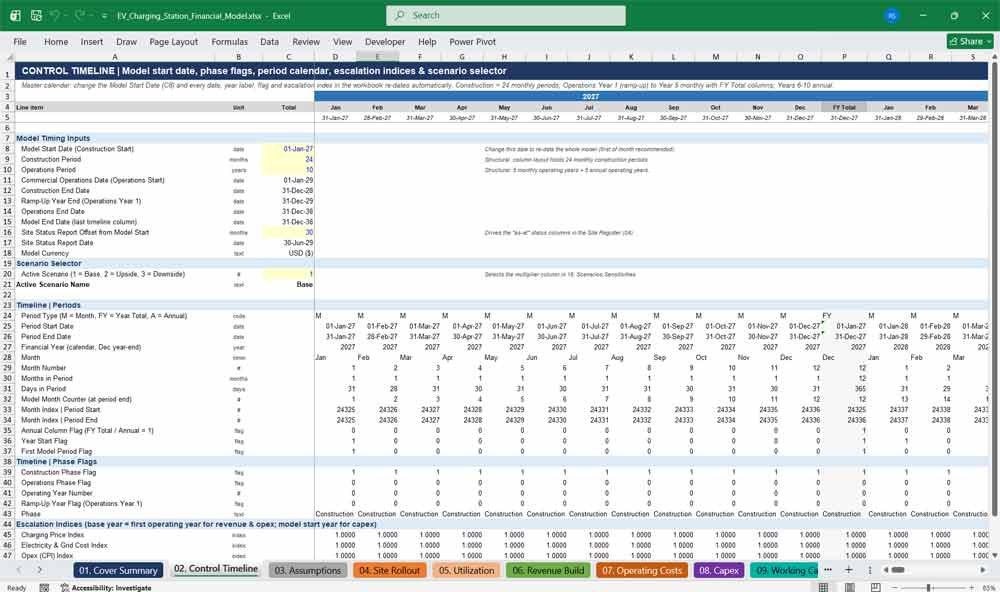
The Control Timeline is the master calendar of the EV financial model. One start date drives every period, phase flag and escalation index across the workbook. It also holds the scenario selector, so re-dating or re-scenarioing the entire project takes one click.
- Single Model Start Date re-dates the whole workbook automatically
- 24 monthly construction periods, a monthly ramp-up year and operating years 2–5, then annual years 6–10
- Construction, operations and ramp-up flags plus operating year counter
- Price, electricity, CPI and capex escalation indices
- Base / Upside / Downside scenario selector
03. Assumptions
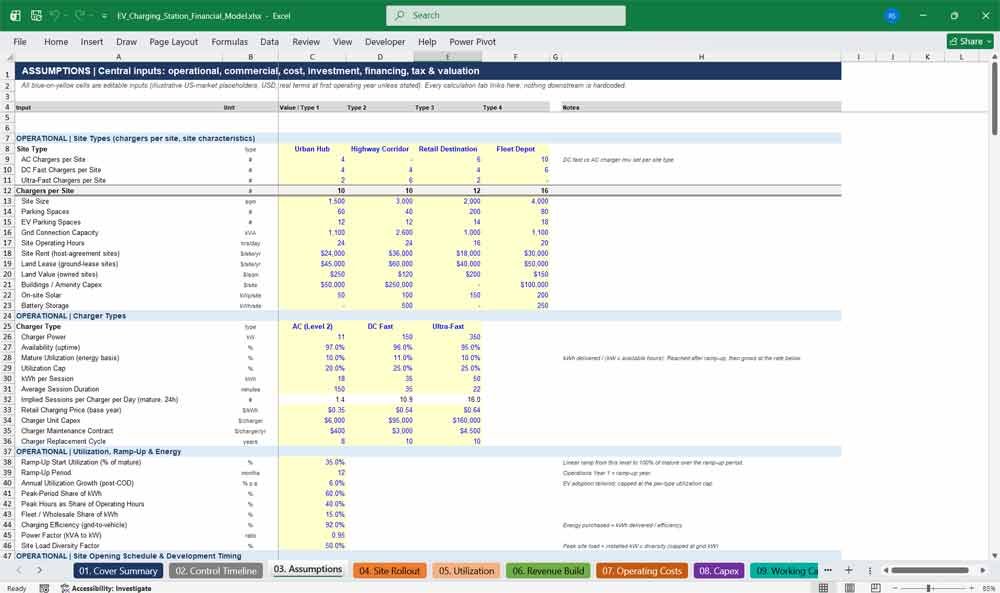
The Assumptions sheet centralises every EV charging input: operational, commercial, cost, investment, financing, working capital, tax and valuation. Blue input cells are clearly separated from formulas, making assumption changes fast, auditable and safe for analysts and reviewers.
- Chargers per site by site type (Urban Hub, Highway, Retail, Fleet Depot)
- AC vs DC fast vs ultra-fast charger power, availability, utilization and kWh per session
- Charging prices, connection fees, subscriptions, fleet pricing and host revenue share
- Electricity, demand charges, rent, maintenance, staffing and grid costs
- Unit capex, depreciation lives, debt terms, tax and discount rates
EV Charging Station Revenues & Costs
04. Site Rollout
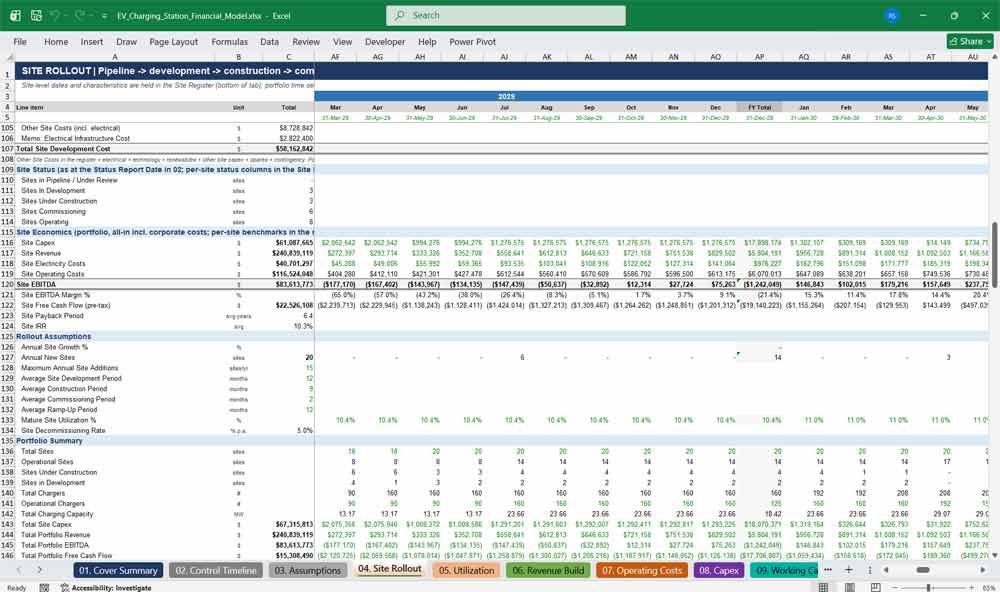
Site Rollout models the full EV charging site development pipeline, from identification and acquisition through planning, grid connection, construction, commissioning and operations. A 20-site register drives portfolio counts, charger rollout, capacity, site costs and site-level economics automatically.
- Site pipeline, project phases and rollout flows by period
- Site register with 12 milestone dates, status, grid and cost data per site
- Charger rollout, installed kW/MW capacity and peak site load
- Construction progress, delays, grid connection requirements
- Representative site economics by type: EBITDA, payback and site IRR
05. Utilization
The Utilization tab converts installed chargers into energy sold. It applies operating hours, availability, ramp-up and utilization by charger type to calculate kWh delivered, charging sessions, session duration, grid capacity use, load factor and total energy purchased.
- Chargers × hours × availability × utilization × kW = kWh delivered
- Site-by-site ramp-up with a configurable ramp-up period
- Sessions per charger per day, kWh per session, peak and off-peak utilization
- Energy purchased, charging losses and billed demand capacity
- Detailed AC, DC fast and ultra-fast charger build
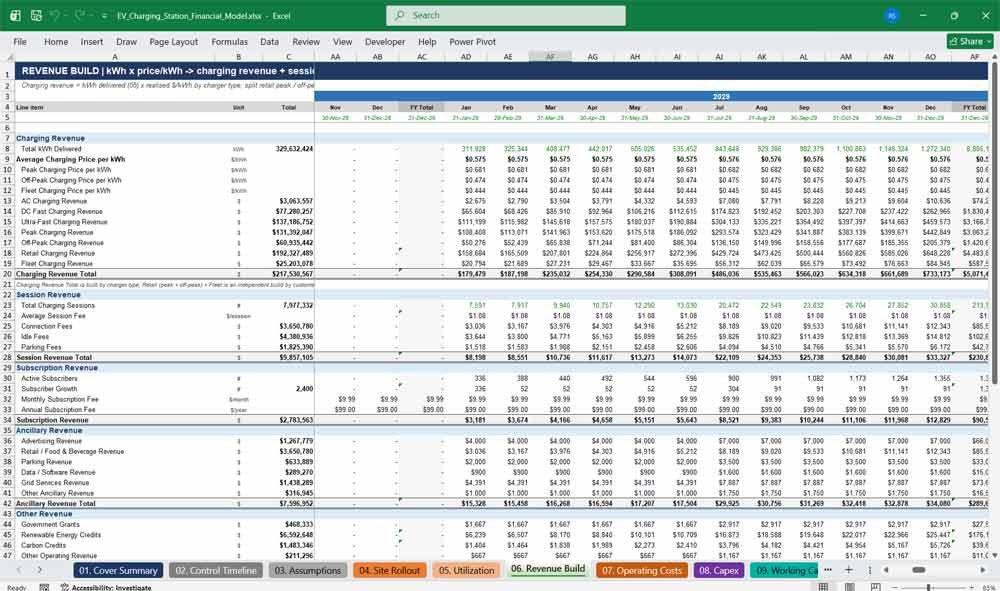
06. Revenue Build
The Revenue Build turns kWh into income with a detailed EV charging revenue model. Charging revenue is split by charger type and by peak, off-peak and fleet customers. It also includes session fees, subscriptions, ancillary income, grants and credits.
- Charging revenue = kWh sold × price per kWh, with price escalation
- Connection, idle and parking fees
- Subscription revenue on monthly and annual plans
- Advertising, retail, data, grid services and clean fuel / carbon credits
- Discounts, refunds, net revenue and growth %
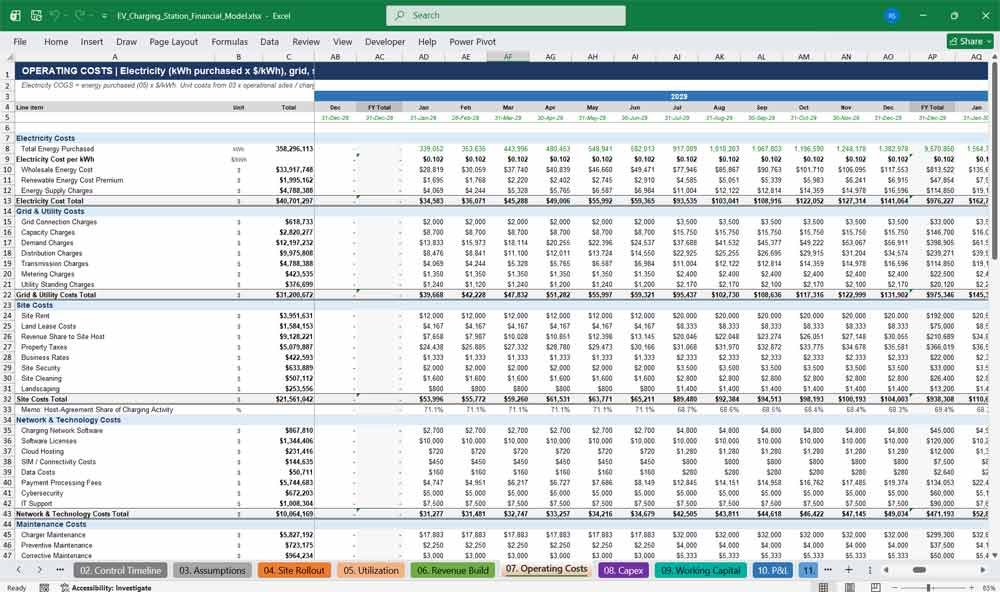
07. Operating Costs
Operating Costs builds a complete EV charging opex model. Electricity cost of sales is calculated from kWh purchased × $/kWh, alongside grid and demand charges, site rent, host revenue share, network software, payment processing, maintenance, staffing, insurance, marketing and corporate overhead.
- Electricity costs: wholesale, renewable premium and supply charges
- Grid & utility costs, including demand, capacity and distribution charges
- Site, network, maintenance, personnel, insurance and marketing costs
- Corporate costs from day one of construction
- Operating cost per kWh and per session
08. Capex
The Capex tab details every EV charging infrastructure cost: development, land, grid connection, chargers, electrical, civil works, technology and renewables. It also covers replacement capex and capital grants, then feeds a fixed asset register with depreciation by asset class.
- 60+ capex line items driven by site register quantities
- Spend profiled over each site’s development and construction window
- Charger replacement, mid-life refurbishment and battery replacement
- Capital grants and salvage proceeds
- Fixed asset register, depreciation and net book value by class
09. Working Capital
Working Capital models the cash tied up in daily operations. Receivables, payables, accruals, prepayments, deposits, deferred subscription revenue and host revenue-share payables are calculated from days and months assumptions and feed straight into cash flow.
- Receivable, payable and accrued payroll days
- Prepaid insurance and rent, plus lease deposits
- Deferred revenue on annual subscriptions
- Net working capital and change in NWC by period
- Reconciliation checks built in
EV Charging Station Financial Statements
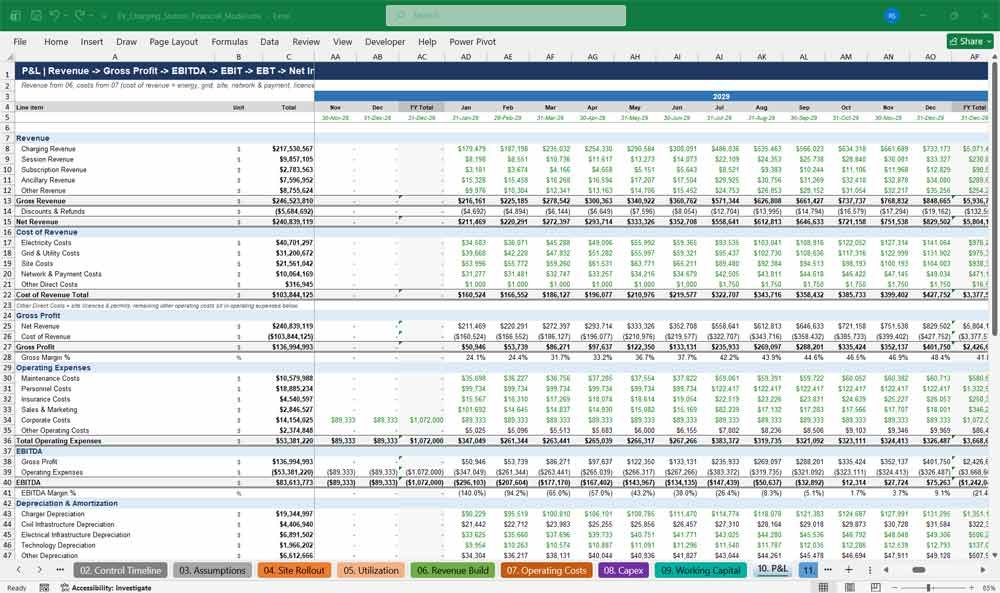
10. P&L
The P&L presents a full EV charging income statement, from gross revenue through cost of revenue, gross profit, operating expenses, EBITDA, depreciation, EBIT, finance costs and tax to net income. Margins are calculated for every monthly and annual period.
- Revenue by stream, discounts and net revenue
- Cost of revenue and gross margin %
- EBITDA and EBITDA margin %
- Depreciation by asset class and net finance costs
- Current tax, deferred tax, tax credits and net income
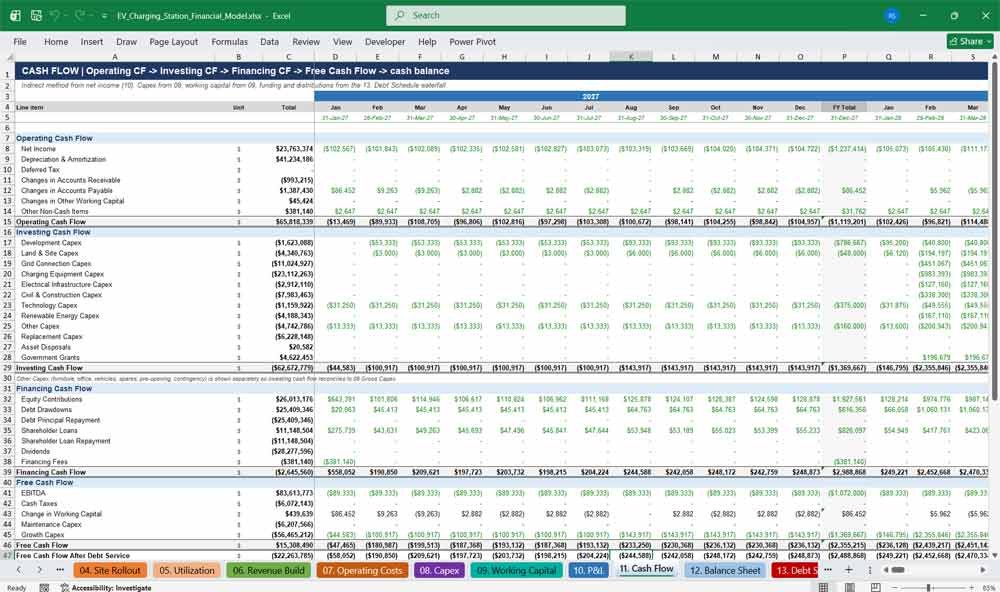
11. Cash Flow
The Cash Flow statement uses the indirect method to reconcile net income to cash. It shows operating, investing and financing cash flows, unlevered free cash flow, free cash flow after debt service, and the monthly cash balance against the minimum cash requirement.
- Operating cash flow with working capital movements
- Investing cash flow by capex category, grants and disposals
- Equity, debt, shareholder loans, dividends and fees
- Unlevered FCF and FCF after debt service
- Beginning and ending cash reconciliation
12. Balance Sheet
The Balance Sheet brings the three-statement EV financial model together. It covers PP&E by asset class, working capital, debt, shareholder loans and equity. An automatic balance check confirms total assets equal liabilities plus equity in every period.
- Cash, receivables, prepayments and deposits
- Gross PP&E by class, accumulated depreciation and intangibles
- Short-term and long-term debt split
- Share capital, APIC, retained earnings and dividends
- Balance sheet check in every period
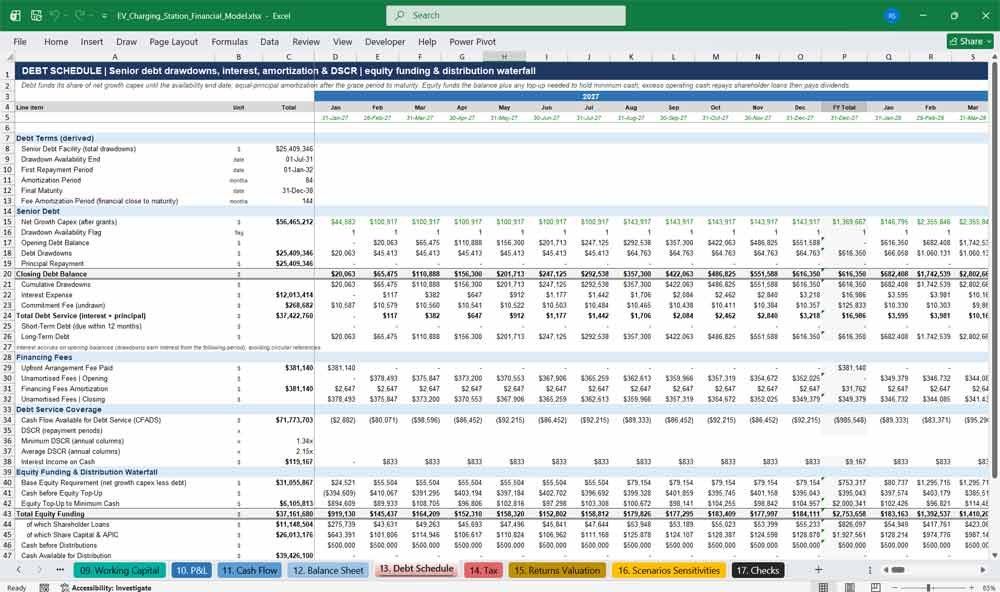
13. Debt Schedule
The Debt Schedule models senior project finance debt with drawdown availability, a grace period, straight-line amortization, interest, commitment and arrangement fees. It also includes DSCR and a full equity funding and distribution waterfall, with no circular references.
- Debt drawdowns linked to net growth capex and gearing
- Interest, commitment fees and fee amortization
- CFADS, DSCR, minimum and average DSCR
- Equity top-ups to maintain minimum cash
- Shareholder loan repayment and dividend waterfall
14. Tax
The Tax tab calculates taxable income and tax loss carry-forwards with a utilization cap. It also covers investment tax credits on charging equipment, deferred tax and cash taxes, giving a realistic view of the tax shield during construction and ramp-up.
- Taxable income and tax depreciation
- Tax loss pool with 80% utilization cap (adjustable)
- Investment tax credits generated and utilised
- Optional deferred tax asset recognition
- Cash taxes and effective tax rate
EV Charging Station Key KPIs
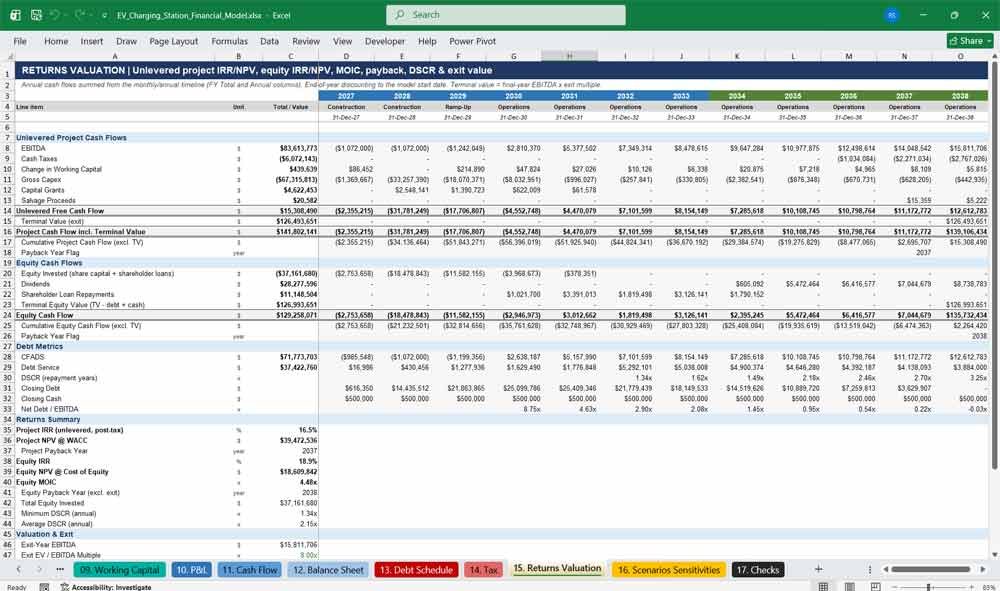
15. Returns Valuation
Returns Valuation delivers the key investor metrics for your EV charging project. It covers unlevered project IRR and NPV, equity IRR, NPV and MOIC, payback years, DSCR and an exit valuation based on an EV/EBITDA multiple, all built on annual cash flows.
- Project IRR and NPV at WACC
- Equity IRR, NPV at cost of equity and MOIC
- Project and equity payback year
- Terminal / exit enterprise value and exit equity value
- Annual DSCR and net debt / EBITDA
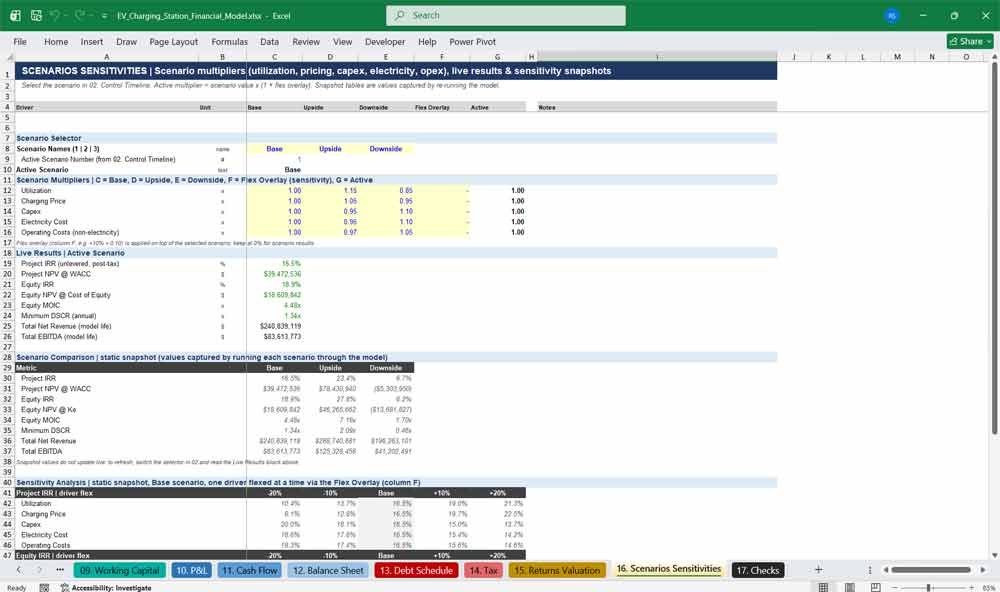
16. Scenarios Sensitivities
Scenarios Sensitivities lets you stress-test the EV charging business case. It holds Base, Upside and Downside multipliers for utilization, pricing, capex, electricity and opex, plus a flex overlay for custom sensitivities, live results, and scenario and sensitivity comparison tables.
- One-click scenario switching
- Flex overlay to test any driver ±%
- Live IRR, NPV, MOIC and DSCR for the active case
- Scenario comparison table (Base / Upside / Downside)
- Sensitivity tables for project IRR, equity IRR and NPV
17. Checks
The Checks tab gives reviewers confidence that the model is sound. It tests the balance sheet, cash reconciliation, EBITDA, revenue, capex, working capital, energy balance, debt repayment and formula errors in every period, then reports a single overall PASS or REVIEW status.
- 14 period-by-period integrity checks
- Model-level checks on dates, spend profiles, debt maturity and scenario inputs
- Formula error scan on every tab
- Overall model status linked to the Cover Summary
- No circular references by design
Why Buy This Model?
Building a credible EV charging business plan from scratch can take weeks of specialist work. This model gives you a complete, integrated and fully formula-driven EV charging station financial model from day one. It links site rollout and charger utilization to revenue, electricity costs, capex, financing, tax and returns in a clear, auditable structure. It is designed to the conventions used by project finance lenders, infrastructure investors and transaction advisors. That means colour-coded inputs, a single master timeline, monthly granularity where it matters, three fully linked financial statements, DSCR analysis and a dedicated checks tab. Whether you’re raising capital, bidding for sites, preparing a grant application or testing a new charging network strategy, you can replace the sample inputs with your own and have investor-ready outputs straight away.
EV Charging Station Frequently Asked Questions (Faq)
Q: I’m planning my first EV charging hub. Is this model suitable for a single site, or only for large networks?
A: Both. The model ships with a 20-site sample portfolio, but each site is one row in the Site Register. You can model a single hub by keeping one site and removing the others, or change site types, charger mix and opening waves to reflect your own rollout.
Q: Can I model different types of chargers?
A: Yes. AC (Level 2), DC fast and ultra-fast chargers each have their own power (kW), availability, utilization, kWh per session, session duration, price, capex, maintenance cost and replacement cycle. You set the number of each charger type per site type.
Q: How is charging revenue calculated?
A: kWh delivered is calculated as chargers × operating hours × availability × utilization × kW, with a site-by-site ramp-up. Revenue is kWh × price per kWh, split between peak, off-peak and fleet pricing. Connection, idle and parking fees, subscriptions and ancillary income are added separately.
Q: Does the model include electricity costs and demand charges?
A: Yes. Electricity cost of sales is kWh purchased × cost per kWh, where kWh purchased allows for charging efficiency losses. Separate lines cover wholesale energy, renewable premiums, supply, distribution and transmission charges, capacity charges and demand charges on billed peak demand.
Q: I want to start construction in a different year. Do I have to rebuild the timeline?
A: No. Change the Model Start Date on the Control Timeline tab and every date, month label, year header, site milestone and escalation index across all 17 tabs updates automatically.
Q: What time periods does the model cover?
A: A 24-month construction period modelled monthly, then 10 years of operations. Year 1 is the ramp-up year. Years 1–5 are monthly with a full-year total column, and years 6–10 are annual. All annual totals roll up automatically for the summary and returns.
Q: Will lenders and investors be comfortable with the structure?
A: The model follows widely used financial modelling conventions: separated inputs, formulas and links; an integrated P&L, cash flow and balance sheet; a debt schedule with DSCR; and a checks tab confirming the balance sheet balances. Every lender runs their own due diligence, but the model is built to make that review straightforward.
Q: Can I test downside scenarios for my investment committee?
A: Yes. Choose Base, Upside or Downside from one selector, or use the flex overlay to move utilization, pricing, capex, electricity cost or opex by any percentage. Project IRR, equity IRR, NPV, MOIC and DSCR update live.
Q: What financing structure does the debt schedule support?
A: Senior debt funds a set share of net growth capex during a drawdown availability period, followed by a grace period and straight-line amortization to maturity. It includes interest, commitment and arrangement fees. Equity and shareholder loans fund the balance, with a distribution waterfall for excess cash.
Q: Does it handle grants, tax credits and tax losses?
A: Yes. Capital grants reduce charger capex, and operating grants and clean fuel or carbon credits appear as revenue. The tax tab includes investment tax credits, tax loss carry-forwards with a utilization cap, and optional deferred tax asset recognition.
Q: Are the sample numbers based on real market data?
A: No. The inputs are illustrative placeholders so you can see how the model works. Before using the outputs for any decision, replace them with your own site data, supplier quotes, tariffs and financing terms.
Q: What currency is the model in? Can I change it?
A: The model is presented in US dollars. Because every value comes from the Assumptions sheet, you can enter figures in any currency. You’d just need to update the currency labels and number formats to suit.
Q: Which version of Excel do I need? Are there macros?
A: There are no macros or VBA. We recommend Microsoft Excel 2019 or Microsoft 365, as the checks use modern functions such as MINIFS and MAXIFS. The model contains no circular references, so no iterative calculation settings are needed.
Q: How do I know the model is working correctly after I change the inputs?
A: Look at the Checks tab or the Model Integrity section on the Cover Summary. Fourteen period-by-period checks, plus model-level and formula-error checks, roll up into one overall PASS or REVIEW status, so you’ll know immediately if anything needs attention.
Q: Can I add more sites or change the rollout schedule?
A: The rollout schedule is fully flexible. Assign each site to one of four opening waves, set each wave’s opening date offset, and add site-specific construction delays. The register holds 20 sites as built. Adding more rows needs the portfolio formula ranges extended to match.
Final Notes On The Financial Model
This Electric Vehicle Charging Station Finance Model has:
- Profitability Focus: The station should aim for high-margin revenue streams (retainers and subscriptions).
- Cash Flow Management: Keep an eye on accounts receivable to avoid cash shortages.
- Scalability Strategy: Automate low-tier services to keep operational costs low.
- Long-Term Sustainability: Invest in branding, client loyalty, and technology to enhance efficiency.