
Synthetic Biology Financial Model Template
The Synthetic Biology Financial Model is a complete, investor-ready Excel template built for synbio startups, biotech founders, CFOs and investors who need to forecast a synthetic biology business with confidence. It covers the full value chain of an engineered-biology company, from R&D programs, strain development and enzyme engineering through biomanufacturing scale-up, commercial revenue, funding rounds and valuation. With 19 fully integrated tabs and more than 73,000 live formulas, this biotech financial model turns your scientific roadmap into a bankable 10-year financial plan with a linked income statement, cash flow statement and balance sheet.
Financial Model for a Synthetic Biology Company
Unlike generic startup templates, this synthetic biology Excel model is designed around how synbio companies actually create value. It models development stages from Discovery to Commercial Launch, probability of technical, regulatory and commercial success, fermentation and bioprocess economics (titer, yield, batch size and bioreactor capacity), and diversified revenue streams including product sales, licensing, milestones, royalties, research services, SaaS subscriptions and contract manufacturing. The result is a realistic, risk-adjusted forecast that reflects the long timelines, high R&D intensity and binary outcomes typical of the synthetic biology and industrial biotech sector.
The model runs monthly for Years 1–5, with an annual roll-up column for each year, and annually for Years 6–10, in US dollars. Change one start date and every tab, header and launch date in the workbook updates automatically. Built-in DCF, exit-multiple and rNPV valuation, a Base / Upside / Downside scenario selector, cash runway and dilution analysis, and a dedicated Checks tab make this the ideal synthetic biology financial projection template for fundraising, board reporting, investor due diligence and strategic planning.
What’s Inside: Tab-by-Tab Overview
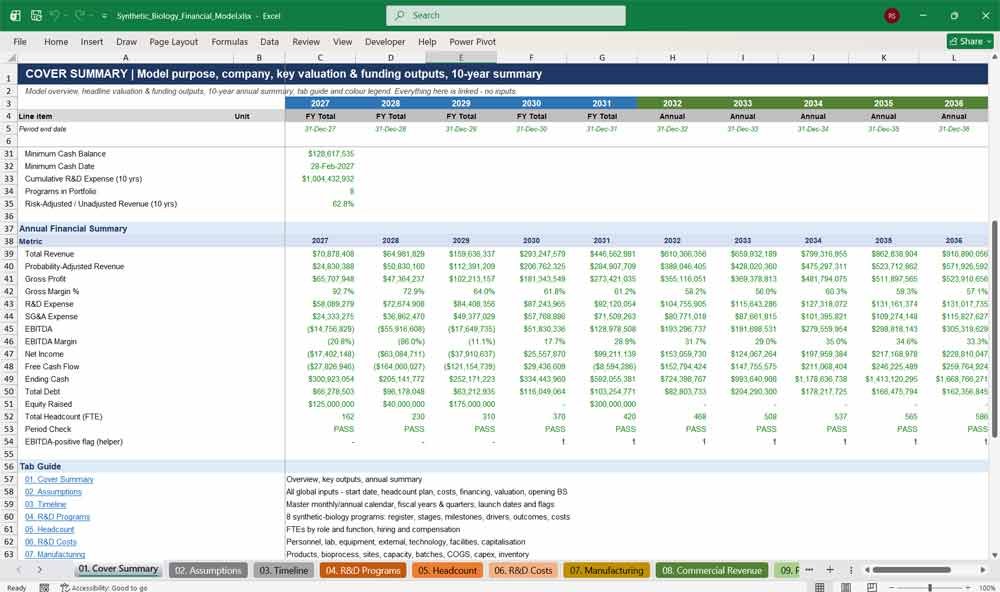
01. Cover Summary
The Cover Summary gives investors and founders an instant snapshot of the synthetic biology business plan. It shows enterprise value, equity value per share, peak revenue, EBITDA breakeven year, total funding raised and minimum cash, along with a clear ten-year annual financial summary.
- Headline valuation outputs: blended EV, DCF, rNPV and exit multiples
- 10-year summary of revenue, EBITDA, net income, free cash flow and cash
- Live model-integrity status and active scenario display
- Hyperlinked tab guide and colour-coded input legend
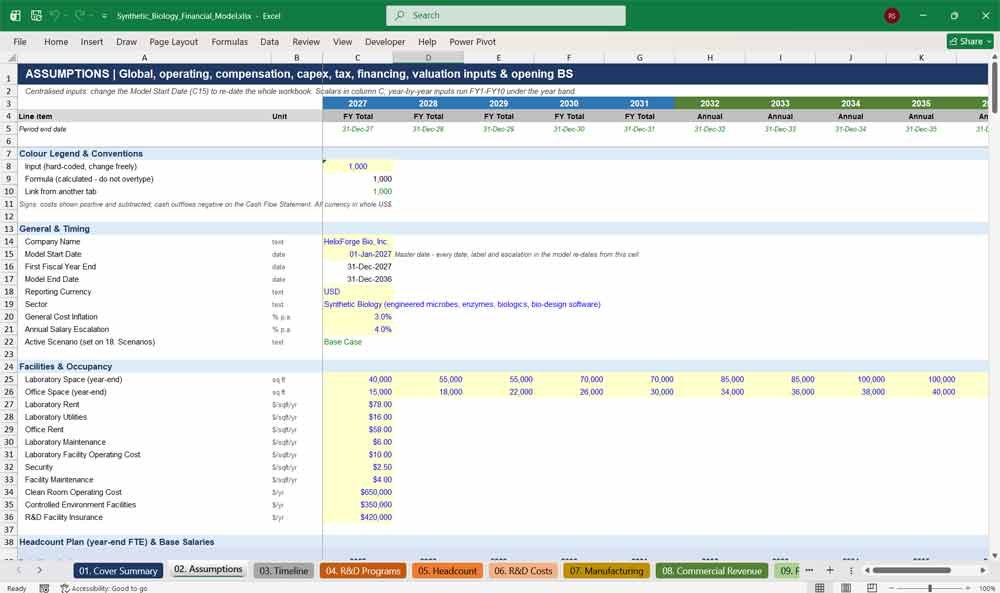
02. Assumptions
The Assumptions tab holds every operating, financial, tax and valuation input for your synthetic biology startup in one place. You can edit the headcount plan, laboratory costs, manufacturing parameters, pricing adjustments, financing terms and opening balance sheet without touching a single formula.
- One master start date drives the whole workbook’s timeline
- Year-by-year headcount plan across 22 scientific and corporate roles
- Debt facilities, ten equity rounds, grants and government funding
- Tax, NOL utilisation, WACC, terminal growth and exit multiples
Synthetic Biology Revenues & Costs
03. Timeline
The Timeline tab is the master calendar for the biotech financial model. It generates monthly periods, fiscal years, quarters, inflation and salary indices, plus program launch dates and commercial flags. Every forecast tab links to it, so dates always stay consistent.
- Monthly Years 1–5 with FY Total columns, annual Years 6–10
- Fiscal year, quarter, model month and year-index counters
- Program launch dates including scenario-driven delays
- Months since launch and pre-launch windows for every program
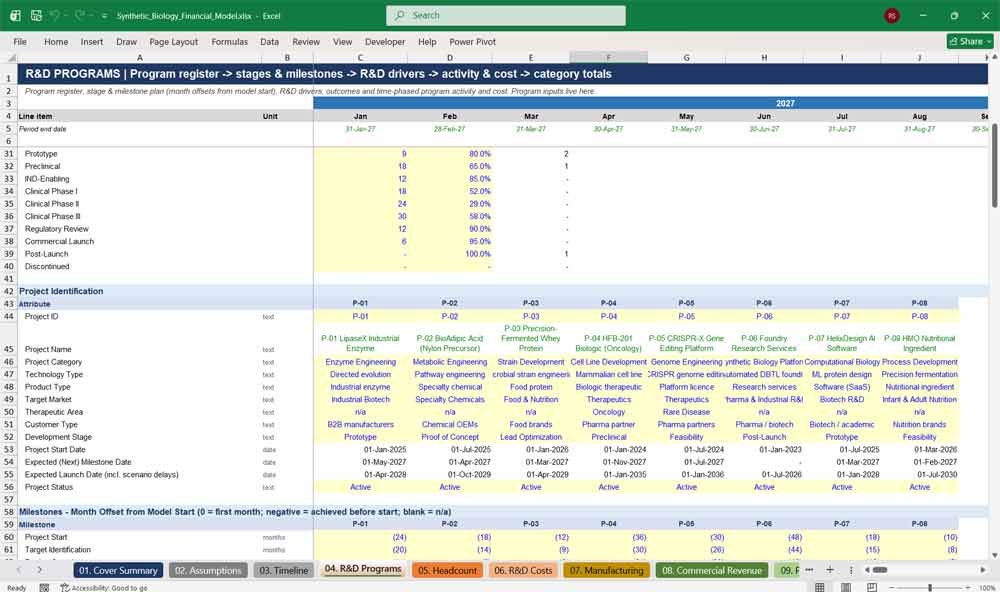
04. R&D Programs
The R&D Programs tab models eight synthetic biology programs across fifteen project categories, including strain development, enzyme engineering, metabolic engineering and genome engineering. It tracks development stages, milestones, laboratory capacity, experimental throughput, success rates and program-level R&D cost.
- 14 development stages, Discovery through Post-Launch
- 14 milestones from Target Identification to Customer Qualification
- R&D drivers: scientists per project, FTE allocation, lab capacity
- Project outcomes: peak revenue, launch year, discontinuation probability
05. Headcount
The Headcount tab builds a monthly hiring plan for R&D, manufacturing, sales and marketing, and G&A teams. It calculates new hires, attrition, recruiting costs, escalating salaries and fully loaded compensation, including benefits, payroll taxes and stock-based compensation for every role.
- 22 roles, from research scientists to bioinformaticians
- Monthly FTEs interpolated from year-end hiring targets
- Benefits, payroll tax and stock-based compensation loading
- Revenue per employee and cost per FTE KPIs
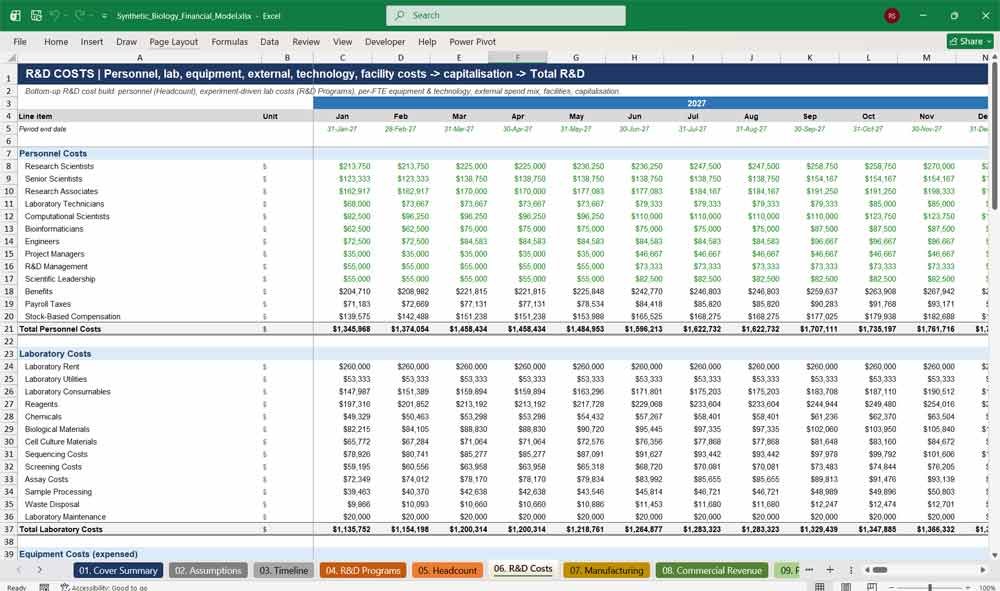
06. R&D Costs
The R&D Costs tab gives a bottom-up forecast of synthetic biology research spending. It covers personnel, laboratory consumables, reagents, sequencing, screening, equipment, CRO and CMO costs, software, cloud computing and facilities, with R&D capitalisation and cost allocation built in.
- Experiment-driven lab costs: reagents, assays, sequencing per sample
- External R&D split across CRO, CMO, academic and licensing partners
- Technology stack: LIMS, ELN, bioinformatics tools and cloud
- Capitalised development and software, plus R&D expense drivers
07. Manufacturing
The Manufacturing tab models biomanufacturing economics, including fermentation, culture volume, titer, recovery and purification yields. It turns site capacity into capacity-constrained production, batches, cost of goods, capex and inventory, so you can see exactly what scale-up costs and how it constrains growth.
- Product, bioprocess, site and scale-up registers
- Capacity, utilisation, downtime, scrap and bottleneck analysis
- Cost per batch, kilogram, gram, litre and dose
- Facility and bioreactor capex, CMO overflow and contract manufacturing
08. Commercial Revenue
The Commercial Revenue tab forecasts synthetic biology revenue from TAM, SAM and SOM down to customers, volumes and pricing. It covers product sales, platform fees, licensing upfronts, milestones, royalties, research services, subscriptions and contract manufacturing, with revenue adjustments and a geographic split.
- Customer ramp, churn, retention and acquisition by program
- Capacity-constrained volumes with price escalation and discounts
- Ten revenue streams, including licensing, royalties and SaaS
- Revenue by program and across seven global regions
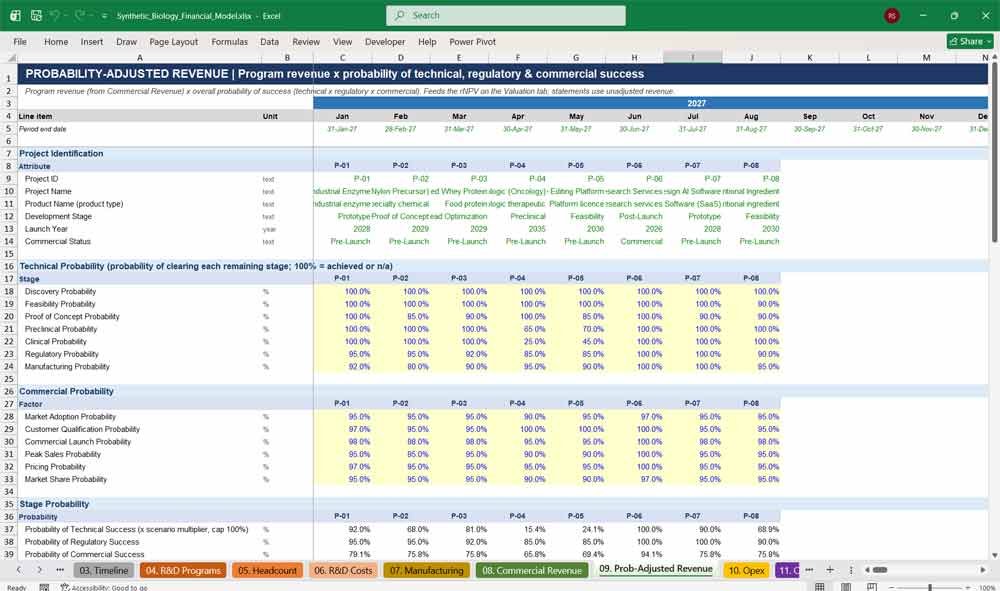
09. Probability-Adjusted Revenue
The Probability-Adjusted Revenue tab applies technical, regulatory and commercial probability of success to each program’s revenue. It produces the risk-adjusted forecast that biotech investors expect, showing revenue at risk and expected revenue across the whole synthetic biology portfolio.
- Stage-by-stage technical and regulatory probabilities
- Commercial probabilities for adoption, pricing and market share
- Overall probability of success for each program
- Unadjusted vs. risk-adjusted revenue and revenue at risk
10. Opex
The Opex tab forecasts sales and marketing and general and administrative costs for a growing synbio company. It covers customer acquisition, launch readiness, business development, advertising, legal and patent costs, insurance, professional fees, IT, office costs and public-company costs after an IPO.
- Sales and marketing costs linked to customers and revenue
- G&A, including patent prosecution for each active program
- Post-IPO public company cost switch
- Company-wide memo of facilities, insurance and legal costs
11. Capex D&A
The Capex D&A tab tracks capital expenditure for manufacturing plants, bioreactors, laboratory equipment, IT and fit-outs. Fixed-asset and intangible roll-forwards calculate depreciation and amortisation, net book value and the depreciation that flows into cost of revenue.
- Manufacturing, R&D laboratory and corporate capex
- Nine asset classes, including patents and capitalised development
- Straight-line D&A capped at net book value
- Gross PP&E, accumulated depreciation and net PP&E
Synthetic Biology Financial Statements
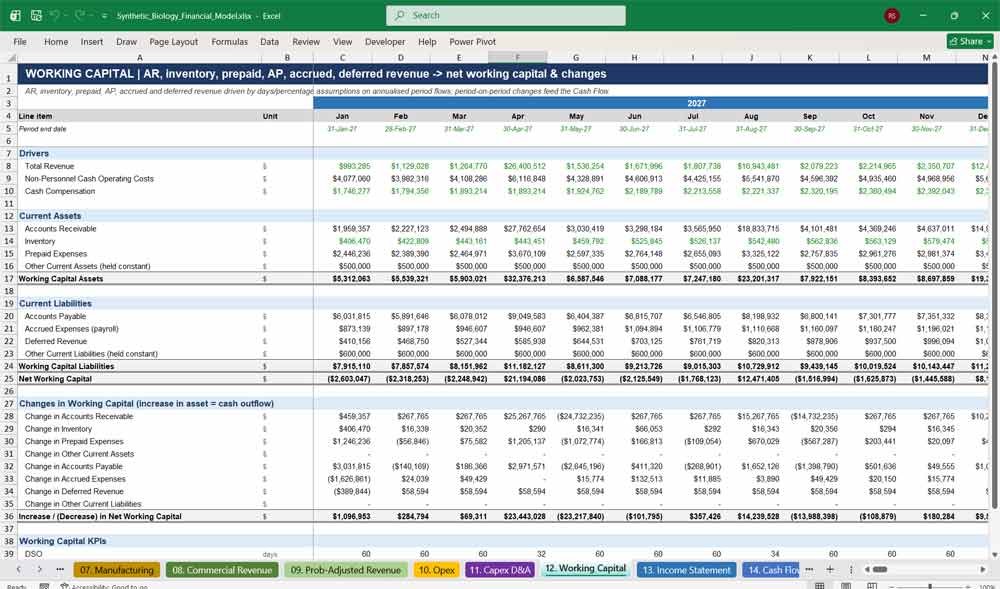
12. Working Capital
The Working Capital tab calculates accounts receivable, inventory, prepaid expenses, accounts payable, accrued payroll and deferred revenue for the synthetic biology business. It drives cash-flow changes from DSO, DPO and inventory days, giving a realistic view of cash tied up in operations.
- AR, inventory, AP, accruals and deferred revenue
- Subscription and platform fees billed in advance
- Period-on-period changes feeding the cash flow
- DSO, DIO, DPO and NWC as a percentage of revenue
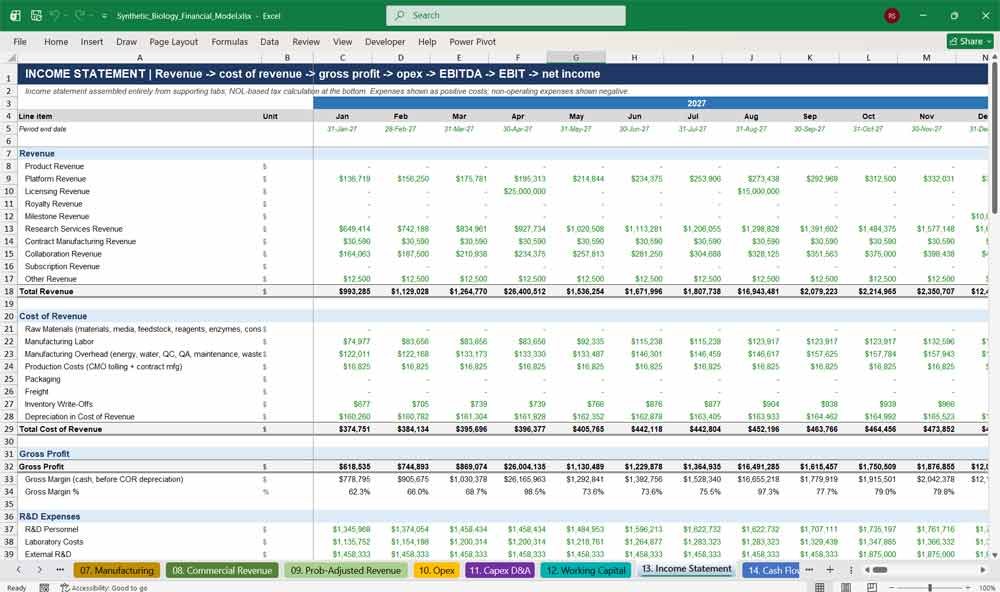
13. Income Statement
The Income Statement presents a full synthetic biology P&L. It runs from ten revenue streams through cost of revenue, gross margin, R&D, sales and marketing, and G&A to EBITDA, EBIT, interest, tax and net income, with NOL carry-forward and deferred tax calculations included.
- Revenue by stream and detailed cost of revenue
- Gross margin, EBITDA, EBIT and net margins
- NOL utilisation, current tax and deferred tax asset
- Independent EBITDA reconciliation check
14. Cash Flow Statement
The Cash Flow Statement uses the indirect method to reconcile net income to cash. It shows operating, investing and financing cash flows, gross and net cash burn, monthly burn, cash runway, free cash flow and cash conversion, which are key metrics for biotech fundraising.
- Operating, investing and financing cash flows
- R&D cash flow memo: cash spend, capitalised and external
- Monthly, quarterly and annual cash burn
- Cash runway, free cash flow and FCF margin
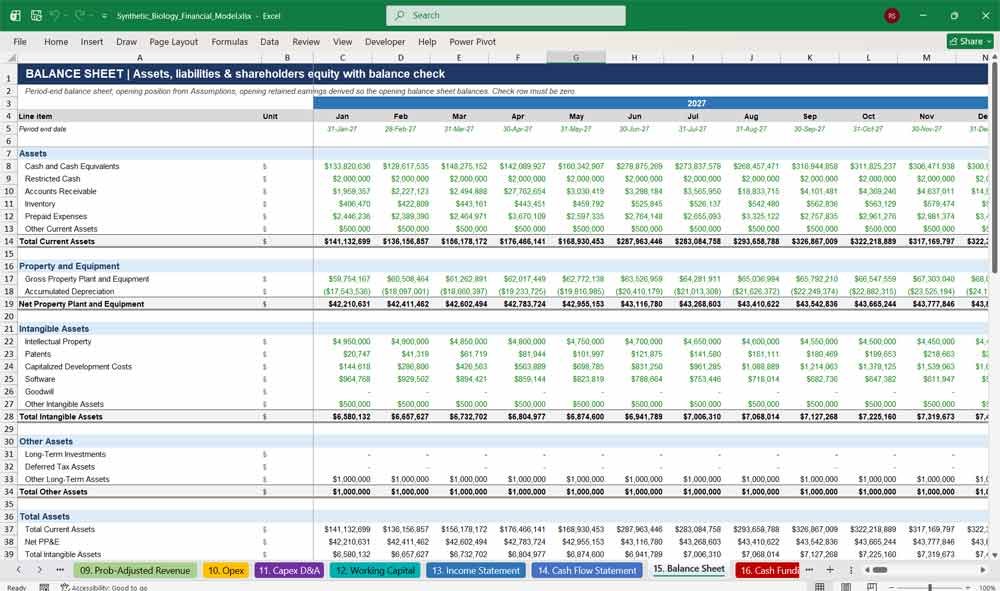
15. Balance Sheet
The Balance Sheet presents period-end assets, liabilities and shareholders’ equity, including PP&E, intangibles, capitalised development, debt, convertibles, APIC and accumulated deficit. A built-in balance check confirms that assets equal liabilities plus equity in every forecast period.
- Current, fixed, intangible and other long-term assets
- Current and long-term liabilities, including convertible debt
- Equity: common stock, APIC, retained earnings and treasury stock
- Automatic balance sheet check for every period
16. Cash Funding
The Cash Funding tab plans how the synthetic biology startup is financed. It models Seed through Series D, strategic and IPO rounds, venture debt, term loans, an automatic revolver, equipment financing, convertible notes and grants, and calculates dilution, runway and capital structure.
- Ten equity rounds with pre-money, post-money and price per share
- Ownership dilution and investor ownership by round
- Venture debt, term loan, revolver and convertible note mechanics
- Funding gap, cash runway and minimum cash date
Key KPIs For Synthetic Biology (Synbio)
17. Valuation
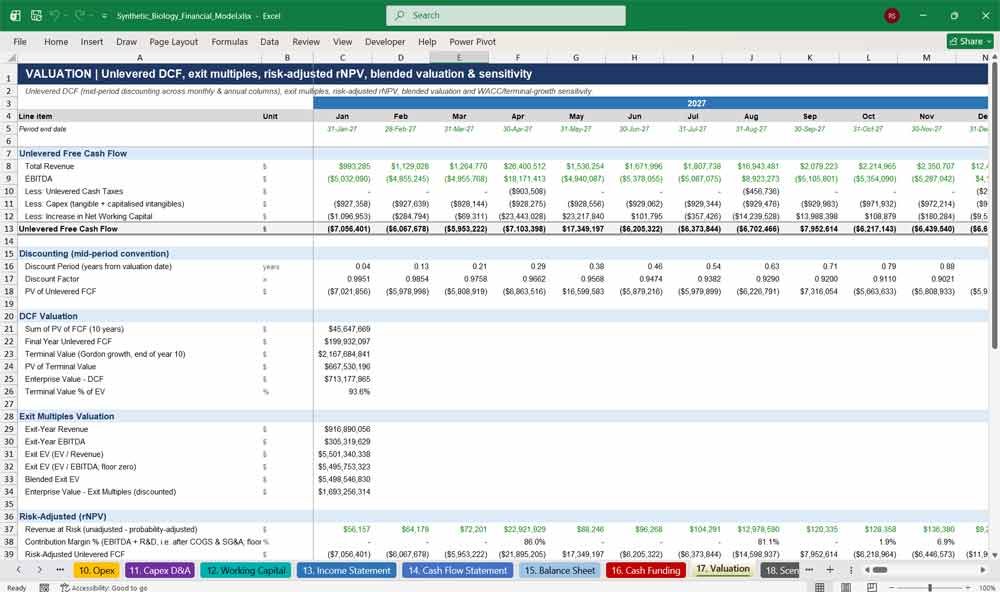
The Valuation tab values the synthetic biology company using an unlevered DCF, exit EV/revenue and EV/EBITDA multiples, and a risk-adjusted rNPV. It blends these into an enterprise and equity value per share, supported by a WACC and terminal-growth sensitivity table.
- Mid-period discounting across monthly and annual columns
- Gordon-growth terminal value and exit-multiple valuation
- rNPV using probability-adjusted revenue
- Blended valuation and a 5×5 sensitivity grid
18. Scenarios
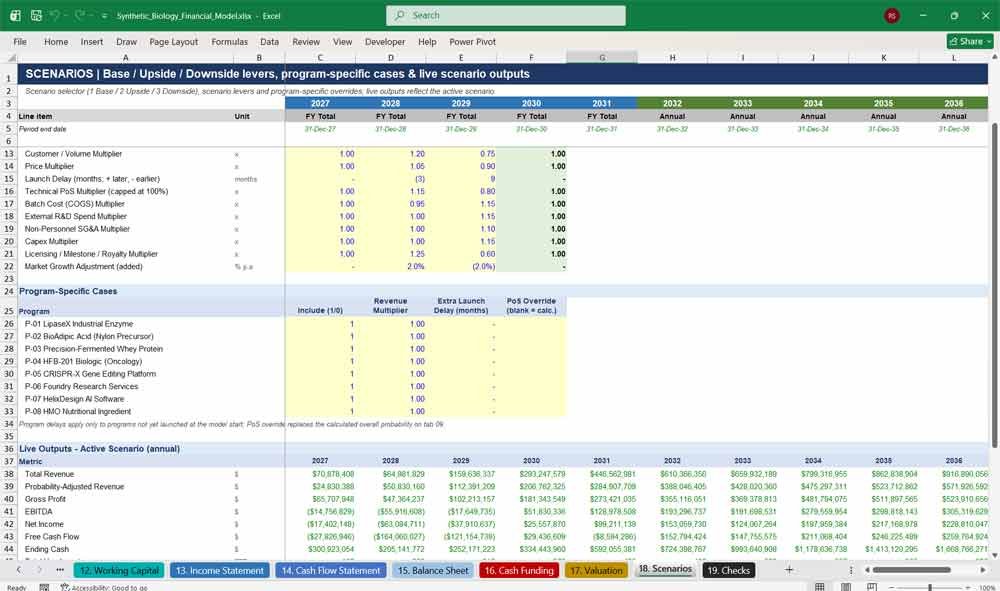
The Scenarios tab lets you switch the whole biotech financial model between Base, Upside and Downside cases with one cell. You can adjust volumes, pricing, launch timing, probability of success, COGS, R&D spend, opex, capex and licensing, or override individual programs.
- One-click Base / Upside / Downside selector
- Ten scenario levers, including launch delays and PoS
- Program-specific include, revenue and delay overrides
- Live outputs for revenue, EBITDA, cash and valuation
19. Checks
The Checks tab runs automatic integrity tests across the synthetic biology financial model. These cover balance sheet balancing, cash ties, revenue and cost reconciliations, capex, D&A, capacity, revolver limits, circularity and formula errors, with a PASS or REVIEW flag for every period.
- 20 per-period integrity checks
- Input checks for mixes, weights and scenario selection
- Overall model status shown on the cover
- No circular references by design
Why Buy This Model?
Building a credible synthetic biology financial model from scratch takes weeks of specialist work, and most generic startup templates miss what matters in synbio: long development timelines, probability-weighted pipelines, fermentation scale-up and complex funding stacks. This template gives you all of that from day one. It is fully integrated, formula-driven and professionally formatted, with colour-coded inputs, dynamic dates, scenario analysis, DCF and rNPV valuation, and built-in error checks. Whether you are preparing a Series A pitch, defending a valuation in due diligence, planning a biomanufacturing plant or reporting to your board, this model saves you time, reduces risk and presents your synthetic biology business the way investors expect to see it.
Synthetic Biology Frequently Asked Questions
Is this model suitable for an early-stage synbio startup with no revenue yet?
Yes. The model is built for pre-revenue and early-commercial synthetic biology companies. It forecasts R&D spend, cash burn, runway and funding needs before launch, then ramps revenue from each program’s launch date. That makes it ideal for Seed, Series A and Series B fundraising.
Can I use it for my specific type of synthetic biology business?
Yes. It includes fifteen R&D project categories and ten revenue streams, so it works for industrial enzymes, specialty chemicals, precision-fermented food proteins, nutritional ingredients, biologics, gene-editing platforms, foundry and research services, and bio-design software. You can rename programs, change categories and switch revenue streams on or off to fit your business.
Does it include sample data?
Yes. The model comes pre-filled with an illustrative eight-program synbio company, so you can see how every tab works before entering your own numbers. All example figures are clearly marked inputs that you can overwrite.
How do I change the start date of the model?
Change the Model Start Date on the 02. Assumptions tab. Every date, year header, month label, launch date and escalation in the whole workbook updates automatically. No manual re-dating is needed.
What time periods does the model cover?
The model covers ten years. Years 1–5 are monthly, with an annual FY Total column for each year. Years 6–10 are annual. All figures are in US dollars.
Does the model include a three-statement financial forecast?
Yes. It includes a fully linked income statement, cash flow statement and balance sheet. The balance sheet balances in every period, and ending cash ties to the cash flow statement automatically.
How does the model handle risk and probability of success?
Each program has technical, regulatory and commercial probabilities of success. The 09. Probability-Adjusted Revenue tab applies these to program revenue to produce a risk-adjusted forecast, which feeds the rNPV valuation on the 17. Valuation tab.
Can I model manufacturing scale-up and capacity constraints?
Yes. The 07. Manufacturing tab models bioreactor size, titer, recovery and purification yield, batch output, site capacity, downtime, scrap and CMO overflow. Sales are automatically limited by available capacity, and you can add sites or expansions with their own capex and timing.
What valuation methods are included?
The model includes an unlevered DCF with a terminal value, exit EV/revenue and EV/EBITDA multiples, and a risk-adjusted net present value (rNPV). These are blended into an enterprise value, equity value and value per share, with a WACC and terminal-growth sensitivity table.
Can I run different scenarios?
Yes. The 18. Scenarios tab has a one-cell selector for Base, Upside and Downside cases. Each case adjusts volumes, pricing, launch timing, probability of success, costs, capex and licensing income. You can also include, exclude, delay or override individual programs.
How are funding rounds and dilution calculated?
On the 16. Cash Funding tab, you enter each equity round’s timing, amount and pre-money valuation. The model calculates price per share, new shares, dilution and investor ownership. It also models venture debt, term loans, convertible notes, equipment financing, grants and an automatic revolver that protects your minimum cash balance.
Will the model show how long my cash will last?
Yes. The model calculates monthly, quarterly and annual cash burn, cash runway in months, the minimum cash balance and the date it occurs, and any funding gap. These are the numbers investors ask about first.
Do I need advanced Excel skills to use it?
No. Inputs are shown in blue text on a yellow background, formulas are in black, and links between tabs are in green, so you always know what is safe to edit. A hyperlinked tab guide on the cover and a summary line at the top of every tab make it easy to navigate.
Does the model contain macros or circular references?
No. It uses standard Excel formulas only, with no macros, VBA or circular references, so it is transparent, stable and easy to audit.
How do I know the numbers are correct?
The 19. Checks tab runs automatic integrity checks every period, including balance sheet balancing, cash reconciliation, revenue and cost tie-outs, capex, D&A, capacity and formula errors. If every check passes, the cover shows PASS.
Which version of Excel do I need?
The model works in Microsoft Excel 2019 or later, including Microsoft 365, on Windows and Mac.
Can I present this model to investors or lenders?
Yes. The model follows professional, investor-ready formatting conventions with clear section headers, consistent number formats and visible reconciliation checks, so it is ready for pitch meetings, due diligence data rooms and board packs.
Further Reading
Biotech Model: A robust financial model for your life sciences venture. You can easily customize this comprehensive Biotech Company Financial Model to forecast R&D expenses, clinical trial burn rates, and venture capital runway.
- Biochemical Fermentation Template: Financial model for a bioprocess manufacturing facility. You can easily customize this comprehensive Biochemical Fermentation Financial Model to forecast capital expenditures, downstream purification costs, and venture capital runway.
Final Notes on the Financial Model
This 10 Year Synthetic Biology Company Financial Model focuses on balancing capital expenditures with steady revenue growth from a diversified product line. By optimizing operational costs, and power efficiency, and maximizing high-margin services, the models ensure sustainable profitability and cash flow stability.
Download Link On Next Page
Download Link On Next Page