
Biotech Financial Model Template
Building a credible financial model for a biotech or pharmaceutical company means more than projecting revenue — it means modeling the entire drug development lifecycle, from preclinical research through Phase I-III trials, regulatory approval, commercial launch, and patent expiry. This biotech financial model template is a fully integrated, investor-ready Excel model built specifically for biopharmaceutical companies, clinical-stage drug developers, and life sciences startups that need to forecast R&D spend, pipeline value, and cash runway with precision. Every formula is dynamic, every date is linked, and every assumption is transparent — so you spend your time making decisions, not debugging spreadsheets.
15-year Financial Model For a Biotech Company
Unlike generic startup financial model templates, this Excel biotech model is engineered around the real value chain of a pharmaceutical business: pipeline programs, development milestones, probability of technical and regulatory success, patient populations, pricing, and revenue. It includes a full three-statement financial model (income statement, cash flow, balance sheet), a risk-adjusted rNPV and DCF valuation engine, scenario analysis for bull/base/bear outcomes, and a complete investor cap table with dilution and IRR/MOIC calculations. Whether you’re preparing a Series B pitch deck, a board presentation, or an internal budget, this model gives you a professional, bankable financial forecast in hours instead of weeks.
Designed for founders, CFOs, biotech consultants, investment bankers, venture capital analysts, and equity research professionals, this pharmaceutical financial model template combines monthly granularity for near-term planning (Years 1–5) with annual detail for long-range forecasting (Years 6–15), all driven from a single, editable start date. Change one cell and the entire 15-year model — every tab, every date, every chart — updates automatically. If you need a drug development financial model that actually reflects how biotech companies create and lose value, this is the template built for that job.
Why Buy This Model
Most financial model templates are built for SaaS companies and retrofitted for biotech — bolting “R&D expense” onto a subscription-revenue engine and calling it a pharma model. This one isn’t retrofitted; it’s purpose-built. It starts from the actual mechanics of drug development — pipeline, trials, probability of success, launch, patients, price — and lets every downstream number, from R&D burn to rNPV to your cap table, flow from those real drivers. You’re not buying a spreadsheet with biotech labels on generic rows; you’re buying the actual logic of how a pharmaceutical company spends cash and creates value, fully built out, fully linked, and ready to defend in front of an investor, a board, or a diligence team.
Tab-by-Tab Breakdown
01. Cover Index
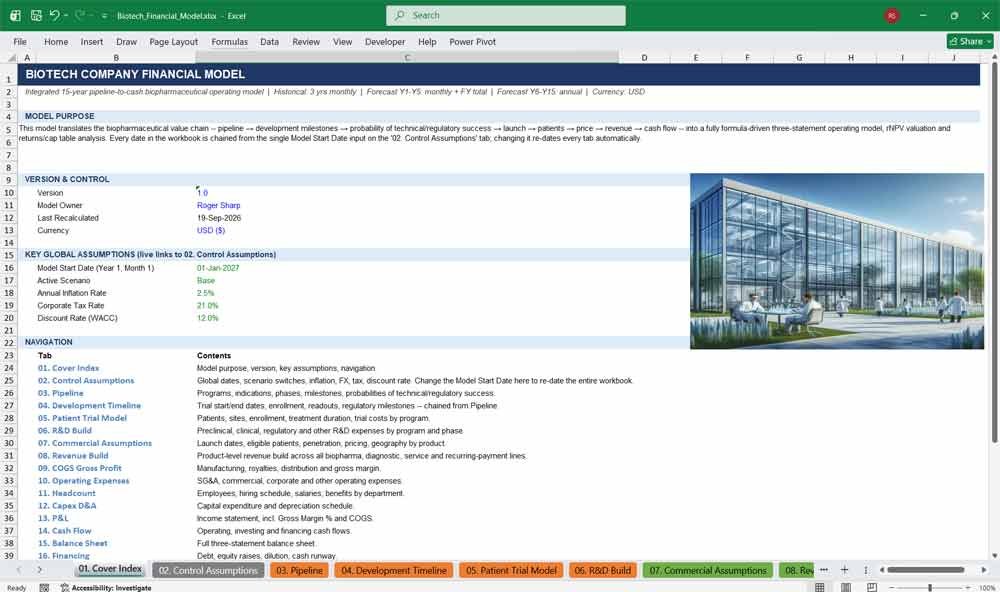
Every professional financial model needs a clear entry point, and this Excel biotech model’s cover tab delivers exactly that — model purpose, version control, key global assumptions, and full clickable navigation across all 21 tabs. It’s the executive summary your investors see first, setting a credible, organized tone.
Highlights:
- One-click hyperlinked navigation to every tab in the model
- Live-linked snapshot of key assumptions (start date, scenario, tax, discount rate)
- Color-coding legend so any user instantly knows what’s editable
- Version control and model ownership fields for team collaboration
02. Control Assumptions
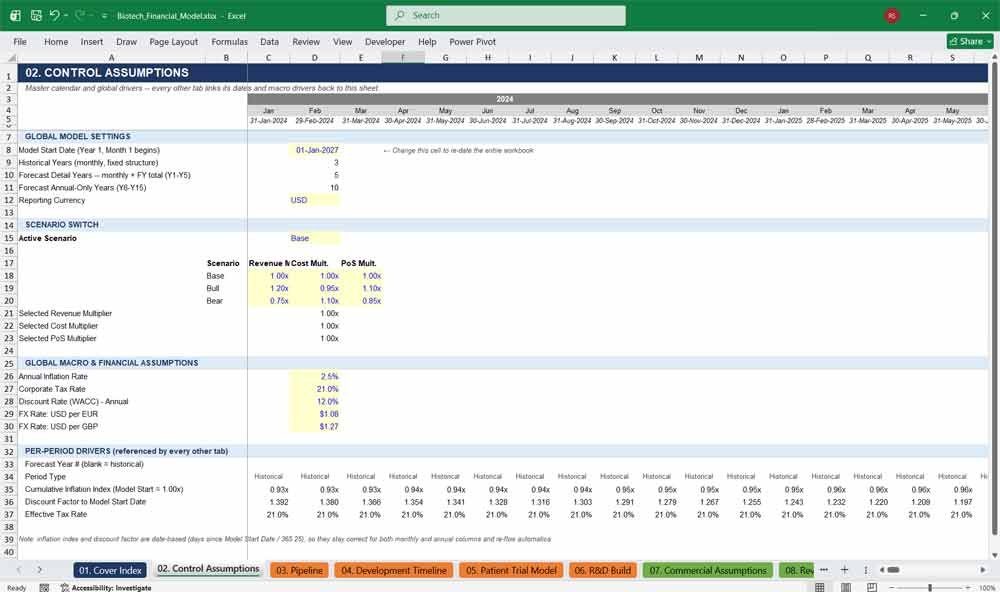
The command center of the entire biotech financial model — a single Model Start Date cell drives every date across all 21 tabs, while scenario switches, inflation, FX rates, tax rate, and discount rate control the whole forecast. Change one input here and the full 15-year model re-dates and recalculates instantly.
Highlights:
- One input re-dates the entire 15-year model automatically
- Built-in Base/Bull/Bear scenario switch with editable multipliers
- Global macro assumptions: inflation, FX, tax rate, WACC/discount rate
- Per-period inflation index and discount factor rows power every other tab
Biotech Company R&D Financing
03. Pipeline
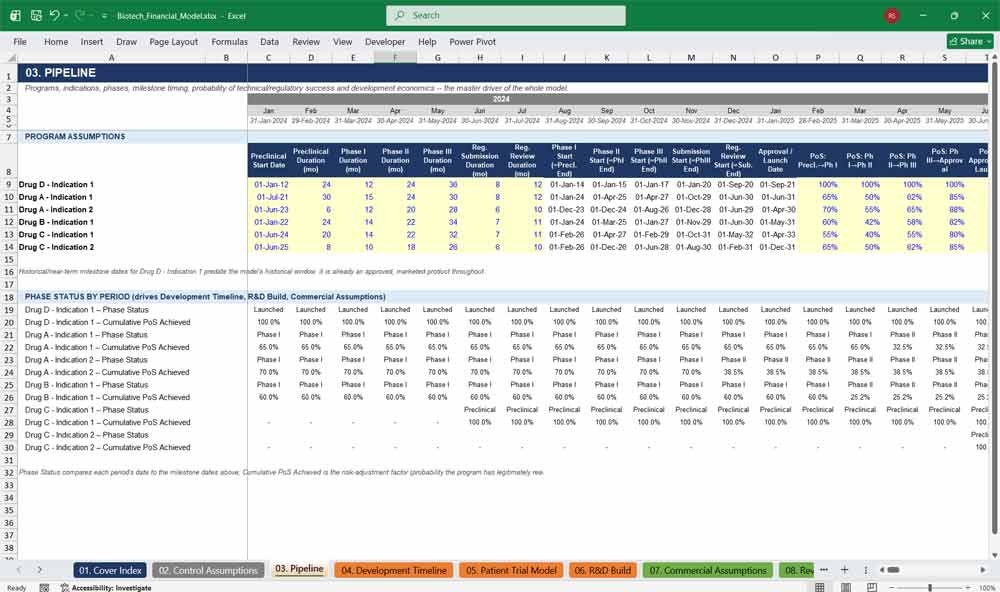
The heart of any drug development financial model — this tab tracks every program and indication through discovery, preclinical, Phase I-III, submission, and approval, with probability of technical and regulatory success at each gate. It’s the single source of truth that every other tab in the model references.
Highlights:
- Six fully modeled programs across four drug/indication combinations
- Phase-by-phase probability of success (PoS) and cumulative risk-adjustment
- Auto-calculated milestone dates chained from one preclinical start date
- Development cost, milestone payments, and royalty rate inputs per program
04. Development Timeline
A clear, visual milestone calendar that converts the Pipeline tab’s raw assumptions into readable trial timing — preclinical start, Phase I-III windows, submission, regulatory review, launch, peak sales, and patent expiry — flagged automatically period-by-period so you always know what’s happening and when.
Highlights:
- Live-linked milestone dates for every program, sourced from Pipeline
- Automatic “key event” flags by month across the full forecast
- Tracks readouts, regulatory milestones, and patent/exclusivity expiry
- Zero manual date entry — everything chains from one input
05. Patient Trial Model
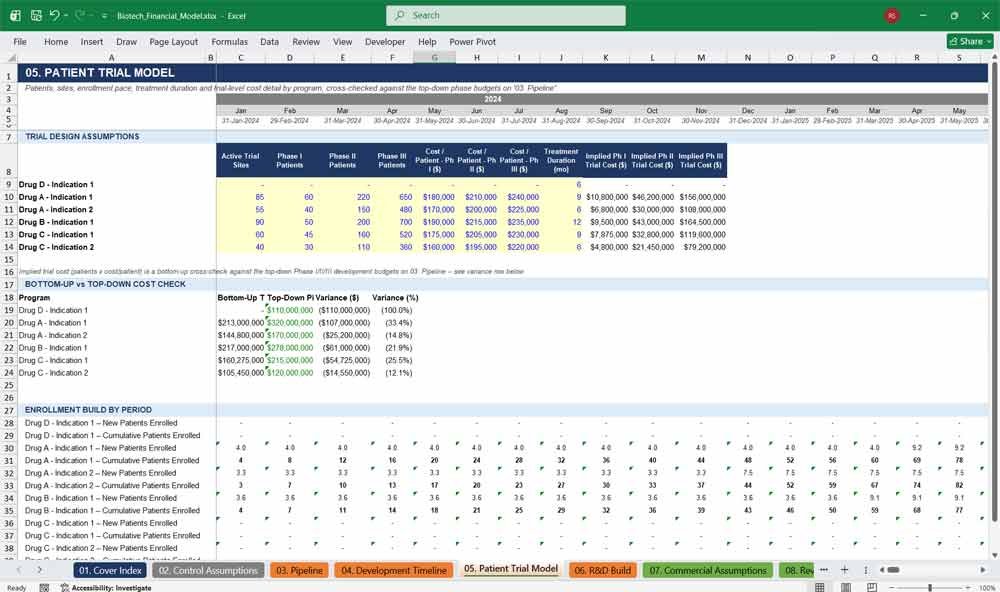
Bottom-up clinical trial modeling that biotech investors expect to see — patient counts, active sites, enrollment pace, treatment duration, and per-patient trial costs by phase, cross-checked automatically against the top-down R&D budget so your numbers always reconcile.
Highlights:
- Enrollment builds monthly, driven directly by each program’s phase status
- Bottom-up vs. top-down cost variance check built in automatically
- Site count and treatment duration assumptions by program
- Cumulative patients-enrolled tracking across the full trial lifecycle
06. R&D Build
A fully automated R&D expense engine that allocates preclinical, clinical (Phase I-III), and regulatory costs across exactly the months each program is active — no manual cost-phasing required. Includes an R&D overhead layer and scenario-adjusted totals for sensitivity testing.
Highlights:
- R&D spend auto-allocated by phase and by month, zero manual work
- Category subtotals: preclinical, clinical, regulatory, and overhead
- Feeds directly into the P&L and cash flow statement
- Scenario-multiplier adjusted for bull/base/bear cost sensitivity
07. Commercial Assumptions
Everything a launch forecast needs — addressable patients, diagnosis rate, treatment rate, peak market share, and inflation-escalated net pricing — with a realistic market-share ramp from launch to peak and an automatic step-down after patent or exclusivity expiry.
Highlights:
- Full patient funnel: addressable, diagnosed, treated, and on-therapy
- Market share ramps to peak, then models patent-cliff erosion
- Inflation-adjusted net pricing by product, fully dynamic
- Launch and peak-sales dates linked live from the Pipeline tab
Biotech Company Financial Statements
08. Revenue Build
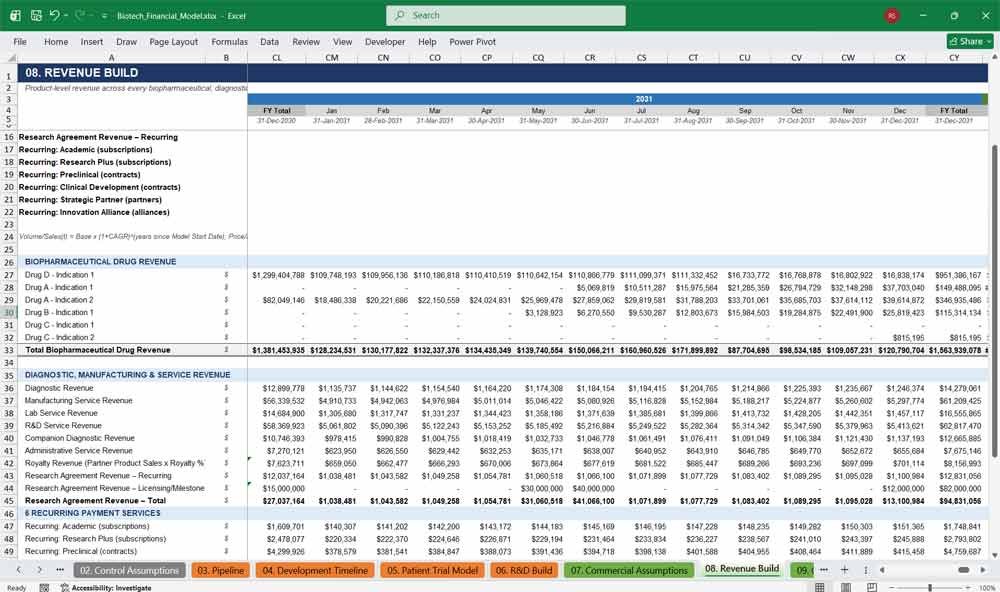
A comprehensive, multi-stream pharmaceutical revenue model covering branded drug sales, diagnostics, manufacturing services, lab services, R&D services, royalties, research agreements with milestone payments, companion diagnostics, and six recurring-payment service lines — every line with its own volume-times-price driver.
Highlights:
- 20+ distinct revenue lines, each independently driven and editable
- Biopharma drug revenue built from real patient and pricing data
- Milestone and licensing revenue recognized automatically at launch dates
- Dedicated recurring-revenue section for subscription and contract-based income
09. COGS Gross Profit
Clean, defensible gross margin modeling — manufacturing cost, program-specific royalties owed, and distribution costs are all calculated automatically from the Revenue Build tab, giving you an accurate, always-current gross margin percentage for every period of the forecast.
Highlights:
- Manufacturing COGS split between drug and service revenue
- Program-level royalty costs pulled directly from Pipeline royalty rates
- Automatic gross profit and gross margin % calculation
- Fully linked — no manual COGS entry required anywhere
10. Operating Expenses
A realistic SG&A and commercial expense build that links commercial and G&A payroll straight from the Headcount tab, layers on sales & marketing spend and corporate overhead, and rolls everything into a scenario-adjusted total operating expense figure for the P&L.
Highlights:
- Commercial and G&A payroll linked live from the Headcount tab
- Sales & marketing spend scales with drug revenue automatically
- Inflation-escalated corporate overhead assumption built in
- Scenario-adjusted totals ready for bull/base/bear sensitivity
11. Headcount
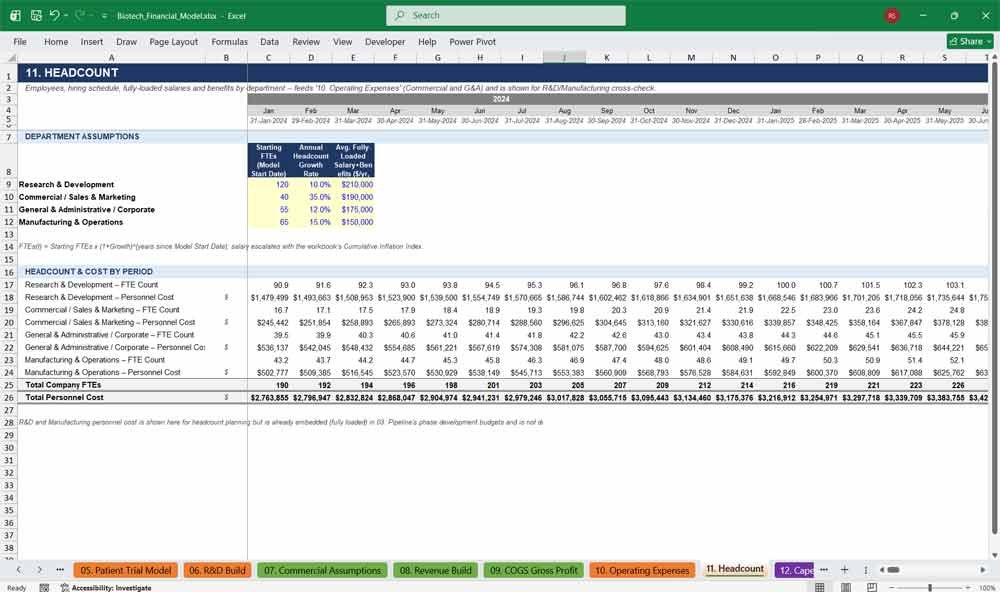
A department-by-department hiring and compensation model — R&D, Commercial, G&A, and Manufacturing — with FTE growth curves and inflation-escalated, fully-loaded salaries, giving you a defensible personnel cost forecast that feeds directly into operating expenses.
Highlights:
- Four departments modeled with independent hiring growth rates
- Fully-loaded salary and benefits assumptions, inflation-adjusted
- Automatic total company FTE and personnel cost rollup
- Cross-referenced against R&D and COGS to avoid double-counting
12. Capex D&A
A clean fixed-asset roll-forward that ties capital expenditure to revenue growth, then depreciates the resulting PP&E balance on a straight-line basis — with D&A always calculated on the prior period’s balance to avoid circular formula errors.
Highlights:
- Capex modeled as a % of revenue, fully dynamic
- Gross PP&E, accumulated depreciation, and net PP&E roll-forward
- Circularity-free depreciation calculation, safe for Excel and Google Sheets
- Feeds D&A directly into the P&L, cash flow, and balance sheet
13. Income Statement (P&L)
A complete, audit-ready income statement — revenue through net income — including gross margin %, COGS, R&D, commercial and G&A expense, EBITDA, D&A, interest, and tax, with every single line item linked live from its source tab.
Highlights:
- Full income statement from revenue to net income
- Gross margin %, EBITDA, and EBIT clearly broken out
- Tax expense modeled realistically with no benefit on pre-profit losses
- 100% formula-linked — nothing hardcoded, nothing to reconcile manually
14. Cash Flow
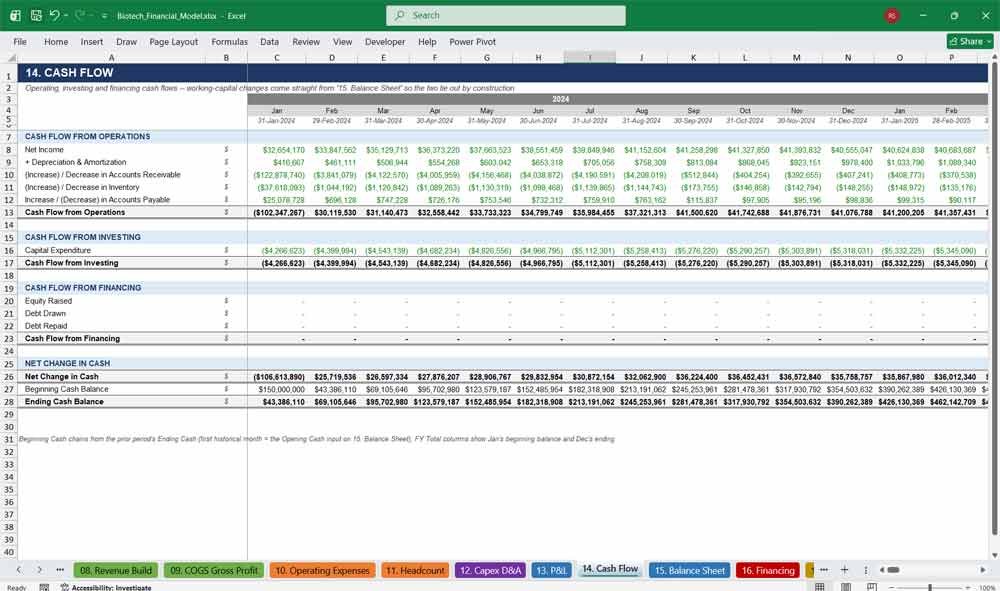
A true three-statement cash flow build — operating, investing, and financing activities — where working capital changes are pulled directly from the balance sheet, guaranteeing your cash flow statement and balance sheet always tie out perfectly.
Highlights:
- Operating, investing, and financing cash flow fully separated
- Working capital changes sourced directly from the balance sheet
- Beginning/ending cash roll-forward across all 15 years
- Built to tie out exactly — verified with zero discrepancy
15. Balance Sheet
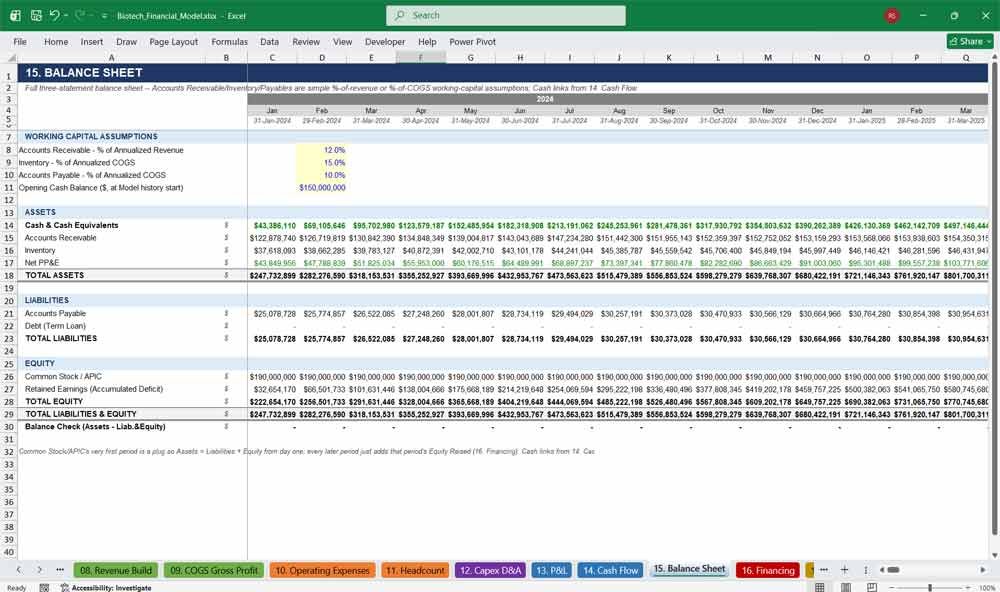
A genuine three-statement balance sheet — cash, receivables, inventory, PP&E, payables, debt, and equity — engineered so assets always equal liabilities plus equity, period after period, without plugs, without circularity errors, and without manual balancing.
Highlights:
- Full balance sheet: assets, liabilities, and equity
- Mathematically guaranteed to balance in every single period
- Common stock and retained earnings roll forward automatically
- Working capital assumptions fully editable and clearly labeled
16. Financing
A realistic financing schedule covering equity raises, term debt, interest expense, and cash runway — built on a pre-set, non-circular schedule so the model never requires Excel’s iterative calculation setting, a common failure point in DIY biotech models.
Highlights:
- Pre-built equity raise schedule (Series C, D, IPO, follow-on)
- Term loan with draw date, interest rate, and repayment schedule
- Interest expense calculated on prior-period balance — never circular
- No iterative calculation setting required, ever
Key Financial Metrics for a Biotech Company
17. Valuation
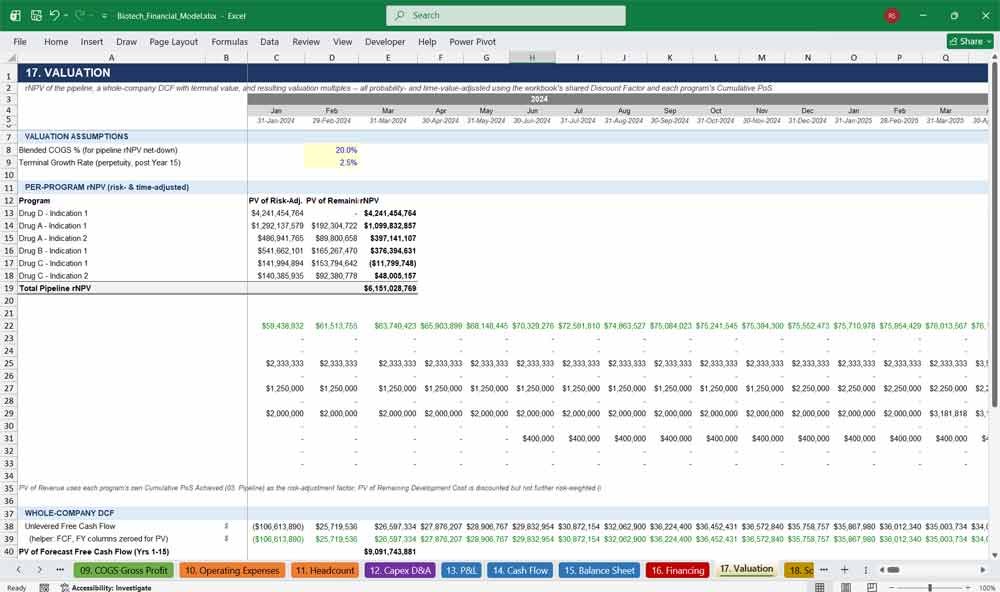
Institutional-grade biotech valuation in one tab — risk-adjusted NPV (rNPV) by program using each drug’s real probability of success, plus a full company-wide DCF with terminal value, giving you both a pipeline valuation and an enterprise/equity valuation.
Highlights:
- Per-program rNPV using live, phase-based probability of success
- Full 15-year DCF with Gordon Growth terminal value
- Automatic Enterprise Value and Equity Value calculation
- EV/Revenue and EV/EBITDA multiples at multiple forecast years
18. Scenario Analysis
A true bull/base/bear comparison — revenue, cost, and pipeline probability of success shown side by side for all three scenarios simultaneously, so you can present a full range of outcomes without rebuilding the model or relying on fragile data tables.
Highlights:
- Base, Bull, and Bear cases shown side by side instantly
- Revenue, cost, and rNPV sensitivity in one comparison table
- No Excel Data Tables required — fully formula-driven
- Perfect for investor decks that need a range of outcomes
19. Returns Cap Table
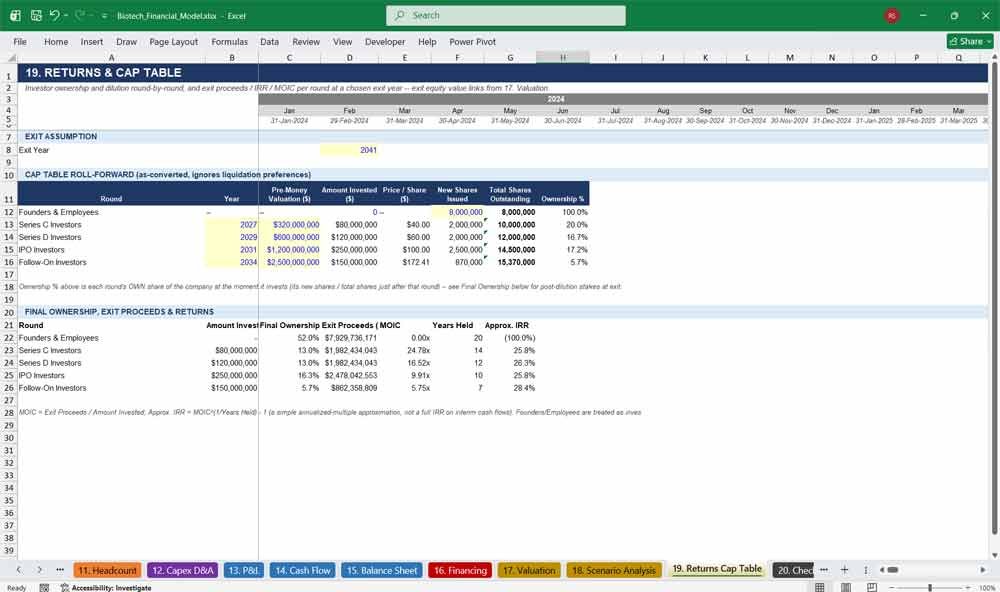
A full investor cap table — founders, Series C, Series D, IPO, and follow-on rounds — with automatic price-per-share, dilution, and ownership calculations, plus exit proceeds, MOIC, and IRR for every investor class at your chosen exit year.
Highlights:
- Full round-by-round dilution and ownership waterfall
- Automatic price-per-share and new-share issuance calculations
- Exit proceeds, MOIC, and IRR by investor class
- Exit year and equity value fully adjustable and live-linked
20. Checks
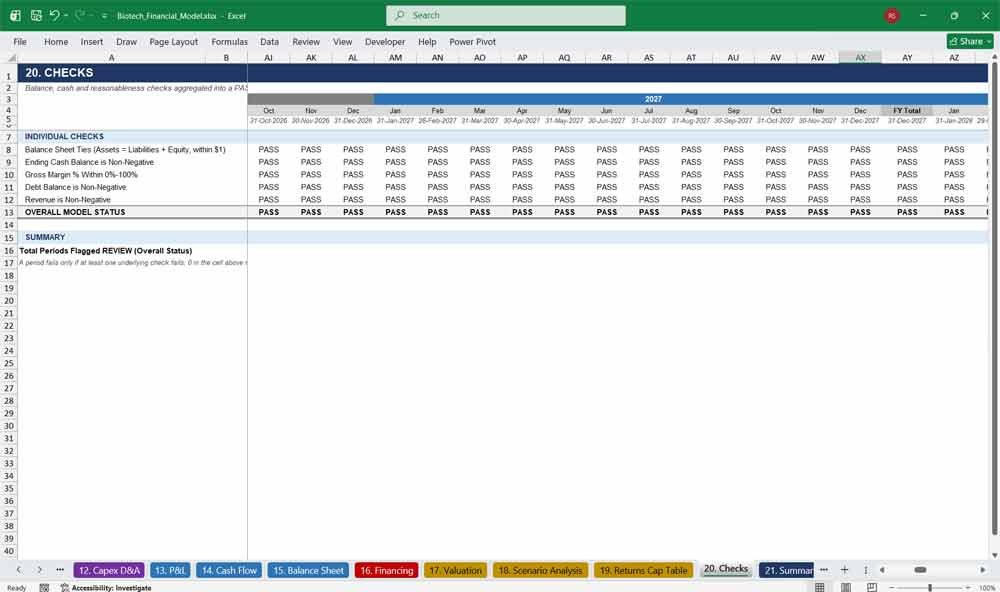
A dedicated error-checking tab that continuously verifies the model’s integrity — balance sheet ties, non-negative cash, gross margin sanity, and debt balances — rolling every check into a single PASS/REVIEW flag for total confidence in your numbers.
Highlights:
- Five independent checks run automatically across all 111 periods
- Single “Overall Model Status” flag: PASS or REVIEW
- Instantly surfaces any period that needs a second look
- Gives investors and auditors immediate confidence in the model
21. Summary Dashboard
The one-page executive view every stakeholder actually wants — total pipeline rNPV, enterprise and equity value, revenue, EBITDA, net income, cash runway, and headcount, all live-linked so your dashboard never goes stale as assumptions change.
Highlights:
- One-page snapshot of valuation, revenue, and profitability
- Live cash runway calculation in months
- Active pipeline program count pulled straight from Pipeline tab
- Every KPI links live — updates the instant you change an assumption
Biotech Frequently Asked Questions (Faq)
Is this model actually built for biotech, or is it a generic SaaS template with different labels?
It’s purpose-built for biotech. The entire model is structured around the real value chain of a pharmaceutical company — pipeline programs, clinical trial phases, probability of technical and regulatory success, launch, and patent expiry — not a subscription-revenue template with renamed line items.
Do I need to be an Excel expert to use this?
No. Every input cell is color-coded (blue for inputs, black for formulas, green for links), and every tab includes notes explaining the methodology. If you can type a number into a highlighted cell, you can drive the entire 15-year forecast.
Can I change the model’s start date without breaking anything?
Yes. A single Model Start Date cell on the Control Assumptions tab drives every date across all 21 tabs. Change it once and the entire model — historical periods, forecast years, milestone dates, everything — re-dates automatically.
How many drug programs/products does the model support?
It ships pre-built with six programs across four drug/indication combinations, including one already-launched product experiencing patent expiry. You can easily add, remove, or relabel programs on the Pipeline tab to match your own portfolio.
Does it calculate a real valuation, or just financial projections?
Both. The Valuation tab includes a risk-adjusted NPV (rNPV) per program using actual probability of success, plus a full company-wide discounted cash flow with terminal value — giving you defensible Enterprise Value and Equity Value figures.
Will this work for a pre-revenue, clinical-stage biotech?
Yes — the model is designed for exactly that situation. R&D expense, headcount, and financing are all driven by the pipeline and development timeline, so you get a credible cash burn and runway forecast even before any product generates revenue.
Does the balance sheet actually balance, or will I need to fix it manually?
It balances by construction, in every single period, with zero manual plugs. This was explicitly engineered and stress-tested — including after changing the model’s start date — so assets always equal liabilities plus equity.
Is there a cap table and dilution calculator included?
Yes. The Returns & Cap Table tab models every funding round (Series C, Series D, IPO, follow-on), calculates dilution and ownership automatically, and outputs exit proceeds, MOIC, and IRR by investor class at whatever exit year you choose.
Can I run bull/base/bear scenarios without rebuilding the model?
Yes. A single scenario switch on the Control Assumptions tab instantly re-drives revenue, cost, and pipeline probability assumptions across the whole model, and the Scenario Analysis tab shows all three cases side by side for easy comparison.
Does this require Excel’s iterative/circular calculation setting?
No. The financing and interest calculations are deliberately structured to avoid circularity (interest is charged on the prior period’s balance), so the model opens and recalculates cleanly with standard Excel settings — no special configuration needed.
Will this work in Google Sheets, or only Microsoft Excel?
The model uses standard, widely-supported formulas (SUMIFS, INDEX/MATCH, IFERROR, SUMPRODUCT) rather than newer Excel-only functions, so it is built to import and function well in Google Sheets in addition to Excel.
Is the data in the model real, or do I need to replace it?
All figures are clearly labeled, realistic placeholder assumptions meant to demonstrate the model’s mechanics. Every input is a colored, editable cell — simply replace the placeholder numbers with your own company’s data and the entire model recalculates instantly.
Further Reading
Biochemical Fermentation Model: Financial model for a bioprocess manufacturing facility. You can easily customize this comprehensive Biochemical Fermentation Financial Model to forecast capital expenditures, downstream purification costs, and venture capital runway.
- Synthetic Biology Template: A tailored valuation framework for your deep-tech startup. You can easily customize this comprehensive Synthetic Biology Financial Model to forecast R&D milestones, bioreactor scaling costs, and venture capital cash runways.
Final Notes on the Financial Model
This 15-Year Biotech Company Financial Model must focus on balancing capital expenditures with steady revenue growth from diversified bio managed services. And so by optimizing operational costs, and power efficiency, and maximizing high-margin services like drug sales and diagnostics, the model ensures sustainable profitability and cash flow stability.