
Biochemical Fermentation Plant Financial Model Excel Template
This Biochemical Fermentation Plant Financial Model is a professional, fully integrated Excel template for evaluating a greenfield industrial biotechnology or precision fermentation facility. Built for project developers, investors, lenders and consultants, it takes you from early feasibility and FEED through construction, commissioning, ramp-up and 15 years of operations. Every number is driven by formulas, giving you a bankable fermentation plant business plan, a three-statement financial model and investor-ready returns analysis in one workbook.
Financial Model for a Biochemical Fermentation Plant
At the heart of the model is an explicit physical production build: fermenter working volume × number of fermenters × batches per year × utilisation and uptime × fermentation yield × downstream recovery = saleable product. Batch cycle times, cleaning and sterilisation, downtime, titre, off-spec rework and the downstream processing bottleneck are all modelled. Saleable output then flows into a multi-product revenue build, raw material and utility consumption, and detailed operating costs, so you can see exactly how your process economics drive revenue, EBITDA and cash flow.
The financial engine delivers a monthly-to-annual timeline, a capex schedule with contingency and expansion, depreciation, working capital, senior debt with DSRA and cash sweep, a revolving credit facility, shareholder loans, grants, tax losses and investment tax credits. It produces a fully balanced P&L, cash flow statement and balance sheet. Outputs include project IRR, equity IRR, NPV, MOIC, payback and DSCR, plus scenario analysis, sensitivity analysis and 26 automated integrity checks.
Tab-by-Tab Overview
01. Cover Control
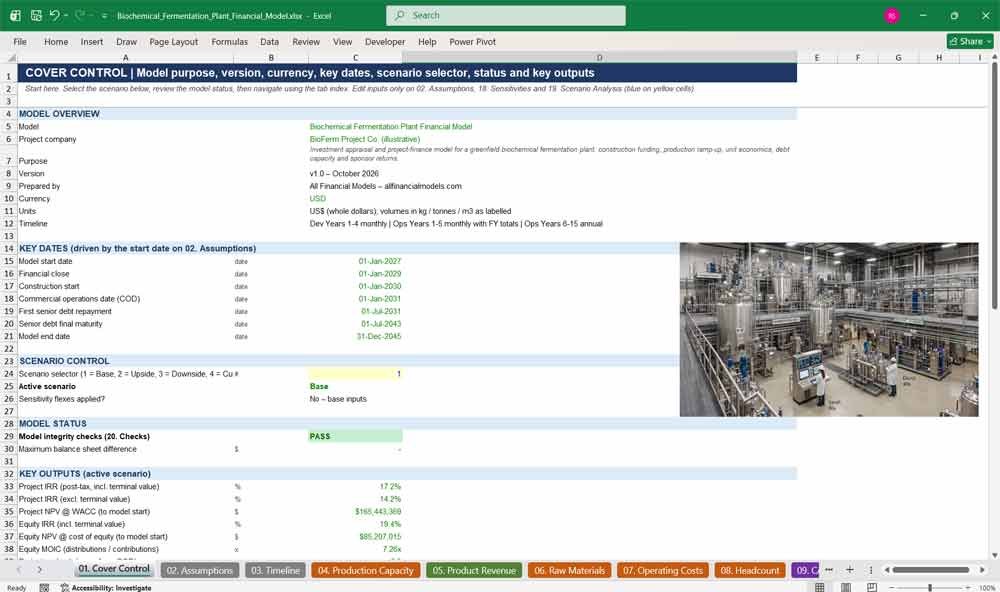
The Cover Control tab is the fermentation model’s dashboard and navigation hub. It shows model purpose, version, currency and key project dates, a one-click scenario selector, live model-integrity status and headline investment returns, with hyperlinked tab index for fast, professional review.
- One-cell scenario selector: Base, Upside, Downside, Custom
- Key dates: financial close, construction start, COD, debt maturity
- Live PASS / REVIEW model status
- Headline IRR, NPV, MOIC, DSCR and payback
- Clickable tab index and colour legend
02. Assumptions
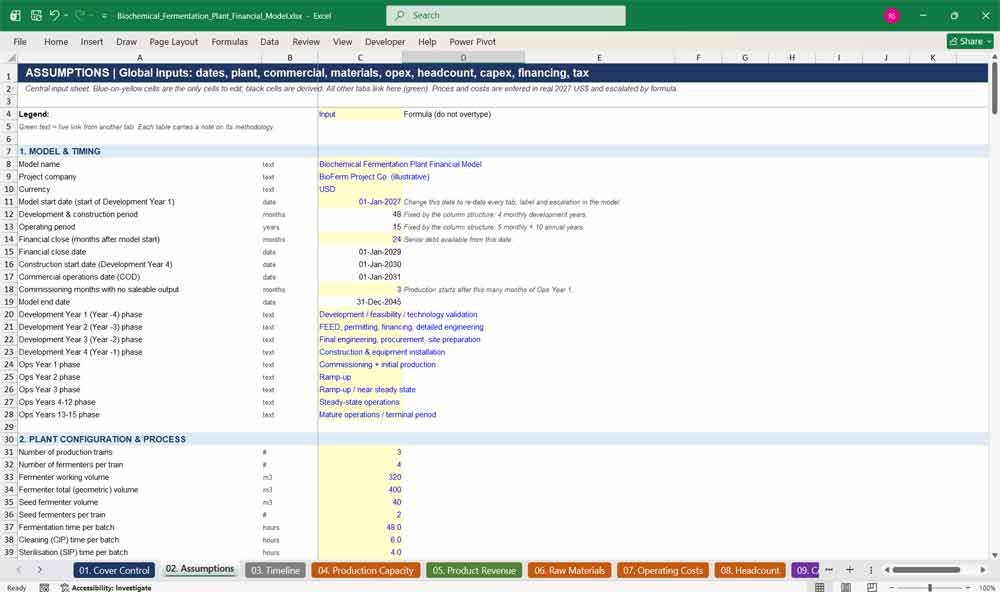
The Assumptions tab centralises every input for the fermentation plant model: timing, plant configuration, utilisation ramp-up, products, pricing, raw materials, operating costs, headcount, capex, depreciation, working capital, financing, tax and valuation. Blue-on-yellow input cells make customising your business plan fast and safe.
- Single model start date re-dates the entire workbook
- Product register with grades, applications, markets and mix
- 25 raw materials and utilities with consumption rates and prices
- Itemised capex with spend profiles and asset classes
- Financing, tax, valuation and expansion switches
Biochemical Fermentation Revenues & Costs
03. Timeline
The Timeline tab is the master calendar driving the whole financial model. It generates monthly and annual periods, quarters, development, construction, commissioning, ramp-up, steady-state and mature-operations phases, plus escalation indices and debt funding flags, all formula-linked to one start date.
- Four monthly development years with FY totals
- Ops Years 1–5 monthly, Years 6–15 annual
- Phase labels from feasibility to terminal period
- Financial close, availability, repayment and equity window flags
- Changing the start date updates every date automatically
04. Production Capacity
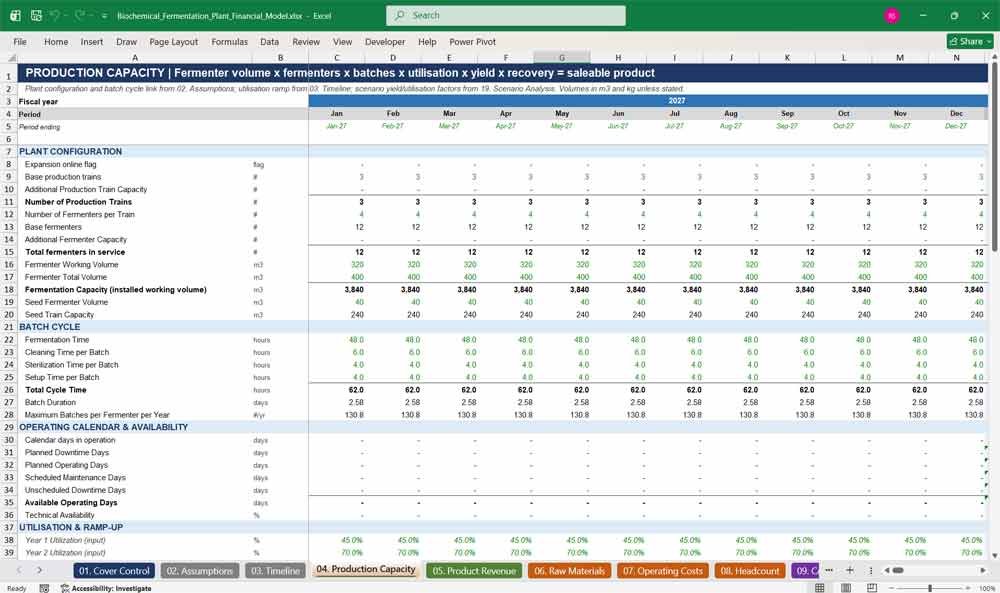
The Production Capacity tab builds saleable output explicitly from fermenter volume, number of fermenters, batches per year, utilisation, uptime, fermentation yield and downstream recovery. It models batch cycles, downtime, failure rates, titre, DSP bottlenecks, off-spec rework, waste and wastewater volumes.
- Trains, fermenters, working and total volume, seed train
- Batch cycle: fermentation, cleaning, sterilisation, setup time
- Technical availability and utilisation ramp-up profile
- Downstream processing bottleneck and capacity constraint flag
- Capacity expansion with additional fermenters and trains
05. Product Revenue
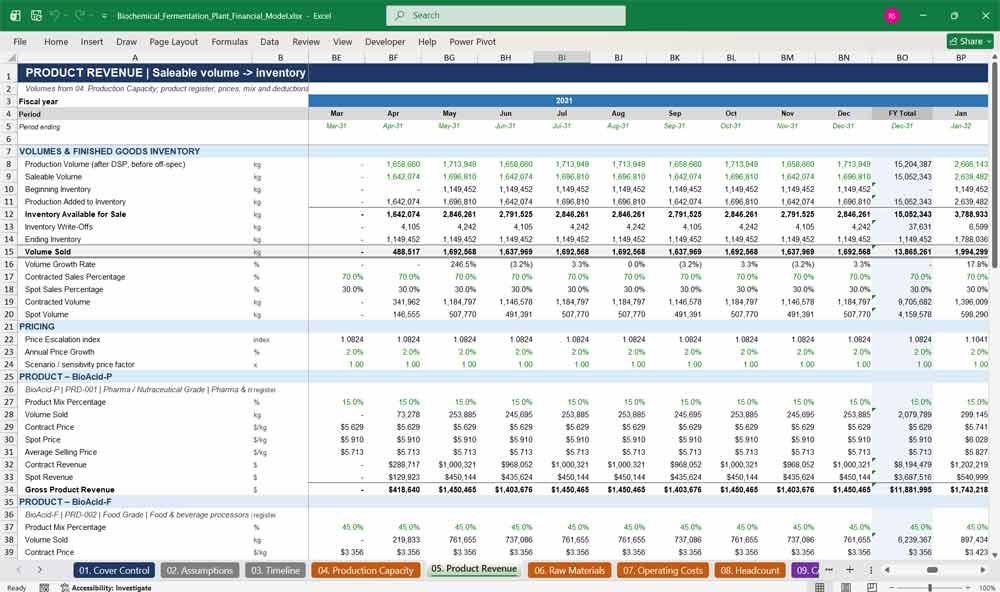
The Product Revenue tab converts saleable production into revenue across three product grades. It tracks finished goods inventory, contracted and spot volumes, escalating contract and spot prices, discounts, rebates, returns, by-product sales and revenue KPIs per kilogram, litre, tonne and batch.
- Inventory roll-forward: production, write-offs, ending stock, volume sold
- Product mix, contract versus spot pricing and price escalation
- Gross-to-net revenue: discounts, rebates, volume discounts, returns
- Domestic and export revenue split
- By-product revenue and revenue per batch and per m³ capacity
06. Raw Materials
The Raw Materials tab calculates feedstock, nutrient, chemical, downstream processing, packaging and utility consumption per kilogram and per batch. Blended contract and spot prices, escalation, yield loss, freight, import duty, handling and storage deliver a complete landed raw material cost.
- Carbon, nitrogen, minerals, trace elements and growth media
- Acids, caustic, buffers, antifoam, enzymes, solvents, filter media
- Electricity, steam, cooling, chilled water, compressed air and gases
- Landed cost per unit and consumption per tonne
- Raw material inventory, purchases and closing stock
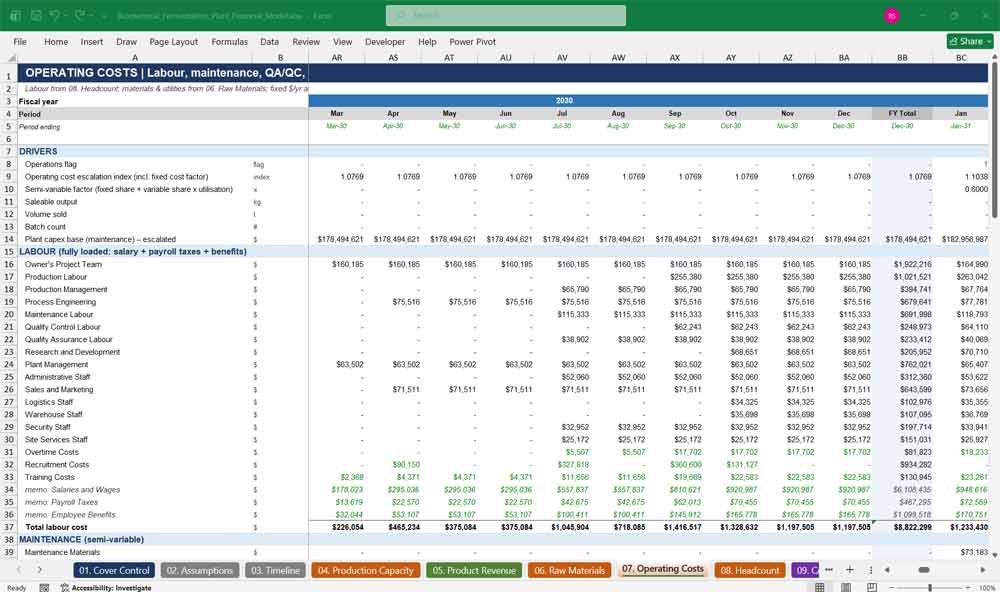
07. Operating Costs
The Operating Costs tab captures every operating expense of a fermentation facility: fully loaded labour, maintenance, QA/QC and laboratory, waste and wastewater treatment, insurance, property taxes, IT, professional fees, site services, logistics, marketing and G&A, classified as fixed, semi-variable or variable.
- Department-level labour linked to headcount
- Semi-variable maintenance linked to utilisation
- Environmental, insurance and corporate overheads
- Outbound freight, storage, distribution and selling costs
- Cost per kg, per tonne, per batch and per m³ capacity
08. Headcount
The Headcount tab plans staffing for fifteen departments, from production operators and process engineers to QA, R&D and sales. Hiring dates are set relative to COD, salaries escalate annually, and payroll taxes, benefits, overtime, recruitment and training costs are calculated automatically.
- Pre-COD owner’s project team and pre-operational hiring
- FTE by department and total headcount
- Salary escalation, payroll taxes and employee benefits
- Recruitment and training costs
- Hiring ramp versus steady-state staffing
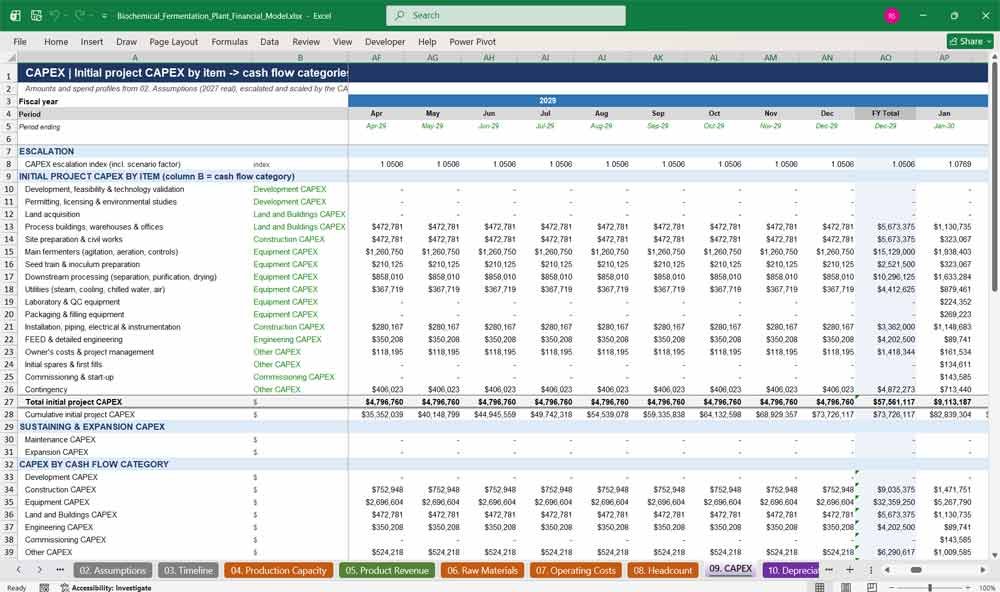
09. CAPEX
The CAPEX tab schedules initial project capital expenditure by item, including development, permitting, land, buildings, civil works, fermenters, seed train, downstream processing, utilities, installation, engineering, commissioning and contingency, mapped to cash flow categories and depreciable asset classes.
- Itemised capex with annual spend profiles
- Capex escalation and contingency on hard costs
- Maintenance (sustaining) capex
- Expansion capex for added fermenters and DSP
- Automatic re-mapping when categories change
10. Depreciation
The Depreciation tab moves capital costs through construction in progress, places assets in service at COD and calculates straight-line depreciation and amortisation for ten asset classes, including fermentation equipment, downstream processing, utilities, buildings and capitalised development costs.
- Construction in progress until commercial operations
- Ten asset classes with individual useful lives
- Depreciation capped at gross cost
- Amortisation of capitalised development costs
- Net book value and equipment base for tax credits
Biochemical Fermentation Financial Statements
11. Working Capital
The Working Capital tab models accounts receivable, raw material, work-in-progress and finished goods inventory, prepaid expenses, accounts payable, accrued expenses and accrued payroll using day-count assumptions, producing changes in net working capital and cash conversion cycle metrics.
- Receivable, inventory and payable days
- Finished goods valued at variable production cost
- Consistent monthly and annual calculations
- Change in working capital for the cash flow
- DSO, DIO, DPO and cash conversion cycle
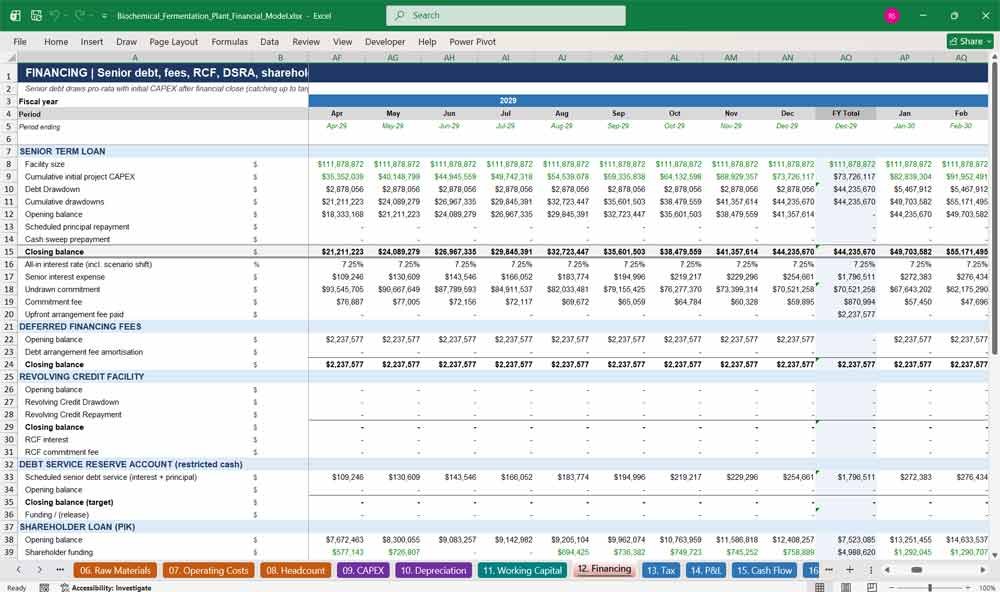
12. Financing
The Financing tab models the full project finance structure: senior term loan drawdowns, interest, commitment and arrangement fees, sculpted repayment, cash sweep, DSRA, revolving credit facility, PIK shareholder loan, equity share capital, grant funding and debt service coverage ratios.
- Debt drawn pro-rata with capex after financial close
- Grace period, tenor and scheduled repayment
- Debt service reserve account and lock-up DSCR
- RCF, shareholder loan and share premium
- Deferred grant released to income
13. Tax
The Tax tab calculates taxable income, tax depreciation allowances, loss carry-forwards with utilisation caps, investment tax credits, current tax, cash taxes with a payment lag, and deferred tax on asset timing differences, giving a realistic effective tax rate.
- Reducing-balance tax depreciation pool
- Tax losses generated, utilised and carried forward
- Investment tax credits on equipment placed in service
- Taxes payable and cash tax paid
- Deferred tax liability and effective tax rate
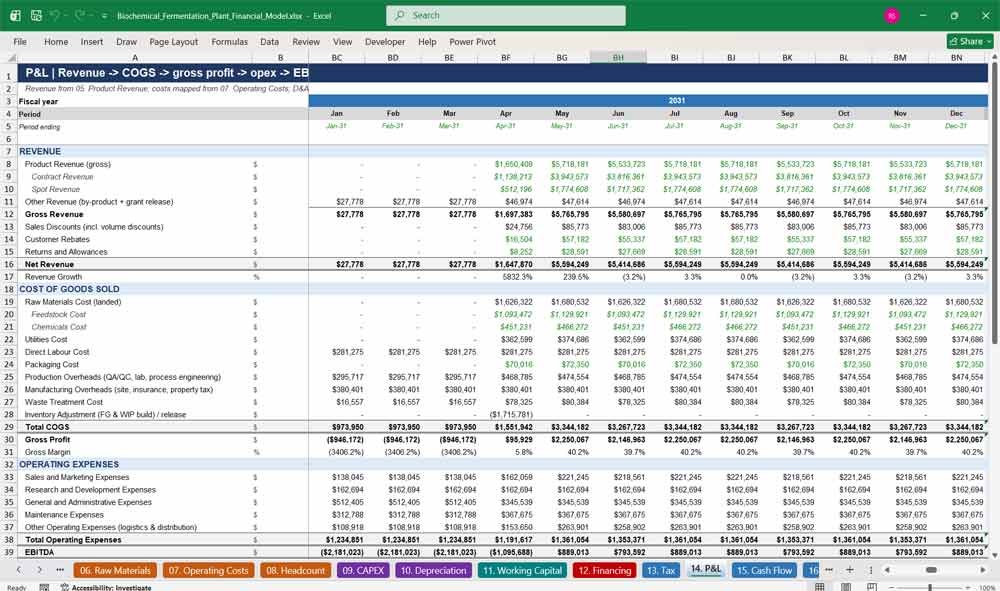
14. P&L
The P&L tab presents a complete income statement from gross product revenue through discounts, net revenue, cost of goods sold, gross profit, operating expenses, EBITDA, depreciation, EBIT, finance costs, tax and net income, with margins, growth and earnings per share.
- Contract, spot and other revenue
- COGS by raw materials, utilities, labour, overheads, waste
- Inventory adjustment for finished goods and WIP
- EBITDA, EBIT and net income margins
- Tie-out check to operating cost schedule
15. Cash Flow
The Cash Flow tab builds operating, investing and financing cash flows from EBITDA, including working capital, cash taxes and interest, capex by category, and a funding waterfall covering equity, debt, RCF, DSRA, cash sweep, shareholder loan repayments and dividends.
- Indirect cash flow from EBITDA
- Capex by development, construction, equipment and expansion
- Automated funding waterfall and minimum cash
- CFADS, free cash flow to firm and equity
- Cumulative project and equity cash flows
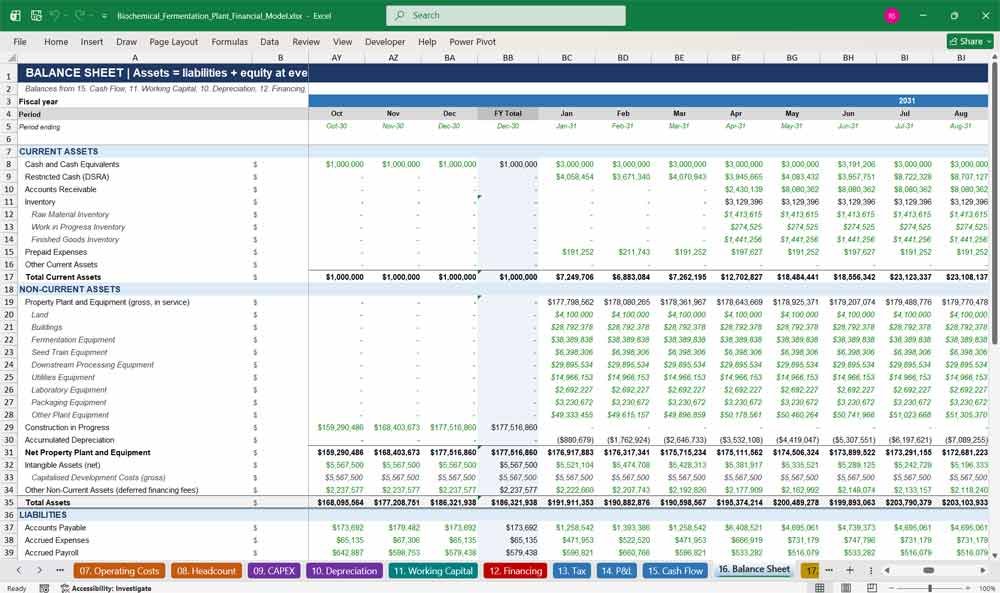
16. Balance Sheet
The Balance Sheet tab delivers a fully integrated balance sheet with cash, restricted DSRA cash, receivables, inventories, PP&E by asset class, intangibles, payables, debt, shareholder loans, deferred tax, deferred grant and equity, balancing in every period with a visible check.
- Inventory split: raw materials, WIP, finished goods
- PP&E, construction in progress and accumulated depreciation
- Current and long-term debt split
- Retained earnings and current year profit
- Net debt, net working capital and invested capital
Key Biochemical Fermentation Plant Key KPIs
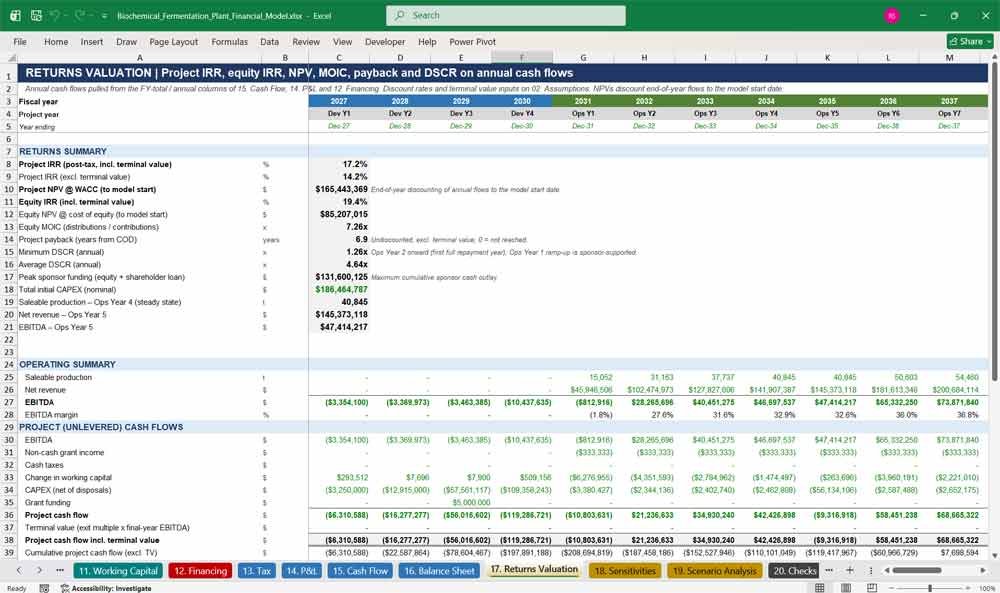
17. Returns Valuation
The Returns Valuation tab summarises annual project and equity cash flows to calculate project IRR, equity IRR, NPV at WACC and cost of equity, MOIC, payback period and DSCR, including an optional exit-multiple terminal value for investor and lender analysis.
- Project IRR with and without terminal value
- Equity IRR, NPV and MOIC
- Payback measured from COD
- Minimum and average annual DSCR
- Peak sponsor funding requirement
18. Sensitivities
The Sensitivities tab lets you flex product price, fermentation yield, plant utilisation, capex, variable costs, fixed costs and interest rates live across the entire model, alongside a stored tornado table and chart showing the impact on IRR, NPV and DSCR.
- Seven live sensitivity flex inputs
- Live returns output panel
- Low and high case tornado table
- NPV impact tornado chart
- Flexes stack on top of the active scenario
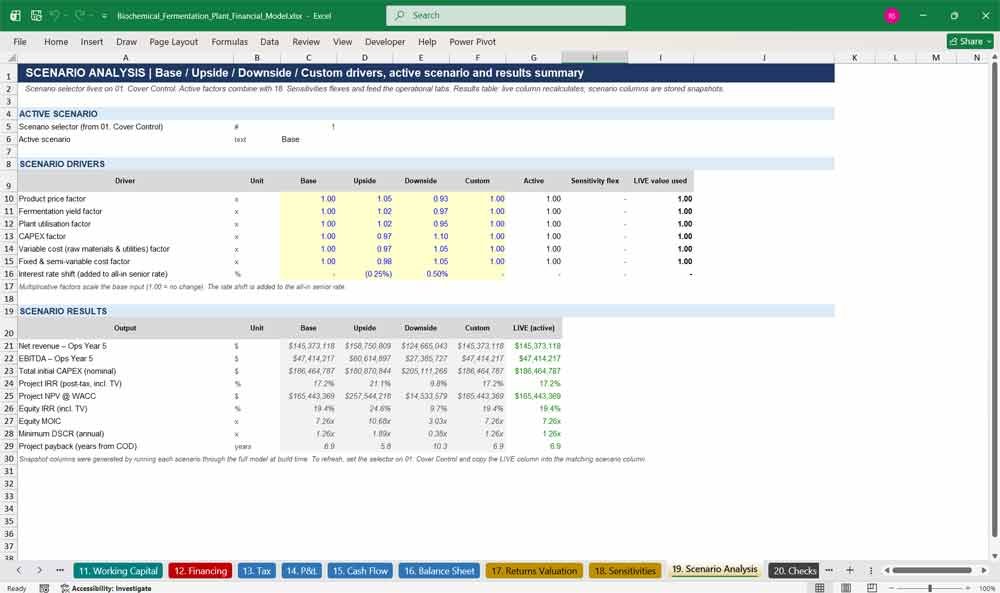
19. Scenario Analysis
The Scenario Analysis tab defines Base, Upside, Downside and Custom cases for price, yield, utilisation, capex, variable cost, fixed cost and interest rates. The active scenario drives the whole model, with a results table comparing revenue, EBITDA, IRR, NPV and DSCR.
- Four editable scenarios
- Active scenario selected from the cover
- Combined scenario and sensitivity factors
- Side-by-side scenario results
- Live column for the active case
20. Checks
The Checks tab runs 26 automated model-integrity checks in every period, covering balance sheet balancing, cash, debt repayment, facility limits, production logic, revenue and cost tie-outs, capex mapping, depreciation, tax and timeline continuity, with an overall PASS or REVIEW status.
- Balance sheet and cash flow reconciliation
- Debt, RCF, DSRA and shareholder loan checks
- Production, capacity and utilisation checks
- Revenue, cost, labour and capex tie-outs
- Overall status linked to the cover
Why Buy This Model
Building a credible fermentation plant financial model from scratch takes weeks of specialist work and a deep understanding of both bioprocess engineering and project finance. This Excel template gives you both on day one. Its explicit fermenter-to-saleable-product calculation means your revenue is grounded in real process parameters, not top-down guesses, so you can test titre, yield, batch cycle and utilisation and see the impact on returns immediately. The integrated three statements, project finance structure, 26 automated checks and lender-standard formatting make it ready for investors, banks, grant applications and board presentations. With every assumption in one tab and a single start date driving the full timeline, you can adapt it to your own product, plant size and location quickly, saving time, reducing modelling risk and helping you raise capital with confidence.
Biochemical Fermentation Frequently Asked Questions (Faq)
What type of fermentation plant can I model with this template? It suits most batch fermentation businesses, including bio-based chemicals, organic acids, food ingredients, enzymes, nutraceuticals and precision fermentation products. You enter your own fermenter sizes, batch cycle, titre, yields, products and prices, so the model adapts to your specific process.
Do I need advanced Excel or finance skills to use it?
No. All inputs sit on the Assumptions tab in clearly colour-coded cells, and every other tab calculates automatically. A basic understanding of Excel is enough to update assumptions, while finance professionals will appreciate the full project finance logic underneath.
How is production calculated?
Saleable product is built step by step: fermenter working volume × number of fermenters × batches per year × utilisation and uptime × fermentation yield × downstream recovery, then adjusted for the downstream processing bottleneck and off-spec rework. Each step is shown on its own row.
Can I change the project start date?
Yes. Change one start date on the Assumptions tab and every period, year label, phase, escalation index and funding date across all 20 tabs updates automatically.
What time periods does the model cover?
Four development and construction years monthly, operating years 1–5 monthly with annual totals, and operating years 6–15 annually, giving a 19-year horizon from feasibility to mature operations.
Can I model more than one product?
Yes. The model includes three product grades with individual mix, contract pricing, spot pricing and market data, plus a by-product revenue stream.
Does it include debt financing?
Yes. It includes a senior term loan with drawdowns, interest, fees, grace period, scheduled repayment, cash sweep and DSRA, plus a revolving credit facility, shareholder loans, equity and grant funding, with DSCR and distribution lock-up tests.
Does the balance sheet balance?
Yes. The balance sheet balances in every period, and a dedicated Checks tab runs 26 integrity checks with an overall PASS or REVIEW status shown on the cover.
Can I run scenarios and sensitivities?
Yes. Choose Base, Upside, Downside or Custom from the cover, and flex price, yield, utilisation, capex, variable costs, fixed costs and interest rates on the Sensitivities tab. Results update live across the whole model.
What outputs will investors and lenders see?
Project IRR, equity IRR, NPV, MOIC, payback period, minimum and average DSCR, peak funding requirement, full three-statement financials and unit economics such as cost and revenue per kilogram, tonne and batch.
Can I add a capacity expansion?
Yes. An expansion switch adds fermenters, production trains and downstream capacity from a chosen operating year, with its own capex, utilisation ramp and depreciation.
Are the assumptions in the model real data?
The model is pre-filled with realistic illustrative assumptions so you can see how it works. You should replace them with your own technical, commercial and cost data before making investment decisions.
Which currency does the model use?
The model is built in US dollars. Because all values are inputs, you can enter figures in any currency and relabel the currency on the Assumptions tab.
Which software do I need?
The model is built for Microsoft Excel and uses standard Excel functions with no macros, so it opens without security prompts.
Final Notes on the Financial Model
Further Reading
Biotech Model: A robust financial model for your life sciences venture. You can easily customize this comprehensive Biotech Company Financial Model to forecast R&D expenses, clinical trial burn rates, and venture capital runway.
- Synthetic Biology Template: A tailored valuation framework for your deep-tech startup. You can easily customize this comprehensive Synthetic Biology Financial Model to forecast R&D milestones, bioreactor scaling costs, and venture capital cash runways.
This 20 Year 80 product line Biochemical Fermentation Plant Financial Model focuses on balancing capital expenditures with steady revenue growth from diversified product lines. By optimizing operational costs, and power efficiency, and maximizing high-margin services, the models ensure sustainable profitability and cash flow stability.
Download Link On Next Page