
Real Estate Asset Management Financial Model
20 Year, up to 20 Properties Real Estate Asset Management Financial Model Template in Excel including detailed Property List / Intake, Individual Property Cash Flows, Debt Schedule, Capital Expenditures (CapEx), Portfolio Cash Flow Rollup, Discounted Cash Flow (DCF) with Terminal Value, Sensitivity Analysis, IRR, and other major financial statements to forecast the financial health of your real estate asset management.
20-Year Real Estate Asset Management Financial Model
With monthly periodicity (240 periods) for a portfolio of up to 20 properties contains scalable architecture, outlining the structural design, mechanics, and line items for each requested section of the model.
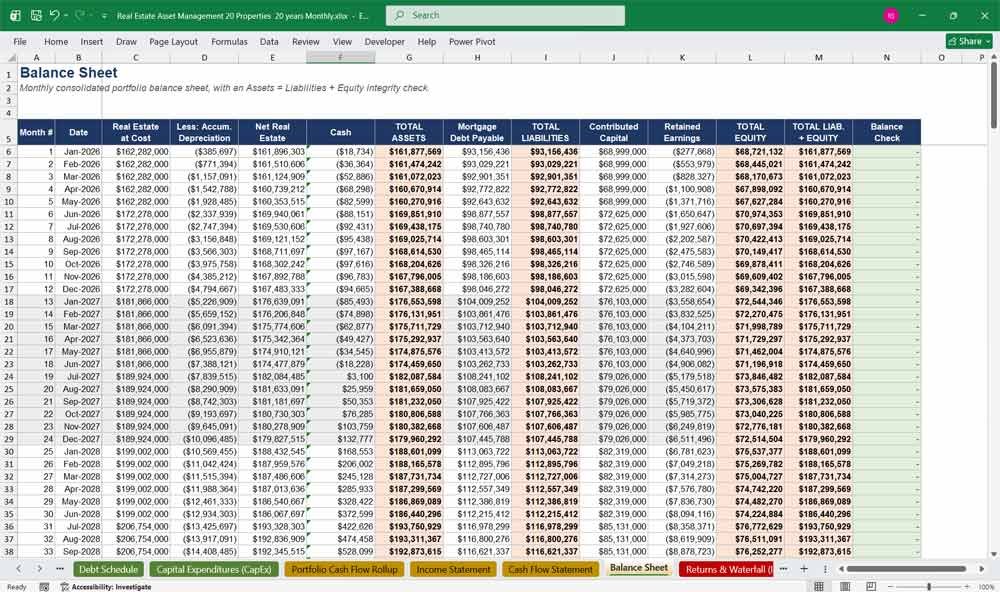
The full model is built and verified with 76,798 formulas, balance sheet ties to $0 across all 240 months.
What’s inside (13 tabs, monthly, 20 years, 20 properties):
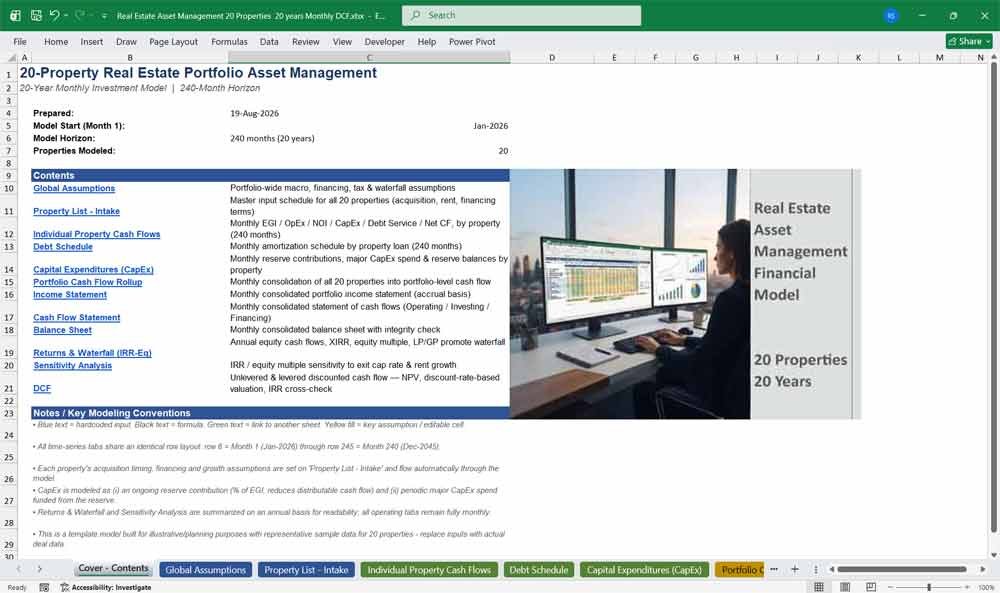
- Cover – Contents — index and modeling conventions
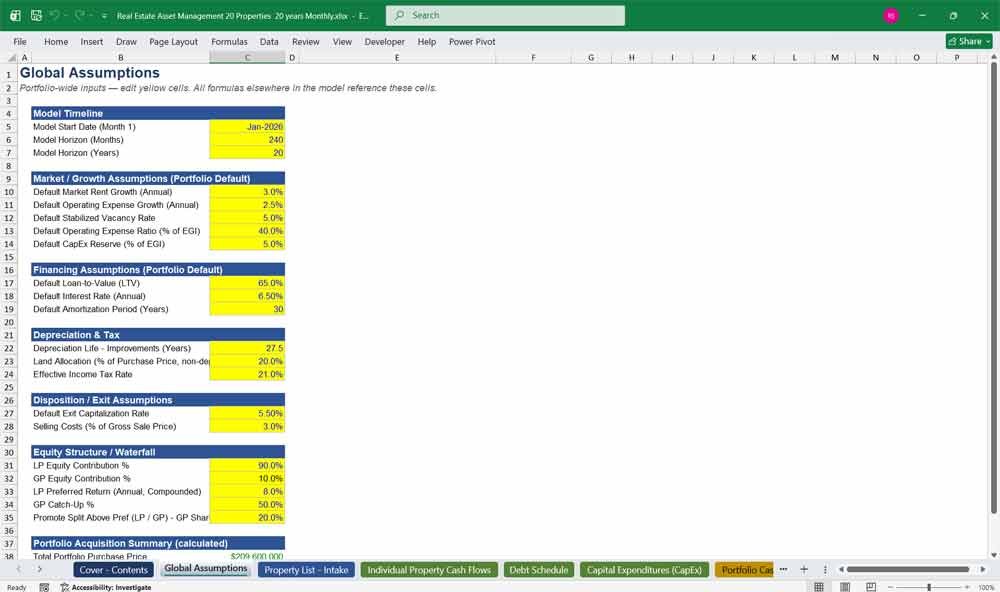
- Global Assumptions — all portfolio-wide levers (growth, financing, tax, exit, LP/GP waterfall terms)
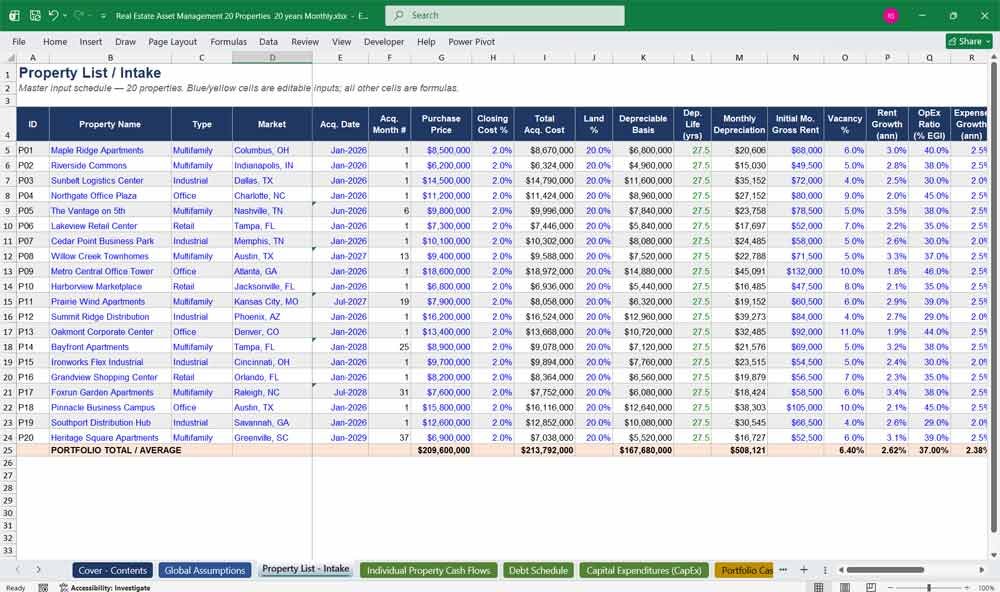
- Property List – Intake — 20 sample properties (multifamily/office/retail/industrial, staggered acquisitions) with full underwriting detail
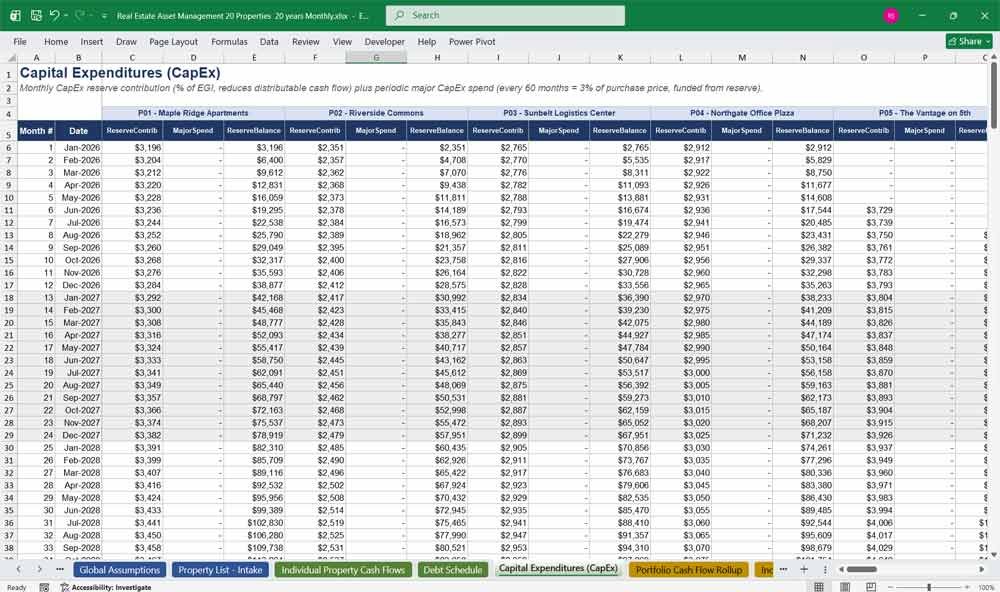
- Individual Property Cash Flows / Debt Schedule / Capital Expenditures (CapEx) — 240 months × 20 properties each, fully formula-driven
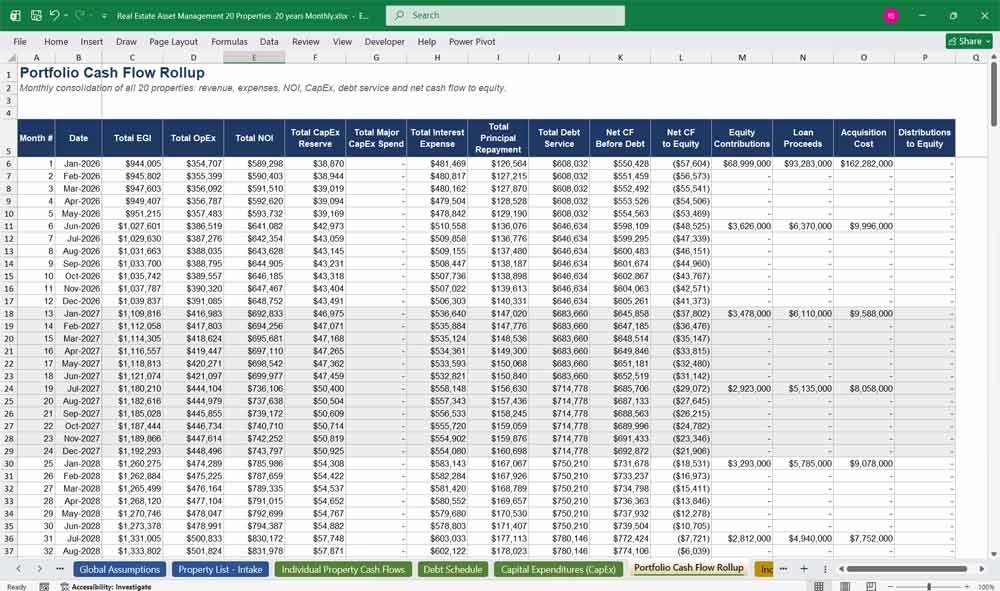
- Portfolio Cash Flow Rollup / Income Statement / Cash Flow Statement / Balance Sheet — monthly consolidation
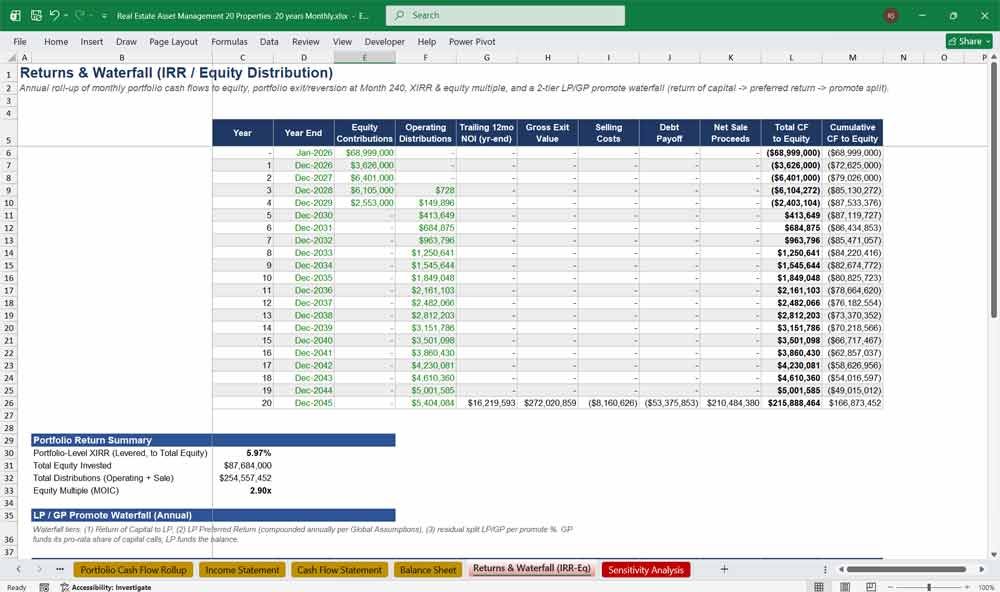
- Returns & Waterfall (IRR-Eq) — annual XIRR, MOIC, and a 2-tier LP/GP promote waterfall
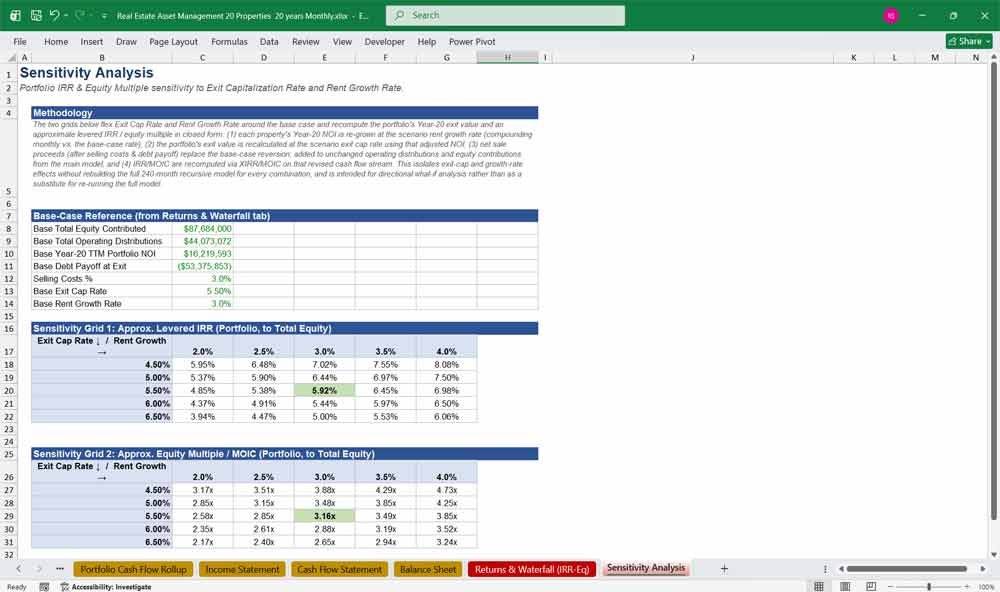
- Sensitivity Analysis — IRR/MOIC grids for exit cap rate × rent growth
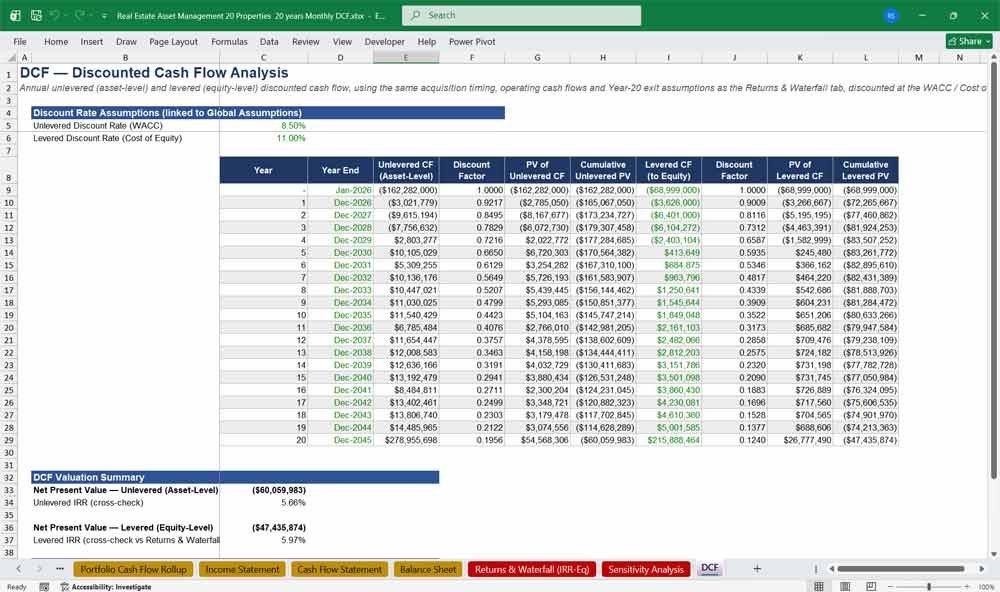
- Discounted Cash Flow (DCF) Annual unlevered (asset-level) and levered (equity-level) discounted cash flow
Cover / Contents
Version Control & Metadata: Captures the model title, version number, author/firm name, date of last update, base case scenario name, and currency (e.g., USD).
Navigation & Index: A structured table of contents mapping out the workbook tabs/sections, color-coding conventions (e.g., blue text for user inputs, black text for hardcoded formulas, green text for cross-sheet links), and a user guide detailing macro settings and scenario toggles.
Global Assumptions
Macroeconomic Drivers: Monthly general inflation rates, consumer price index (CPI) escalations, and baseline market rent growth rates applied across the portfolio. Discount rate assumptions on Global Assumptions: Unlevered Discount Rate / WACC (8.5%) and Levered Discount Rate / Cost of Equity (11.0%), both editable yellow cells.
Financial Market Parameters: Base benchmark interest rates (e.g., SOFR or Treasury curves), debt financing spreads, default discount rates, and hurdle rate benchmarks for the waterfall.
Exit & Disposition Metrics: Terminal capitalization rates (exit cap rates), disposition fee percentages, transaction/legal cost assumptions upon sale, and target holding periods per asset.
Tax & Accounting Settings: Depreciation schedules (e.g., 39-year commercial or 27.5-year residential), cost segregation percentages, capital gains tax rates, and state/local tax rates.
Real Estate Asset Property List / Intake
Asset Metadata (20 Properties): Unique Property ID, Property Name, Asset Class (e.g., Multifamily, Industrial, Office, Retail), Geographic Market/Submarket, and Ownership Percentage (if joint ventures exist).
Physical & Operational Metrics: Rentable Square Footage (RSF) or Unit Count, Initial Occupancy Rate, Stabilization Month/Year, and Acquisition Date.
Financial Baseline: Purchase Price, Initial Land Value vs. Building Value, Upfront Acquisition Costs, and In-Place Net Operating Income (NOI) at acquisition.
Individual Property Cash Flows
Revenue Projections (Months 1 to 240): Gross Potential Rent (GPR) calculated via current rent rolls and lease-by-lease expirations, adjusted for market rent steps. Deductions for general vacancy, credit loss, and tenant concessions.
Other Income: Parking fees, storage income, utility reimbursements (CAM recovery), and miscellaneous revenue streams.
Operating Expenses (OpEx): Fixed expenses (property taxes, insurance) and variable expenses (utilities, management fees, maintenance, marketing) indexed to inflation.
Net Operating Income (NOI): The foundational subtotal (Effective Gross Income minus Total Operating Expenses) calculated individually for each of the 20 assets on a monthly cadence.
Debt Schedule
Loan Structuring: Facility details for property-level mortgages or portfolio-level credit facilities, including Initial Loan Amount, Loan-to-Value (LTV), Debt Service Coverage Ratio (DSCR) constraints, and Interest-Only (IO) periods.
Interest & Amortization Engine: Monthly interest expense calculation based on beginning balance and interest rates (fixed or floating with rate caps/floors). Principal amortization schedules yielding ending loan balances.
Refinancing & Paydown Events: Trigger mechanisms for scheduled refinancing events (e.g., at Year 5, 7, or 10) incorporating transaction fees, new loan sizing, and net cash proceeds/deficits.
Real Estate Asset Management Capital Expenditures (CapEx)
Recurring / Replacement Reserves: Monthly per-square-foot or per-unit reserves set aside for ongoing capital maintenance.
Leasing Costs: Tenant Improvements (TIs) and Leasing Commissions (LCs) dynamically modeled based on lease rollover schedules, renewal probabilities, and market leasing assumptions.
Major Renovations / Value-Add: Discrete, milestone-based capital improvement budgets (e.g., lobby renovations, facade upgrades, unit turns) scheduled across specific months to drive rent growth and asset stabilization.
Portfolio Cash Flow Rollup
Aggregation Engine: Summation of all 20 individual property cash flows, consolidating revenues, operating expenses, CapEx, debt service, and net cash flows into a single master portfolio timeline.
Portfolio-Level Overheads: Corporate overhead, asset management fees, legal, audit, and portfolio-wide marketing expenses that cannot be allocated directly to a single property.
Net Cash Flow Before/After Financing: Total unlevered and levered cash flows generated by the combined portfolio before distributions to partners.
Income Statement
P&L Aggregation (Monthly to Annualized Rollup): Standard accrual-based income statement tracking Total Operating Revenue, Total Operating Expenses, and Net Operating Income (NOI).
Non-Cash and Below-the-Line Items: Subtraction of depreciation and amortization expenses, interest expense, and non-operating income/expenses to arrive at Earnings Before Taxes (EBT) and Net Income.
Real Estate Asset Cash Flow Statement
Operating Activities: Net income adjusted for non-cash items (depreciation, amortization) and changes in working capital accounts (accounts receivable, prepaid expenses, accrued liabilities).
Investing Activities: Cash outflows for initial property acquisitions, major capital expenditures, and cash inflows from property dispositions across the 20-year horizon.
Financing Activities: Proceeds from new debt issuances, regular principal debt repayments, equity contributions from partners, and equity distributions/dividends paid.
Balance Sheet
Assets: Current assets (cash reserves, operating accounts, receivables) and long-term assets (net book value of properties, capitalized leasing commissions, accumulated depreciation).
Liabilities & Equity: Current liabilities (accounts payable, accrued interest) and long-term liabilities (outstanding mortgage debt balances). Total equity comprising contributed capital, retained earnings, and current period net income, balancing perfectly with total assets.
Returns & Waterfall (IRR / Equity Distribution)
Partner Equity Accounting: Tracking capital contributions across General Partners (GP) and Limited Partners (LP) based on their respective ownership tiers (e.g., 90% LP / 10% GP).
Distribution Waterfall Mechanics: Multi-tier distribution logic applied to monthly distributable cash flow and exit proceeds:
Tier 1: Return of capital and preferred return hurdle (e.g., 8% cumulative preferred return).
Tier 2: First promote tier (e.g., 80/20 split between LP and GP after preferred return).
Tier 3: Subsequent promote tiers for outperformance (e.g., 70/30 split above a 15% IRR hurdle).
Return Metrics: Calculation of Net Present Value (NPV), Levered and Unlevered Internal Rate of Return (IRR), Equity Multiple, and Average Cash-on-Cash Yield across the 240-month period.
Sensitivity Analysis
Scenario Variables: Dynamic data tables allowing analysts to stress-test the model against variations in macroeconomic and operational drivers.
Matrix Outputs: Two-way data tables evaluating portfolio IRR and Equity Multiple sensitivity against fluctuations in Exit Capitalization Rates versus Average Annual Rental Growth, or Interest Rate Spreads versus Average Portfolio Occupancy Rates.
Why Buy This Model
This isn’t a template with a few pretty tabs bolted on top of static numbers — it’s a fully-linked, audit-ready financial engine built for real institutional or serious individual investors managing a multi-property portfolio. Every one of the 240 monthly periods across all 20 properties flows through actual formulas — acquisitions, rent growth, vacancy, operating expenses, CapEx reserves, loan amortization, depreciation, and debt service all cascade automatically into a consolidated Income Statement, Cash Flow Statement, and Balance Sheet that ties out to the penny across the full 20-year hold (verified: zero balance-sheet imbalance in any of the 240 months).
On top of the operating engine, you get a real LP/GP promote waterfall, XIRR and equity multiple calculations, a full discounted cash flow analysis (unlevered and levered, each cross-validated against the return calculations), and a built-in sensitivity grid for exit cap rate and rent growth. Whether you’re underwriting a new acquisition, presenting to LPs, stress-testing a portfolio strategy, or just want a rock-solid foundation to plug your own deals into, this model gives you institutional-grade rigor without paying for institutional-grade consulting hours — change one assumption on the Global Assumptions tab and watch it responsibly propagate through 76,000+ formulas with nothing left hardcoded or hidden.
Real Estate Asset Management Frequently Asked Questions (Faq)
I only have 3–5 properties right now, not 20. Is this still useful for me?
Yes. Just leave the unused property rows on the Property List / Intake tab blank or zero out the purchase price — the formulas are built with IF-conditions on acquisition timing, so an unfilled property simply contributes zero to every downstream tab. You can also scale up later by filling in more rows as your portfolio grows.
Do I need to know how to build financial models to use this?
No modeling background is required to use it — every input you’d actually change (rents, growth rates, loan terms, exit assumptions) is clearly marked in blue text on a yellow background. You will get more value out of it if you’re comfortable reading a P&L and a balance sheet, since the outputs are institutional-standard financial statements.
Is this compatible with Google Sheets, or only Excel?
It’s built natively in Excel (.xlsx) and every formula uses standard Excel functions (PMT, XIRR, EDATE, SUMPRODUCT, etc.). Google Sheets can open .xlsx files and most of these formulas will carry over, but XIRR and a couple of the date-arithmetic functions can behave slightly differently in Sheets, so Excel or a modern version of Excel for Mac/Web is recommended for full fidelity.
Can I change the number of properties, the hold period, or the periodicity?
The model ships built for 20 properties over 240 months (20 years). Reducing the number of active properties is simple (see above). Extending the timeline, adding properties beyond 20, or switching to quarterly/annual periodicity would require structural rework, since the row/column layout is built specifically around the 240-month, 20-property grid. Talk to us about your requirements.
Are the formulas locked or protected? Can I actually see how everything works?
Nothing is locked, hidden, or obfuscated. Every formula is fully visible and editable — you can click into any cell and trace exactly how a number was derived, all the way back to the Property List inputs. This is intentional: a model you can’t audit isn’t one you should trust with real capital decisions.
How is depreciation, CapEx, and the debt schedule actually handled?
Depreciation is straight-line based on a depreciable basis (purchase price less land allocation) over your specified useful life. CapEx is split into an ongoing reserve contribution (a % of EGI, reducing distributable cash flow) and periodic major CapEx spend (capitalized into the asset’s cost basis so the balance sheet stays in balance). Debt is a standard self-amortizing mortgage per property, with its own rate, term, and amortization schedule.
Does it include IRR and equity multiple calculations, or do I have to build those myself?
They’re built in. The Returns & Waterfall tab calculates portfolio-level XIRR and MOIC, plus a two-tier LP/GP promote waterfall (return of capital → preferred return → promote split) so you can see exactly how returns are shared between investors and sponsor.
What’s the difference between the DCF tab and the Returns & Waterfall tab — isn’t that redundant?
They answer different questions. Returns & Waterfall tells you the actual expected IRR/multiple given the deal’s cash flows. The DCF tab asks the reverse question: discounted at your required rate of return (WACC for the unlevered view, cost of equity for the levered view), is this deal worth more or less than what you’re paying for it? The two are cross-checked against each other so you can trust they’re pulling from the same underlying numbers.
The sample properties don’t match anything I own — how much rework is it to plug in my own deals?
The 20 sample properties exist purely to show the model working end-to-end. To use your own data, you only need to touch the Property List / Intake tab — replace price, rent, vacancy, growth rates, and loan terms per property. Every other tab recalculates automatically; you never need to touch a downstream formula.
Value Your Real Estate Asset Management With A DCF
Discounted Cash Flow (DCF): Mapping intrinsic asset values.
A 20-year Discounted Cash Flow (DCF) model provides real estate asset managers with a comprehensive long-term framework to evaluate the present value of a property portfolio across multiple economic cycles. By projecting monthly net operating income, capital expenditures, and ultimate disposition proceeds over 240 periods—and discounting those cash flows back to a present value using a target discount rate—investors can accurately price risk, plan for scheduled debt refinancings, and determine intrinsic asset value. DCF tab with both unlevered (asset-level) and levered (equity-level) discounted cash flow analysis, each with NPV and an IRR cross-check. Unlevered (asset-level) DCF: Year-0 acquisition outflow, annual NOI minus CapEx (reserve + major spend) minus any mid-hold acquisition costs, plus a Year-20 terminal value (gross exit value less selling costs, no debt payoff since it’s pre-leverage) — all discounted back at WACC.
Sensitivity Analysis: Testing the capitalization rates
Sensitivity analysis acts as a critical risk-management tool within this framework, allowing asset managers to stress-test how variations in core assumptions impact overall returns like IRR and equity multiples. By running matrices on volatile drivers such as exit capitalization rates, rental growth trajectories, and interest rate spreads, teams can identify vulnerability thresholds and optimize hold-versus-sell strategies under shifting market conditions.
Final Notes on the 20 Year Financial Model Integration
The model has 20 properties × 240 months, designed with consistent monthly timeline and standardized property IDs. Every major schedule should be capable of being traced from portfolio cash rollup → invidual property cash flows → underlying assumption, which makes the model auditable, maintainable, and suitable for long-term asset-management use.
Further Reading
Merger & Acquisitions Model: Download a professional M&A financial model. Dynamic valuation, accretion/dilution analysis, synergies, and debt schedules.
- Real Estate Private Equity Fund Financial Projection Model: Professional-grade Real Estate Private Equity (REPE) fund financial model in Excel.
- Real Estate CMBS Financial Model: Create accurate CMBS, ABS financial forecasts in minutes. Download a powerful financial model with built-in formulas, dashboards, and easy-to-edit assumptions.