
CMBS & ABS Financial Model Template
This CMBS/ABS financial model Template is a fully dynamic Excel template built for commercial mortgage-backed securities and asset-backed securities professionals who need a complete, loan-level structured finance model without building one from scratch. Covering the full lifecycle of a conduit CMBS transaction — from collateral pool to bond tranche — this Excel CMBS model gives analysts, investors, and structurers a ready-to-use framework for underwriting, deal structuring, and cash flow forecasting in one polished workbook.
Built across 20 fully linked tabs, the model runs a 3-year historical period and a 20-year, 240-month monthly forecast with annual roll-up columns, all denominated in USD and displayed on true calendar-year timelines. A single dynamic date engine drives every date in the workbook — change the deal’s start date once on the Assumptions tab and every schedule, from the 50-loan collateral pool through the bond-level cash flow waterfall, updates instantly and automatically.
Whether you’re evaluating a CMBS conduit deal, structuring an ABS waterfall, stress-testing a securitization under different CPR/CDR/loss-severity scenarios, or teaching structured finance modeling, this Excel-based CMBS/ABS model gives you a transparent, fully formula-driven build with no hidden macros or black boxes. Every cell is traceable: color-coded inputs, formulas, and cross-tab links make the model easy to audit, customize, and present to investors, credit committees, or students.
Why Buy This Model
If you need a credible, audit-ready CMBS/ABS model fast, building one in-house from a blank workbook can take days or weeks — and still leave gaps in the waterfall logic, loss allocation, or date-handling that only surface under stress testing. This model gives you a complete, internally consistent structure out of the box: a 50-loan collateral pool, full loan-level amortization, delinquency and special servicing mechanics, an 8-class sequential-pay waterfall with reverse-sequential loss allocation, bond-level returns analytics (yield, WAL, duration, credit enhancement), and 11 built-in integrity checks that reconcile every dollar from the collateral pool to the bond classes. It’s built to be extended — swap in your own loan tape, adjust the capital structure, or flex the scenario assumptions — without breaking a single formula.
CMBS & ABS Model Tab-by-Tab Breakdown
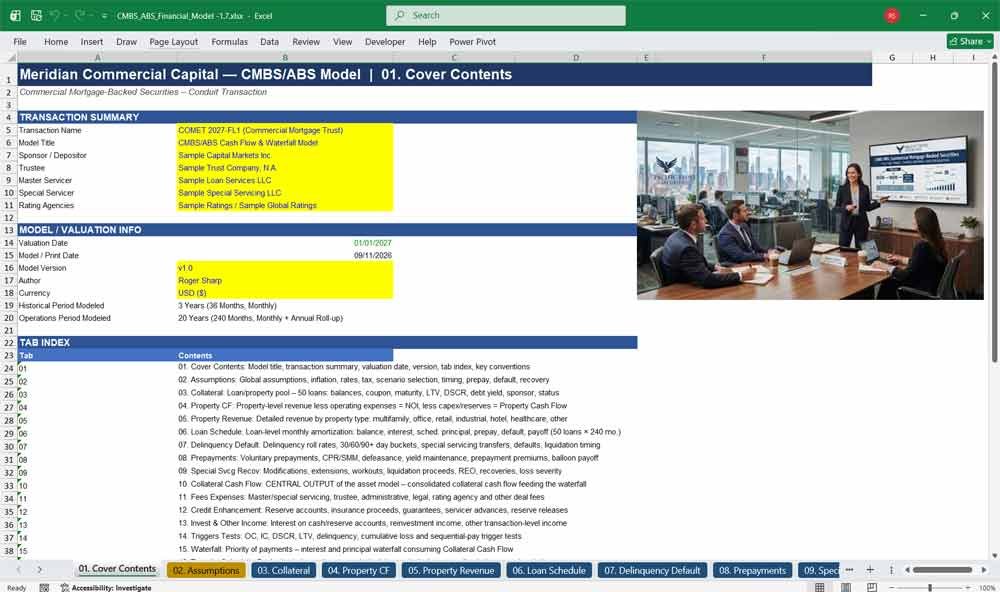
01. Cover Contents
Your CMBS model’s front page: transaction summary, valuation date, model version, and a full navigable tab index. This cover sheet documents every modeling convention used throughout the workbook, so analysts, credit teams, and investors can orient themselves in seconds before diving into the detailed CMBS/ABS cash flow analysis.
- Transaction summary and deal identification fields
- Model/valuation date, version, and currency reference
- Full 20-tab index with descriptions
- “Key Conventions” guide explaining the dynamic date engine, color coding, and model architecture
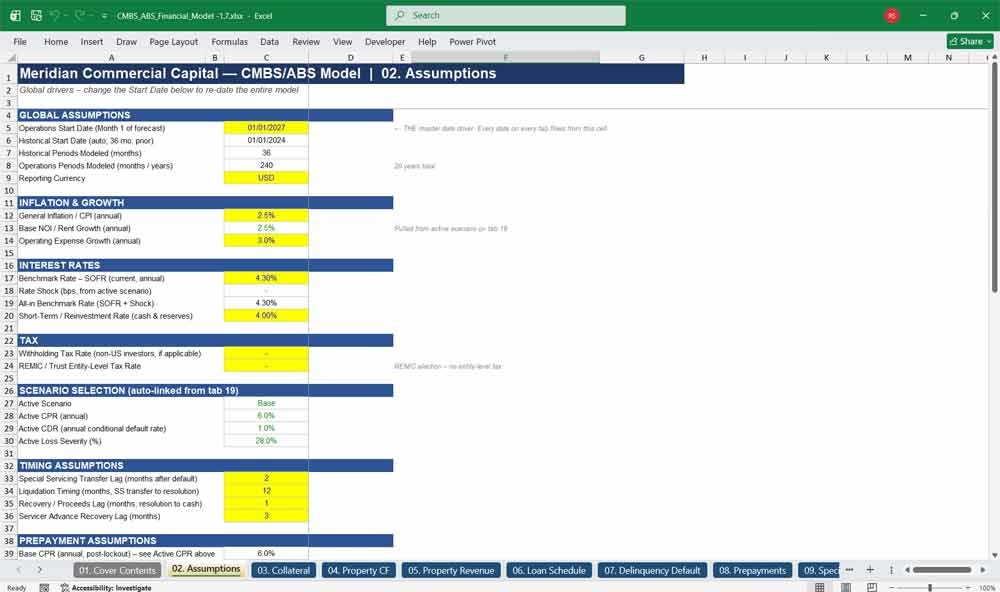
02. Assumptions
The control panel of the entire CMBS/ABS model. One editable Assumptions tab drives every downstream calculation — interest rates, prepayment and default curves, recovery assumptions, servicing fees, and property operating expenses — so you can re-run the whole deal under new assumptions in seconds, no manual updates required.
- Master Operations Start Date drives every date in the workbook
- Editable CPR, CDR, severity, and timing/lag assumptions
- Interest rate, inflation, and property growth assumptions
- Servicing, trustee, and deal fee assumption inputs
CMBS & ABS Revenues & Schedules
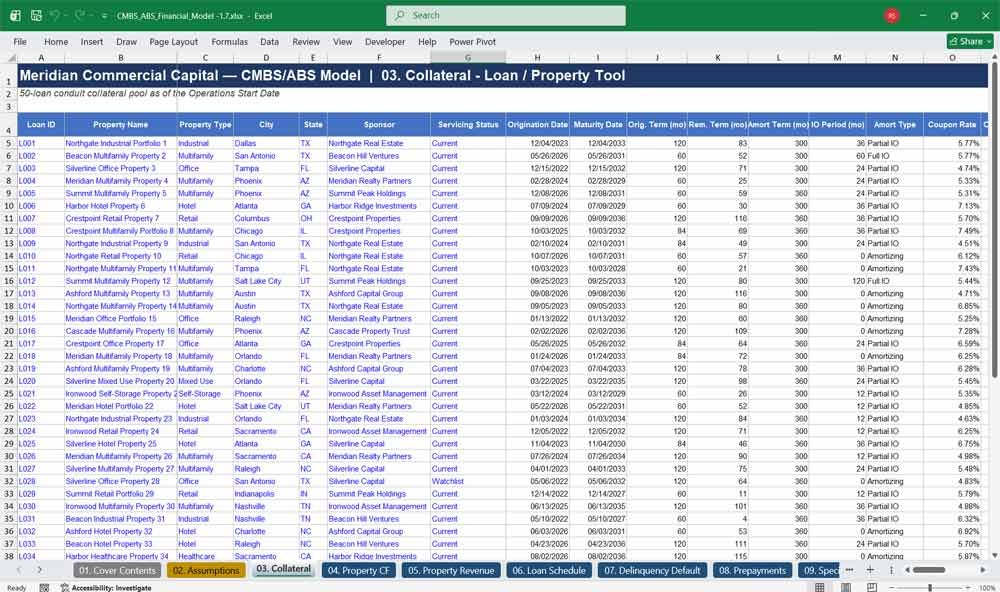
03. Collateral
A granular 50-loan collateral pool tape, the foundation of this CMBS Excel model. Each loan carries property type, balance, coupon, amortization term, LTV, DSCR, and occupancy, with pool-level weighted averages calculated automatically — giving you the loan-level transparency real CMBS conduit deals require.
- 50 synthetic loans across 8 property types (multifamily, office, retail, industrial, hotel, and more)
- Loan-level LTV, DSCR, coupon, and occupancy detail
- Automatic pool-level weighted-average statistics
- Feeds loan amortization mechanics directly into the Loan Schedule tab
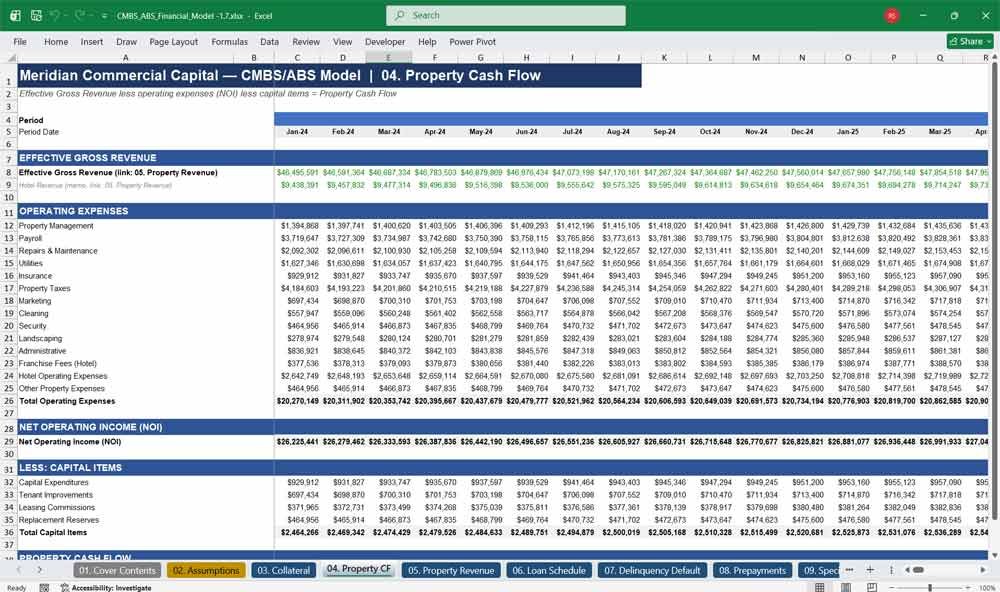
04. Property CF
Pool-level property cash flow, built from revenue down to net operating income and capital items. This tab bridges real estate operating performance to loan-level credit metrics, giving CMBS analysts a clear view of the NOI and property-level cash flow supporting the underlying collateral pool.
- Effective gross revenue less 14 categorized operating expense lines
- Net operating income (NOI) calculated monthly across the 20-year forecast
- Capital expenditure and reserve deductions modeled explicitly
- Fully linked to Property Revenue and Assumptions tabs
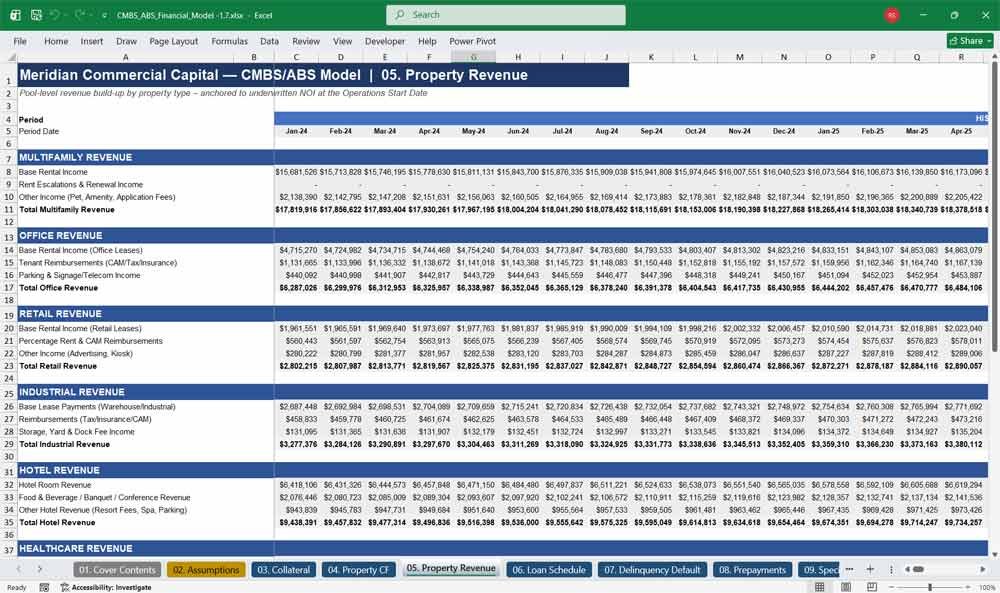
05. Property Revenue
Revenue build-up by property type, feeding the Property CF tab. This tab models rental and ancillary revenue streams across the collateral pool’s eight property sectors, using a growth-chain methodology that ties historical and forecast revenue to one consistent NOI growth assumption.
- Revenue modeled separately by property type (multifamily, office, retail, hotel, etc.)
- Historical and forecast revenue linked through one continuous growth curve
- Anchored to actual pool-level NOI for realistic starting values
- Drives operating expense and capital item calculations downstream
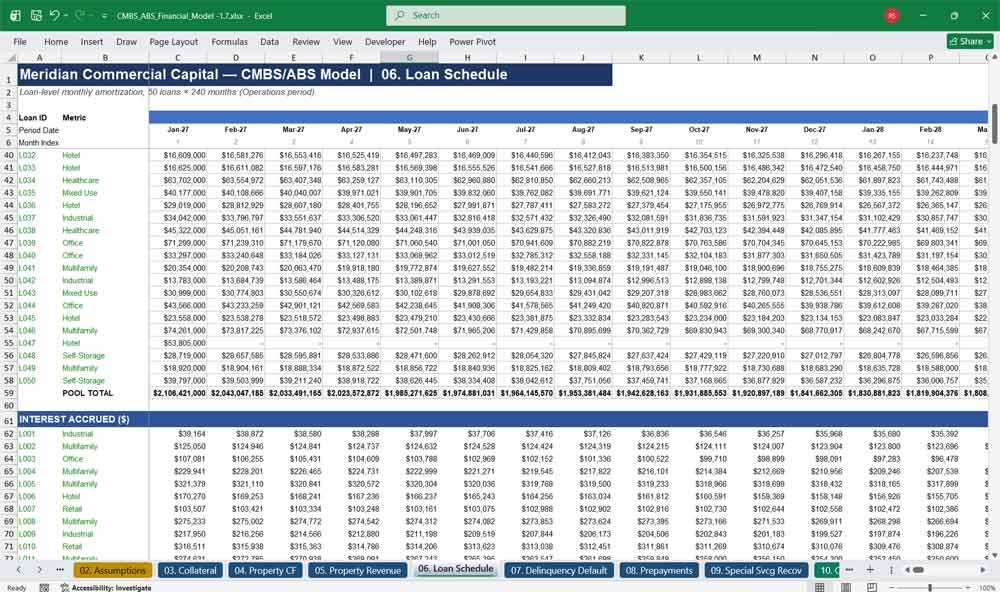
06. Loan Schedule
The amortization engine of the model: a full 240-month schedule for all 50 loans, tracking beginning balance, interest, scheduled principal, prepayments, defaults, and maturity payoffs. This is the largest and most detailed tab in the CMBS workbook, converting loan-level mechanics into pool-level cash flow.
- Loan-by-loan monthly amortization across the full 20-year forecast
- Scheduled principal, prepayment, default, and balloon payoff tracked separately
- Pool Summary section aggregates all 50 loans into total collections
- Feeds Delinquency, Prepayments, Special Servicing, and Collateral Cash Flow tabs directly
07. Delinquency Default
Delinquency bucket tracking (30/60/90+ days) and default cascade modeling for the CMBS loan pool. This tab gives investors and analysts visibility into rolling delinquency rates and how defaulted loans migrate toward special servicing — a critical credit risk indicator in any CMBS/ABS model.
- 30-, 60-, and 90-day delinquency bucket roll rates
- Links to the Special Servicing tab’s transfer and liquidation pipeline
- 60+ day delinquency percentage feeds the Triggers & Tests tab
- Transparent, editable roll-rate assumptions
08. Prepayments
Prepayment modeling using CPR/SMM conventions, including defeasance, yield maintenance, and prepayment premium calculations. This tab lets users flex prepayment speed assumptions and immediately see the impact on collateral cash flow, loan balances, and ultimately investor yield across the CMBS bond structure.
- CPR-to-SMM conversion driven by the active scenario assumption
- Defeasance and yield maintenance premium modeling
- Balloon payoff and voluntary prepayment tracked separately
- Directly adjustable via the Scenarios tab’s CPR selector
CMBS & ABS Cash Flow & Expenses
09. Special Svcg Recov
Models the full special servicing and loss recovery pipeline: default transfer, modification/cure, liquidation timing lag, and net recovery proceeds. This tab is the authoritative source for realized losses in the CMBS model, flowing directly into the waterfall’s loss allocation logic.
- Full transfer-to-liquidation pipeline with realistic servicing lag assumptions
- Modification/cure rate reduces gross defaults before liquidation
- Liquidation proceeds, costs, and net recovery modeled explicitly
- Realized losses feed both the Waterfall and Triggers & Tests tabs
10. Collateral Cash Flow
The central output of the entire asset model. This tab consolidates every collateral-side cash flow — interest, principal, prepayments, recoveries, fees — into one total collateral cash flow figure that becomes the single input driving the bond-level waterfall, exactly as real CMBS servicers report.
- Nine distinct cash flow components consolidated into one total
- Structured to feed the Waterfall tab directly, deal-standard practice
- Historical, 240-month operations, and annual roll-up views
- The single source of truth for “cash available to bondholders”
11. Fees Expenses
Deal-level fee modeling covering master servicing, special servicing, trustee, administrative, and other fees, each calculated as a basis-point rate against pool or special servicing balances. This tab quantifies the true cost of running the CMBS transaction before cash reaches bondholders.
- Master, special, trustee, and admin fee categories modeled separately
- Fees calculated on pool balance or special servicing pipeline balance
- Directly reduces net interest available in the Waterfall tab
- Fully editable basis-point assumptions
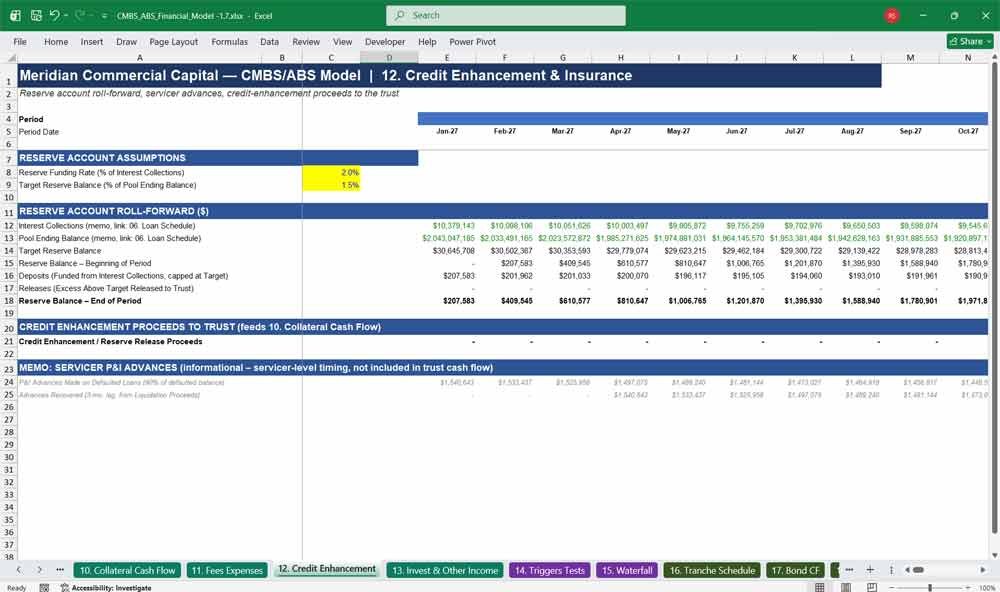
12. Credit Enhancement
Reserve account roll-forward mechanics: funding deposits, target balance testing, and excess releases to the trust. This tab models the credit enhancement mechanism that protects senior bondholders in a CMBS structure, plus a memo section tracking servicer principal-and-interest advances.
- Reserve account beginning/ending balance roll-forward, month by month
- Deposits capped at a target percentage of pool balance
- Excess reserve releases flow into Collateral Cash Flow
- Memo tracking of servicer P&I advances on defaulted loans
13. Invest & Other Income
Models investment income earned on the reserve account balance and collection account float at the deal’s cash rate assumption. A smaller but important cash flow source, this tab captures incremental yield that supports total collateral cash available to the waterfall.
- Investment income on reserve account balances
- Collection account float income modeled at the cash rate
- Fully linked to the Assumptions tab’s rate inputs
- Feeds directly into total Collateral Cash Flow
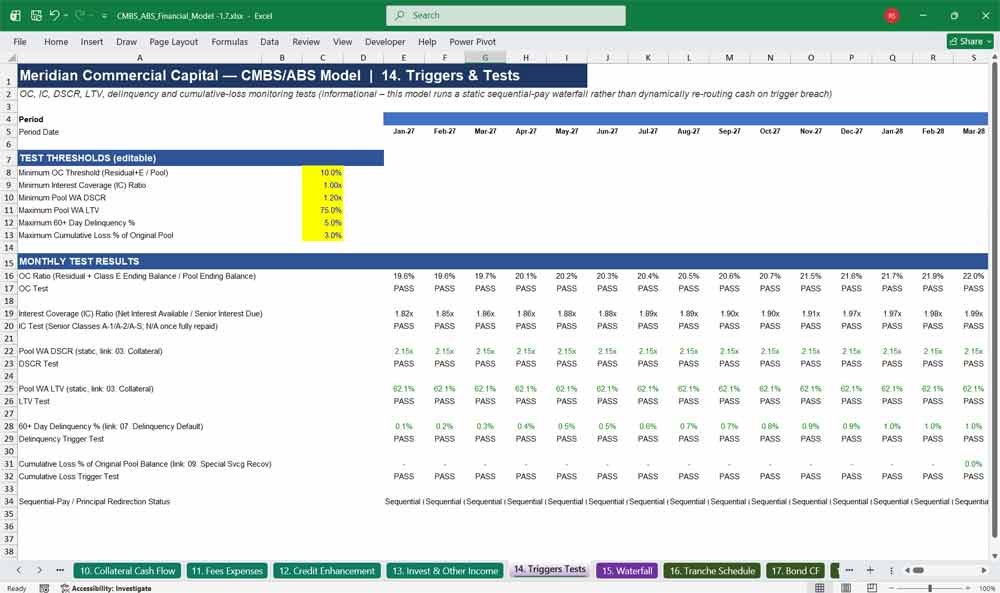
14. Triggers Tests
Monitors the key performance triggers real CMBS investors track: overcollateralization, interest coverage, DSCR, LTV, delinquency, and cumulative loss tests against editable thresholds. This tab gives buyers a month-by-month pass/fail view of deal performance and structural protection.
- Overcollateralization (OC) ratio and pass/fail test, editable threshold
- Interest coverage, DSCR, and LTV trigger tests
- 60+ day delinquency and cumulative loss trigger monitoring
- Editable thresholds let users stress-test structural protections
CMBS & ABS Bonds & Returns
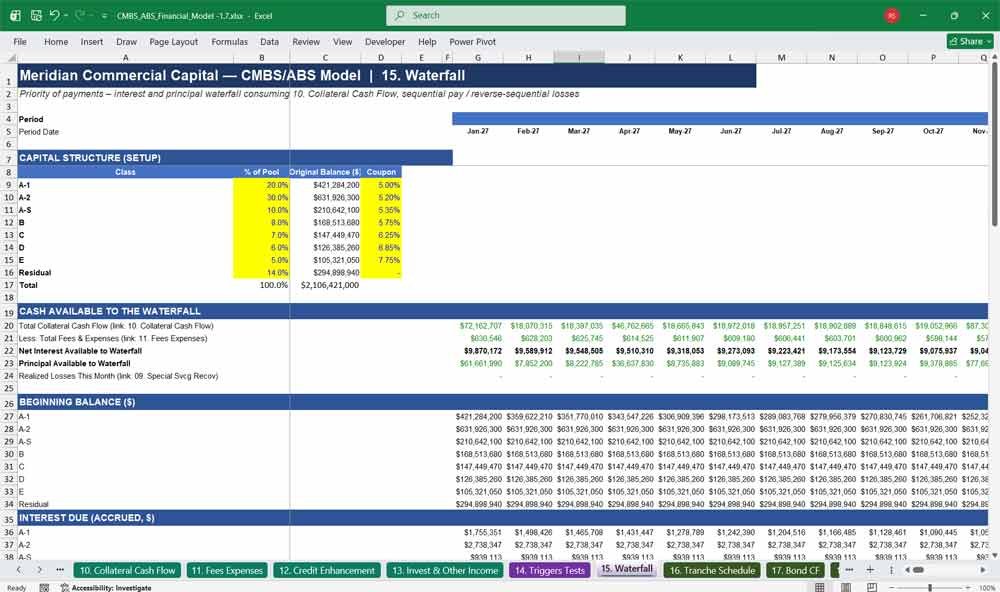
15. Waterfall
The heart of the bond-side model: a full interest and principal priority-of-payments waterfall across 8 bond classes, with sequential pay and reverse-sequential loss allocation. This tab consumes the Collateral Cash Flow tab directly, exactly mirroring how real CMBS deals distribute cash to bondholders.
- Sequential interest and principal allocation across 8 tranches
- Reverse-sequential loss allocation (junior classes absorb losses first)
- Residual class captures excess spread after senior classes are paid
- Built-in reconciliation confirms 100% of available cash is distributed
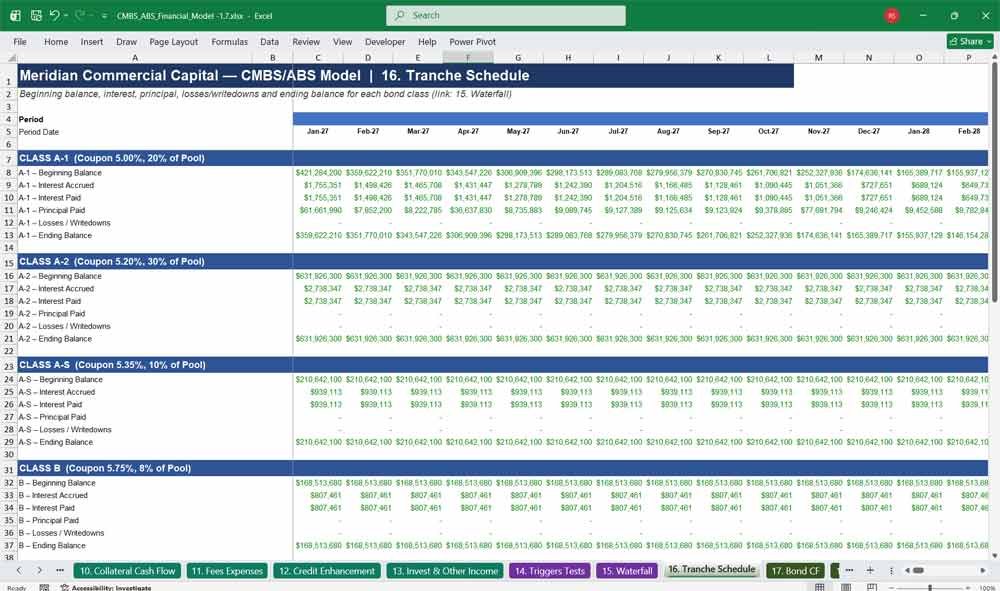
16. Tranche Schedule
Per-class amortization detail showing beginning balance, interest accrued, interest paid, principal paid, losses, and ending balance for each of the 8 bond classes — giving investors a transparent, tranche-by-tranche view of how their specific bond class performs over the life of the deal.
- Full monthly amortization schedule for every bond class
- Interest accrual vs. interest paid tracked separately (shortfall visibility)
- Principal paydown and loss allocation shown by class
- Directly sourced from the Waterfall tab’s allocation logic
17. Bond CF
Consolidated bond-level cash flow — interest plus principal — for each of the 8 tranches, plus a total bond cash flow line. This is the clean, investor-facing cash flow output used to calculate returns for each class in the Returns Analytics tab.
- Total cash flow (interest + principal) by bond class
- Aggregate total bond cash flow across all tranches
- Feeds the XIRR-based yield calculations in Returns Analytics
- Simple, presentation-ready format for investor reporting
18. Returns Analytics
Full investor returns package: yield (XIRR), WAL, modified duration, credit enhancement percentage, expected loss, and total return for every bond class, plus deal-level statistics like WAC, weighted-average LTV/DSCR, and cumulative losses — everything a CMBS/ABS investor needs to evaluate the deal.
- Class-by-class yield, IRR, and weighted-average life (WAL)
- Credit enhancement and subordination percentage by tranche
- Expected loss, loss timing, and total return metrics
- Deal-level statistics: WAC, pool factor, recovery rate, excess spread
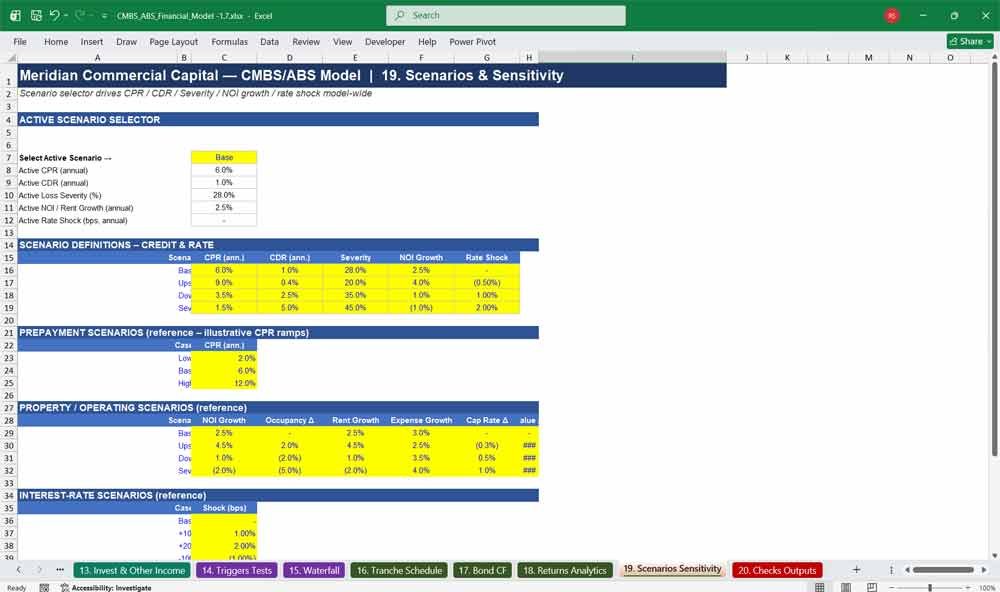
19. Scenarios Sensitivity
A one-click scenario selector (Base, Upside, Downside, Severe Downside) that flows CPR, CDR, loss severity, NOI growth, and rate shock assumptions into the entire model instantly. This tab lets buyers stress-test the CMBS deal under multiple macro and credit scenarios without touching a single other tab.
- Dropdown scenario selector drives the whole model’s active assumptions
- Four pre-built scenarios: Base, Upside, Downside, Severe Downside
- Editable scenario definition table for full customization
- Simplified sensitivity summary estimates cumulative loss by scenario
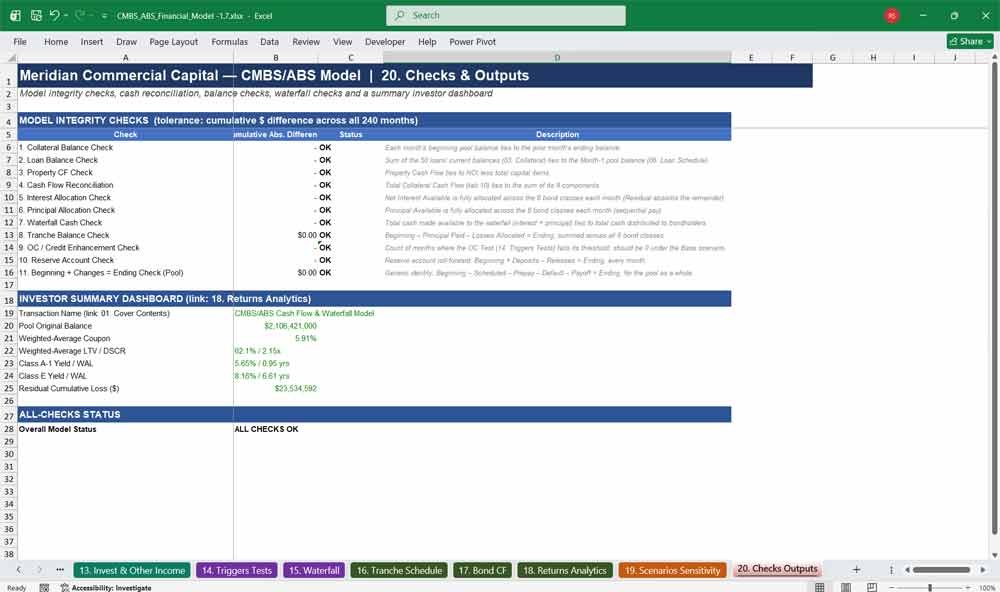
20. Checks Outputs
Eleven built-in integrity checks reconcile cash, balances, and allocations across every stage of the model — collateral to waterfall to bonds — plus an investor summary dashboard with key deal metrics at a glance. This tab gives buyers immediate confidence the model ties out perfectly.
- 11 automated checks covering cash flow, balance, and waterfall reconciliation
- Overall “ALL CHECKS OK” model status indicator
- Investor summary dashboard: pool stats, bond yields, and cumulative loss
- Verified error-free across the full 240-month forecast
CMBS & ABS Frequently Asked Questions (Faq)
Does this model actually calculate a full bond waterfall, or just estimate cash flows?
It’s a full, formula-driven priority-of-payments waterfall — not an estimate. The model runs sequential interest and principal allocation across 8 bond classes, with reverse-sequential loss allocation, month by month across the entire 20-year forecast, exactly the way a real CMBS trustee report is structured.
Can I change the deal’s start date without breaking the model?
Yes. Every date in the workbook — historical, forecast, and annual — is driven off a single Operations Start Date cell on the Assumptions tab. Change that one date and all 20 tabs recalculate their timelines automatically, with no manual updates or broken formulas.
How many loans and bond classes does the model include?
The collateral pool contains 50 individual loans across 8 property types (multifamily, office, retail, industrial, hotel, healthcare, mixed-use, and self-storage), and the capital structure includes 8 bond classes from senior AAA-style tranches down to a residual/equity class.
Is the model built with real formulas, or are values hardcoded?
Every calculated cell is a live Excel formula — there are no hardcoded outputs and no macros. Inputs are color-coded blue, formulas are black, and cross-tab links are green, so you can trace and audit every number back to its source assumption.
Can I stress-test the deal under different economic scenarios?
Yes. The Scenarios & Sensitivity tab includes a one-click dropdown (Base, Upside, Downside, Severe Downside) that instantly changes CPR, CDR, loss severity, NOI growth, and rate shock assumptions across the entire model, so you can see how the deal performs under stress.
How do I know the model’s numbers actually tie out?
The Checks & Outputs tab runs 11 independent integrity checks — covering cash flow reconciliation, balance roll-forwards, tranche allocations, and reserve accounts — across all 240 forecast months, with a clear “ALL CHECKS OK” status so you can verify the model ties out before you rely on it.
Will this work in Excel, or do I need special software?
The model is a standard .xlsx workbook that opens in any recent version of Microsoft Excel (and most spreadsheet software with formula compatibility). No plug-ins, add-ins, or special licenses are required.
Can I customize the loan pool, assumptions, or capital structure?
Yes. The model is fully editable — swap in your own loan tape on the Collateral tab, adjust any assumption on the Assumptions tab, or resize the capital structure on the Waterfall tab. Because every downstream tab is formula-linked, changes flow through the model automatically.
Who is this model built for?
CMBS/ABS analysts, structured finance professionals, real estate credit investors, students learning securitization mechanics, and anyone who needs a transparent, audit-ready template for underwriting or presenting a commercial mortgage-backed securities transaction.
What returns metrics can I pull for each bond class?
The Returns Analytics tab calculates yield (XIRR), IRR, weighted-average life (WAL), modified duration, credit enhancement percentage, expected loss, loss timing, and total return for every one of the 8 bond classes, plus deal-level statistics like WAC and cumulative losses.
Further Reading
Merger & Acquisitions Model: Download a professional M&A financial model. Dynamic valuation, accretion/dilution analysis, synergies, and debt schedules.
- Real Estate Private Equity Fund Financial Projection Model: Professional-grade Real Estate Private Equity (REPE) fund financial model in Excel.
- Real Estate Asset Management Financial Model: Boost your financial planning with this downloadable Real Estate Asset financial model. Perfect for budgeting, forecasting, valuation, and business decision-making.
Final Notes on the 20 Year Financial Model Integration
- Interdependencies: Cash flow projections directly influence the income statement and balance sheet through interest income, reserves, and tranche payments.
- Scenario Analysis: Embedded functionality to test various market assumptions like property value depreciation, default rates, and interest rate spikes.
- Investor Reporting: Schedules for interest/principal payouts and performance updates tailored to tranche types.
Combined CMBS ABS Finance Model
This structured model helps CMBS and ABS Investors have a broad market spectrum, offering the right balance between cost, and investment support.