
Equipment Rental Financial Model Template
This Equipment Rental Financial Model Template is a fully built, 5-year monthly Excel forecast designed specifically for construction, industrial, and heavy equipment rental businesses. Built around a true fleet-driven architecture, the model links every equipment purchase, disposal, and utilization rate directly to revenue, EBITDA, cash flow, and the balance sheet — so a single change to your fleet plan flows automatically through the entire financial statement package. Whether you’re raising capital, underwriting an acquisition, or building an internal budget, this rental equipment financial model gives you a bank-ready, audit-tested foundation in minutes instead of months.
Financial Model for an Equipment Rental Company
Unlike generic startup templates, this equipment rental business model tracks ten distinct equipment categories (All are editable) — excavators, telehandlers, forklifts, scissor lifts, boom lifts, generators, compressors, lighting towers, dumpers, and rollers — each with its own fleet roll-forward, depreciation schedule, utilization curve, and rental rate assumptions. Every dollar of rental revenue is calculated the way rental operators actually plan: fleet units × available rental days × utilization % × average daily rate. The result is a granular, defensible 60-month projection with annual roll-up summaries for 2027 through 2031, complete with fleet economics KPIs like revenue per unit, ROIC by category, payback period, and residual value.
This isn’t a static spreadsheet — it’s a dynamic financial modeling engine. Change the model start date on the Assumptions tab and every date, month header, and annual column across all 20 tabs updates automatically. The balance sheet ties to zero in every single month, the cash flow statement reconciles on the indirect method, and every one of the workbook’s tens of thousands of formulas has been recalculated and error-checked. Built with color-coded inputs, formulas, and links following institutional financial modeling standards, this equipment rental Excel model is ready for investors, lenders, and operators who need a rigorous, three-statement financial model they can trust and customize immediately.
Model Tab-By-Tab Highlghts
01. Cover Control
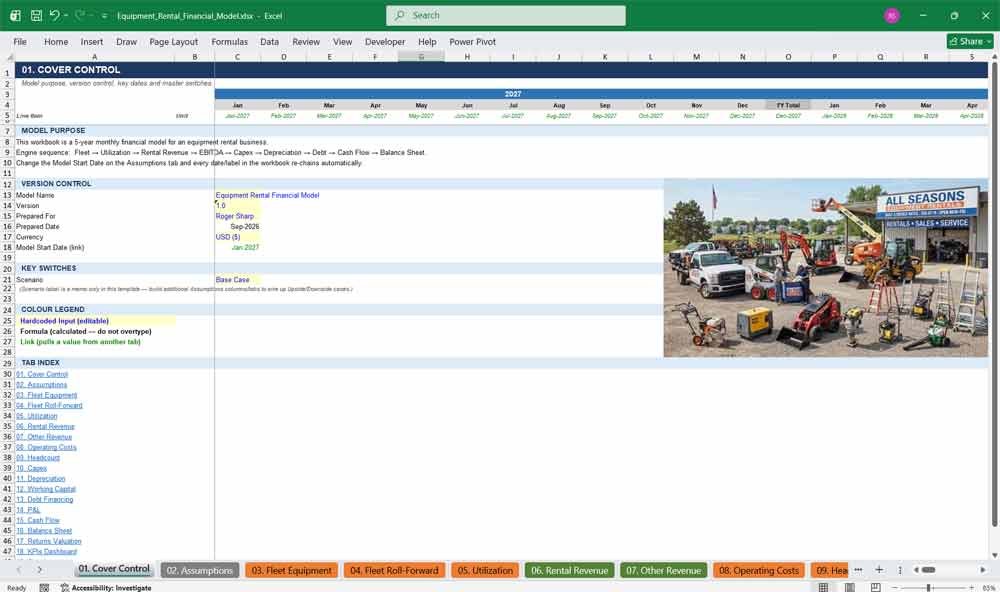
The Cover Control tab is your model’s command center, displaying company details, model scope, currency, and forecast period at a glance. It anchors the entire equipment rental financial model with a clean, professional cover page ideal for investor decks, lender packages, and internal presentations.
Highlights:
- Professional, presentation-ready cover page for investors and lenders
- Displays model title, currency (USD), forecast horizon, and version control
- Sets the navy-blue branded design theme used throughout the workbook
- Instantly signals a polished, institutional-grade financial model
02. Assumptions
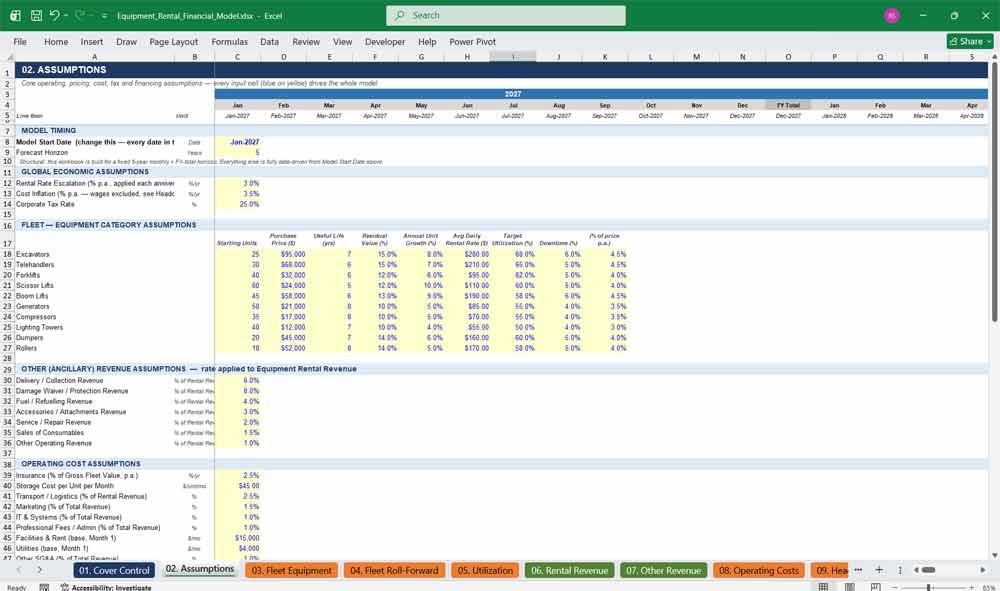
The Assumptions tab is the single source of truth driving every formula in the model. Change the start date, rental rates, cost inflation, tax rate, or financing terms here and watch the entire 5-year equipment rental forecast — all 20 tabs — recalculate instantly and automatically.
Highlights:
- One-cell “Model Start Date” input re-dates the entire 60-month workbook automatically
- Centralized inputs for fleet pricing, rental escalation, cost inflation, and tax rate
- Debt, working capital, and financing assumptions in one editable location
- Color-coded blue input cells make customization fast and error-free
Equipment Rental Value Model
03. Fleet Equipment
The Fleet Equipment tab defines the DNA of your rental fleet across ten equipment categories — from excavators to rollers. It sets purchase price, useful life, residual value, and daily rental rate per category, forming the foundation every downstream revenue and depreciation calculation is built on.
Highlights:
- Ten pre-built equipment categories: excavators, telehandlers, forklifts, scissor lifts, boom lifts, generators, compressors, lighting towers, dumpers, and rollers
- Editable purchase price, useful life, and residual value assumptions per category
- Average daily rental rate input feeds directly into the revenue engine
- Fully customizable to add, remove, or reprice equipment types
04. Fleet Roll-Forward
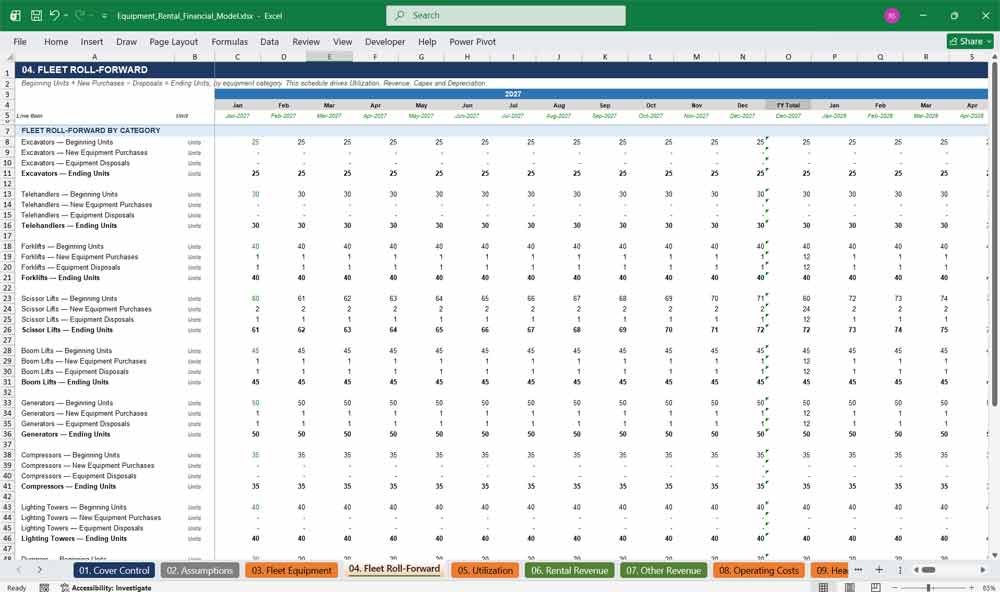
This tab is the true engine of the model: Beginning Units + New Purchases − Disposals = Ending Units, tracked monthly for all 60 months and every equipment category. It powers utilization, revenue, capex, and depreciation, making fleet planning the core driver of the entire forecast.
Highlights:
- Monthly beginning-to-ending unit roll-forward by equipment category
- Tracks new purchases and disposals with full audit trail
- Drives utilization, revenue, capex, and depreciation calculations downstream
- Age-of-equipment tracking supports realistic disposal and resale planning
05. Utilization
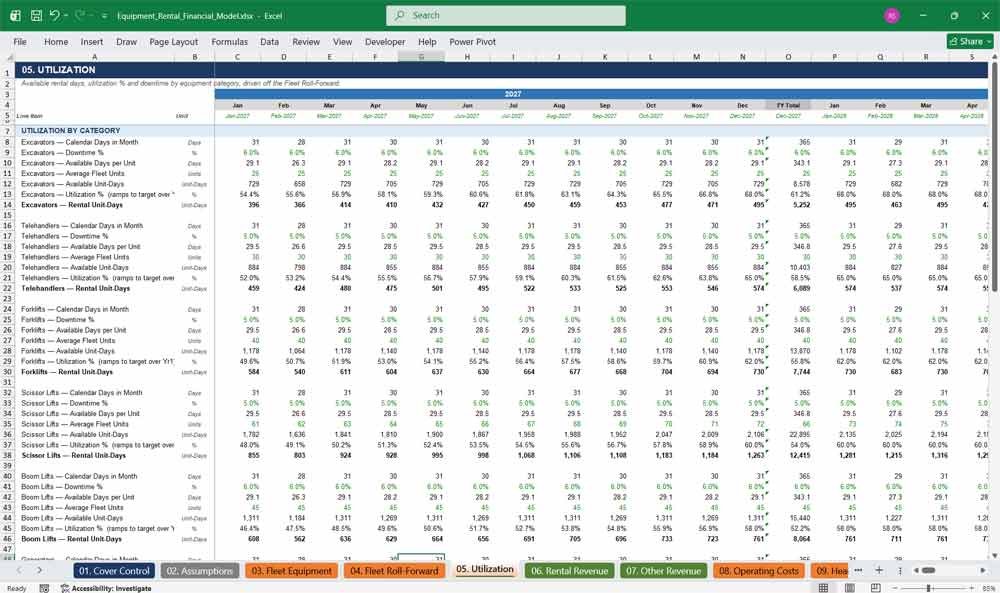
The Utilization tab converts raw fleet units into available and rented equipment days, factoring in calendar days, downtime, and category-specific utilization rates. It’s the critical bridge between fleet size and rental revenue, letting you stress-test how utilization swings impact top-line performance.
Highlights:
- Calculates available rental days net of scheduled downtime
- Category-specific utilization % assumptions, fully adjustable
- Converts fleet unit counts into actionable rental-day metrics
- Direct input into the Rental Revenue formula for every category
Equipment Rental Financial Statements
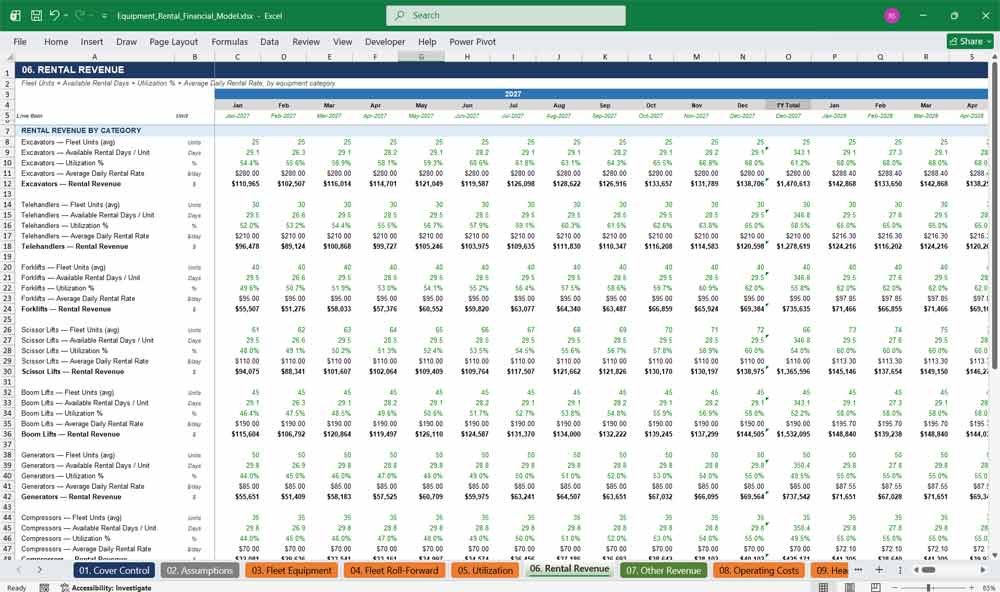
06. Rental Revenue
Rental Revenue applies the industry-standard formula — Fleet Units × Available Rental Days × Utilization % × Average Daily Rate — across all ten equipment categories every month. This tab produces the granular, defensible rental revenue build that investors and lenders expect from a rental equipment financial model.
Highlights:
- Category-by-category monthly rental revenue calculated from first principles
- Built-in rental rate escalation assumption for realistic multi-year growth
- Fully reconciled to fleet, utilization, and pricing assumptions upstream
- Annual roll-up columns summarize 2027–2031 revenue by category
07. Other Revenue
Beyond core rentals, this tab captures every ancillary revenue stream: delivery and collection fees, damage waiver, fuel and refuelling, accessories, used equipment sales, consumables, service and repair, and other operating income — plus five separate non-recurring revenue lines for one-time or unusual income events.
Highlights:
- Eight distinct ancillary revenue lines beyond core equipment rental
- Five dedicated non-recurring revenue streams tracked separately from operations
- Damage waiver and delivery fees modeled as realistic % add-ons
- Fully integrated into total company revenue and the P&L
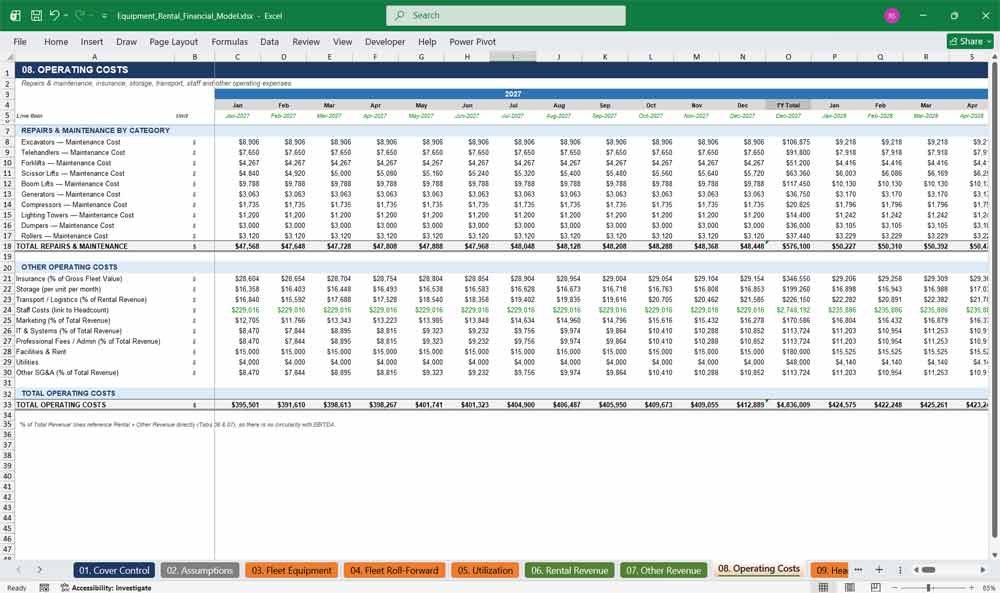
08. Operating Costs
The Operating Costs tab models the full cost structure of running a rental fleet — insurance, storage, transport, maintenance, marketing, IT, administration, facilities, utilities, and general SG&A — each with realistic industry-plausible rates that inflate over time and scale with fleet growth.
Highlights:
- Ten+ operating expense categories mapped to real rental industry cost drivers
- Maintenance cost tracked per equipment category and per unit
- Built-in cost inflation assumption applied consistently across all expense lines
- Feeds directly into EBITDA and net income on the P&L
09. Headcount
The Headcount tab builds a role-by-role staffing plan — covering operations, maintenance, sales, and administrative roles — with salary, headcount count, and payroll burden calculated monthly. It’s fully linked to Operating Costs, ensuring your people costs scale realistically with the growing fleet.
Highlights:
- Seven distinct role categories with individual headcount and salary inputs
- Monthly payroll cost roll-up feeding directly into operating expenses
- Headcount scales flexibly as the fleet and business grow
- Transparent, auditable staffing cost assumptions for lenders and investors
10. Capex
The Capex tab translates the Fleet Roll-Forward’s purchase plan into dollar-value capital expenditure, applying inflated current-year pricing to every new unit by category. It also tracks other (non-fleet) capex, giving a complete monthly and annual capital investment picture across the 5-year forecast.
Highlights:
- Automatic capex calculation from fleet purchase units × inflated unit price
- Separate tracking for fleet capex versus other business capex
- Annual capex summaries by equipment category for investment planning
- Fully linked to the Depreciation schedule and Cash Flow statement
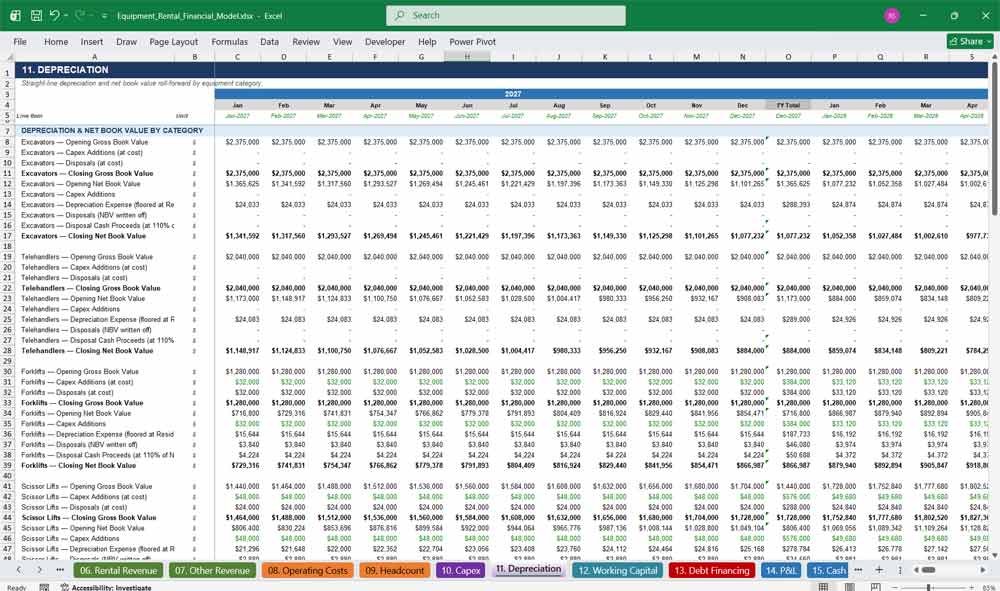
11. Depreciation
This tab runs a full straight-line depreciation roll-forward to residual value for every equipment category, tracking gross book value, accumulated depreciation, net book value, and disposals month by month. A built-in floor prevents negative book values, keeping every category’s balance realistic through Year 5.
Highlights:
- Straight-line depreciation to residual value, by equipment category
- Monthly gross value, net book value, and disposal tracking
- Depreciation floor logic prevents unrealistic negative book values
- Feeds EBITDA-to-EBIT bridge and the Balance Sheet fixed assets
12. Working Capital
The Working Capital tab models accounts receivable, accounts payable, inventory, and customer deposits using day-based assumptions (AR days, AP days, inventory days). It calculates the monthly change in working capital that flows directly into the Cash Flow statement’s operating activities section.
Highlights:
- AR, AP, and inventory driven by editable “days” assumptions
- Customer deposit balance tracked as a separate working capital line
- Monthly change in working capital feeds the Cash Flow statement
- Fully responsive to revenue and cost growth across the forecast
13. Debt Financing
This tab models an equipment term loan alongside a working capital facility, calculating draws, repayments, interest expense, and closing balances every month. It gives lenders and investors a transparent view of leverage, debt service coverage, and financing costs across the full 5-year horizon.
Highlights:
- Equipment term loan with configurable advance rate, interest rate, and term
- Separate working capital facility with its own balance and rate
- Monthly interest expense calculated on outstanding balances, not flat estimates
- Fully linked to Cash Flow financing activities and the Balance Sheet
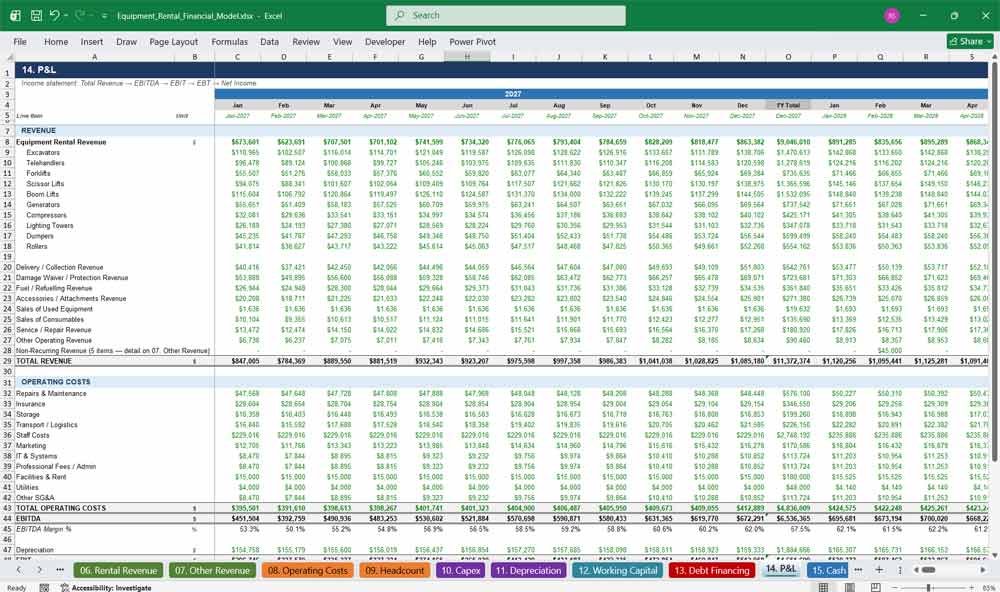
14. P&L
The Profit & Loss statement consolidates every revenue and cost driver into a complete monthly and annual income statement — from total revenue and EBITDA down to EBIT, EBT, tax, and net income. It’s the fully formula-driven heart of the equipment rental financial model.
Highlights:
- Complete revenue-to-net-income build across 60 months and 5 fiscal years
- Detailed EBITDA, EBIT, and EBT bridge with tax calculation
- Ten equipment categories broken out under Equipment Rental Revenue
- Fully dynamic — every line traces back to an underlying operating tab
15. Cash Flow
Built on the indirect method starting from EBITDA, the Cash Flow tab reconciles operating, investing, and financing activities into a monthly beginning-to-ending cash balance. It correctly handles capex, disposal proceeds, working capital changes, and debt movements for a fully audit-tested cash position.
Highlights:
- Indirect-method cash flow statement built from EBITDA, not net income
- Full operating, investing, and financing activities breakdown
- Correctly isolates disposal proceeds and gain-on-disposal to avoid double-counting
- Monthly beginning and ending cash balances tie directly to the Balance Sheet
16. Balance Sheet
The Balance Sheet ties out to exactly zero in every single month and fiscal year of the 5-year forecast — a rare, audit-grade standard for Excel financial models. It fully integrates fleet book value, working capital, debt, and equity into one verified, self-balancing statement.
Highlights:
- Verified to balance ($0 check) in all 60 months and 5 annual totals
- Fixed assets tied directly to the fleet depreciation schedule
- Debt and equity balances fully linked to the Debt Financing tab
- Retained earnings roll-forward captures opening equity and monthly net income
Equipment Rental Key KPIs & Metrics
17. Returns Valuation
The Returns Valuation tab calculates entry and exit enterprise value using EBITDA multiples, net debt bridging, and equity proceeds — producing a full IRR and MOIC analysis for investors. It transforms the operating forecast into an institutional-quality private equity or lender returns package.
Highlights:
- Entry and exit valuation driven by editable EBITDA multiples
- Automatic net debt bridge from enterprise value to equity value
- Full IRR and MOIC (multiple on invested capital) calculation
- Ideal for investor pitch decks, LOIs, and acquisition underwriting
18. KPIs Dashboard
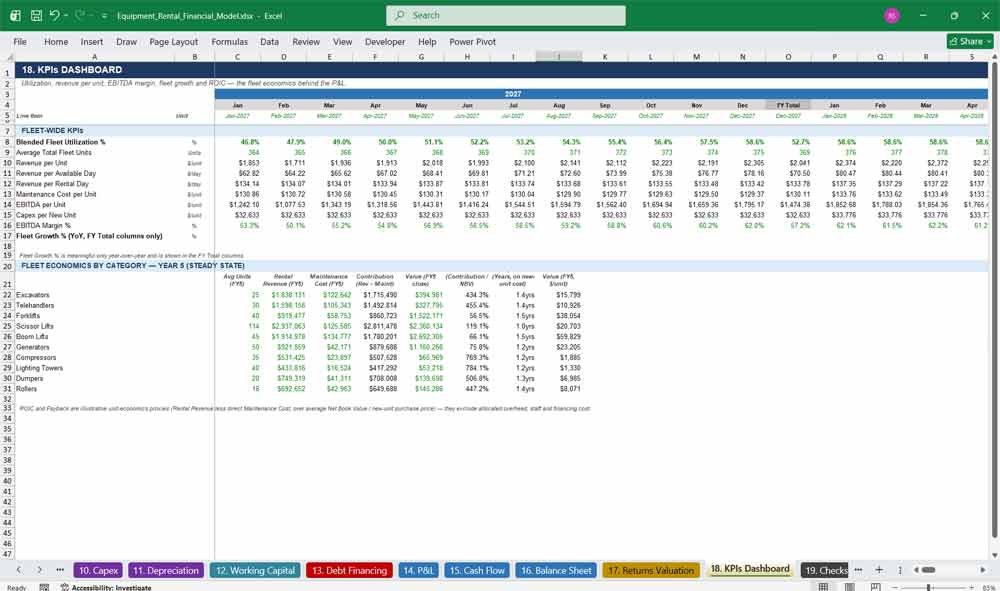
This tab surfaces the fleet economics metrics that matter most to rental operators: revenue per unit, revenue per available day, revenue per rental day, maintenance cost per unit, EBITDA per unit, capex per unit, payback period, and ROIC — all broken out by equipment category.
Highlights:
- Revenue per unit, per available day, and per rental day by category
- EBITDA per unit and capex per unit benchmarking
- Payback period and ROIC calculated for every equipment category
- Residual value tracking to support fleet replacement decisions
19. Checks
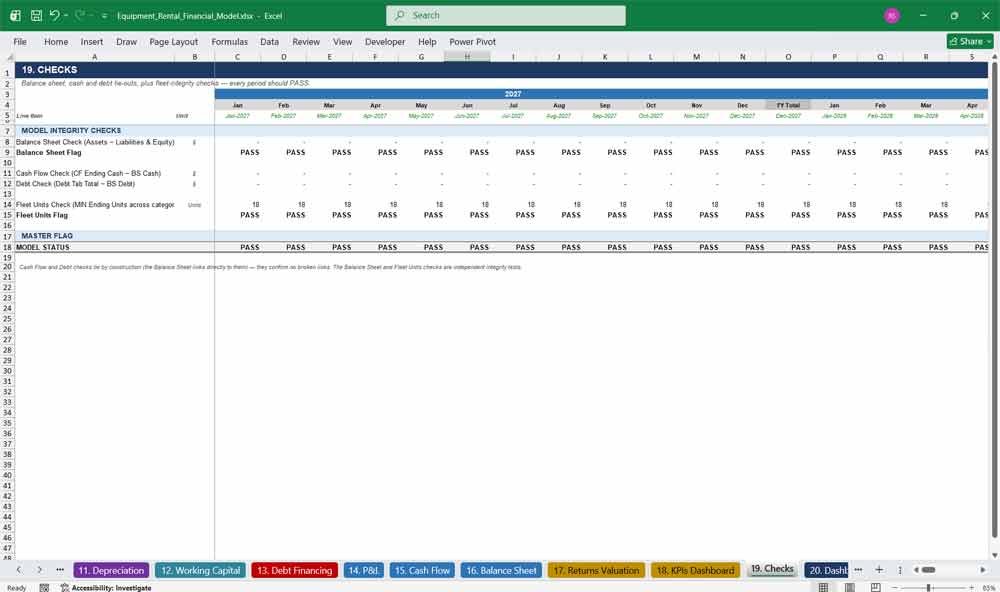
The Checks tab is your built-in quality assurance system, running automated PASS/FAIL tests across the balance sheet, cash flow, and fleet schedules every month. It gives lenders, auditors, and investors immediate confidence that the model’s math is internally consistent and error-free.
Highlights:
- Automated PASS/FAIL flags across all 60 months of the forecast
- Balance sheet integrity check confirms assets equal liabilities plus equity
- Fleet unit and cash flow reconciliation checks built in
- Provides instant credibility for due diligence and lender review
20. Dashboard
The Dashboard delivers an executive-level visual summary of the entire equipment rental business — revenue, EBITDA, fleet growth, and key ratios — through built-in charts and graphs. It’s the single page you’ll present in a board meeting, investor call, or lender presentation.
Highlights:
- Visual charts summarizing revenue, EBITDA, and fleet trends across 2027–2031
- Executive summary view built for board meetings and investor calls
- Pulls automatically from all underlying tabs — no manual updating required
- Rounds out a complete, presentation-ready equipment rental financial model
Why Buy This Model
This Equipment Rental Financial Model isn’t a generic template with placeholder logic bolted together — it’s a genuine fleet-driven forecasting engine built the way real rental operators, lenders, and private equity investors actually think about the business. Every number traces back to a physical driver: how many units you own, how many days they’re rented, and what rate they earn. That means you can change your fleet plan, financing terms, or growth assumptions and trust that revenue, EBITDA, cash flow, and the balance sheet will all move together correctly — because they’re built to. The balance sheet has been stress-tested to tie to exactly zero across every one of the 60 forecast months, all formulas have been fully recalculated and checked for errors, and the model includes an automated Checks tab so you never have to take its integrity on faith. Whether you’re pitching investors, negotiating with an equipment lender, evaluating an acquisition target, or simply building a smarter internal budget, this model saves you weeks of spreadsheet construction and gives you a rigorous, professional-grade starting point you can customize with your own numbers in minutes. For the price of a single hour of a financial analyst’s time, you get a complete, audit-ready, three-statement equipment rental financial model built to institutional standards.
Equipment Rental Frequently Asked Questions (Faq)
Q: What exactly am I getting when I purchase this model?
A: You’ll receive a complete, fully built Excel workbook (.xlsx) containing a 5-year monthly financial forecast for an equipment rental business, organized across 20 color-coded, numbered tabs — from Cover Control through Dashboard. It includes a complete fleet schedule, revenue build, operating cost model, three financial statements (P&L, Cash Flow, Balance Sheet), debt schedule, returns analysis, and KPI dashboard, all pre-populated with realistic, industry-plausible placeholder assumptions you can overwrite with your own numbers.
Q: Do I need advanced Excel skills to use this?
A: No. All inputs are clearly color-coded in blue for easy identification, and everything else is a live formula, so you never have to touch a calculation. Simply update the blue input cells on the Assumptions and Fleet Equipment tabs with your own figures, and the entire model recalculates automatically.
Q: Can I change the start date of the forecast?
A: Yes. The model uses a single “Model Start Date” input on the Assumptions tab. Change that one cell and every month header, year label, and date-based formula across all 20 tabs updates automatically — no manual re-dating required anywhere in the workbook.
Q: What equipment categories are included, and can I customize them?
A: The model comes pre-built with ten equipment categories: excavators, telehandlers, forklifts, scissor lifts, boom lifts, generators, compressors, lighting towers, dumpers, and rollers. Every category has its own fleet roll-forward, utilization, revenue, and depreciation build, and the structure is fully editable if you need to rename, add, or remove categories to match your own fleet mix.
Q: Is the balance sheet actually balanced, or is this just a revenue model with a balance sheet bolted on?
A: The balance sheet has been fully engineered and verified to tie to exactly zero — assets equal liabilities plus equity — in every single one of the 60 forecast months and all five annual totals. This is a genuine three-statement model, not a simplified revenue projection.
Q: How is rental revenue actually calculated?
A: Each equipment category’s monthly rental revenue is built from first principles using the formula: Fleet Units × Available Rental Days × Utilization % × Average Daily Rental Rate. This is the same methodology professional rental operators and private equity firms use to underwrite fleet performance.
Q: Does the model calculate investor returns like IRR and MOIC?
A: Yes. The Returns Valuation tab calculates entry and exit enterprise value using editable EBITDA multiples, bridges to equity value via net debt, and produces a full IRR and MOIC (multiple on invested capital) analysis — ready to drop into an investor presentation or acquisition memo.
Q: What currency and financing structure does the model use?
A: The model is built in USD by default, with an equipment term loan and a working capital facility already modeled, including draws, repayments, and interest expense. Currency symbols, rates, and financing terms are all editable inputs.
Q: Is this suitable for raising capital or presenting to a bank?
A: Yes. The model follows institutional financial modeling conventions — color-coded inputs, formulas and links, a fully reconciled three-statement structure, and a built-in Checks tab with automated PASS/FAIL integrity tests — making it appropriate for investor decks, lender packages, and due diligence.
Q: Can I use this for a business that doesn’t rent construction equipment?
A: While it’s purpose-built for equipment and construction rental businesses, the underlying fleet-driven architecture (units, utilization, rate, depreciation) can be adapted to other rental or asset-heavy businesses with moderate customization of category names and assumptions.
Q: What happens if I change one of the fleet assumptions — will the rest of the model break?
A: No. Every downstream tab — utilization, revenue, capex, depreciation, cash flow, and the balance sheet — is formula-linked back to the Fleet Roll-Forward and Assumptions tabs. Changing a fleet or pricing assumption flows through the entire model automatically and the balance sheet will remain in balance.
Conclusion
This Equipment Rental Company financial model provides a structured approach to managing revenues, expenses, cash flows, and financial stability for an equipment rental company. By tracking financial statements and key metrics, the company can optimize profitability, control costs, and plan for future expansion.
Further Reading
Commercial Vehicle Leasing : The model combines a 24-month historical base (FY2024–FY2025), used for calibration and Actual-vs-Budget analysis, with a 10-year forecast (Year 1 / 2026 through Year 10 / 2035).
- Construction Plant Hire Model: Track specialised funding that is frequently used for construction plant hire companies and their subsequent infrastructure.