
Commercial Vehicle Leasing Financial Model
This 10-Year Commercial Vehicle Leasing Financial Model in Excel coverers trucks, vans, and trailers, built entirely in Excel with monthly granularity across a 12-year horizon (144 months, January 2024 – December 2035).
The model combines a 24-month historical base (FY2024–FY2025), used for calibration and Actual-vs-Budget analysis, with a 10-year forecast (Year 1 / 2026 through Year 10 / 2035). Every schedule — from individual lease contracts through to the balance sheet — runs on the same monthly timeline, so the business can be analysed at whatever level of granularity is useful: month, year, or full ten-year view.
10-Year Vehicle Leasing Financial Model
The fleet is represented through 15 representative contract cohorts spanning trucks, vans, and trailers, each with its own start date, term, unit count, purchase price, and rental rate. From these cohorts, the model builds up depreciation, lease income, debt funding, operating costs, and ultimately a full three-statement output (P&L, Balance Sheet, Cash Flow) — with the balance sheet balancing to the cent in every single month of the 144-month run.
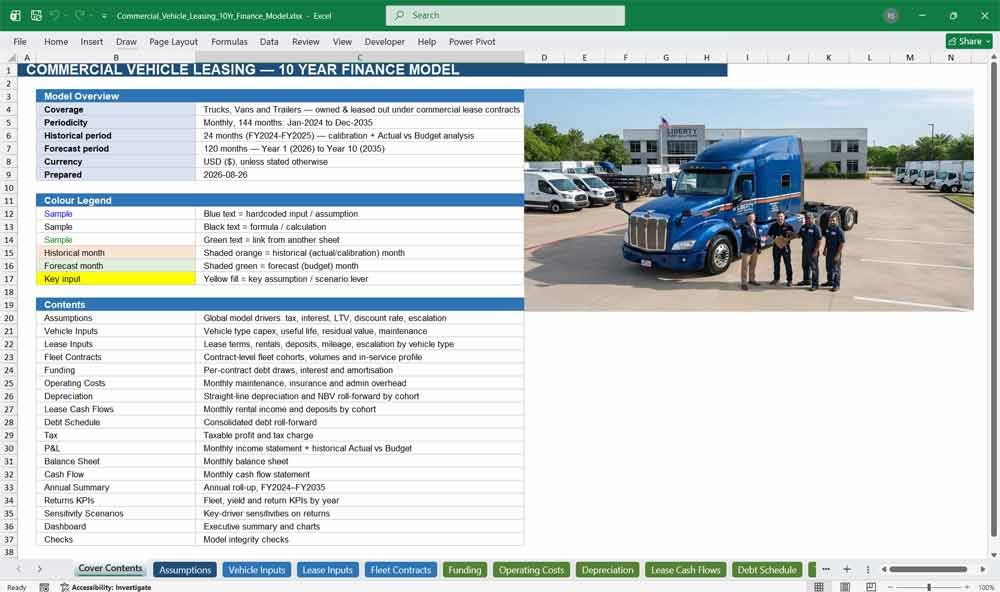
Cover Contents
The landing page of the model. It sets out the model’s scope and periodicity, explains the colour-coding convention used throughout (inputs, formulas, links, historical vs. forecast shading), and provides a clickable-style contents list summarising what each tab covers.
- Quick-reference colour legend for inputs, formulas, and cross-sheet links#
- Explanation of historical vs. forecast shading
- One-line description of every other tab in the model
Assumptions
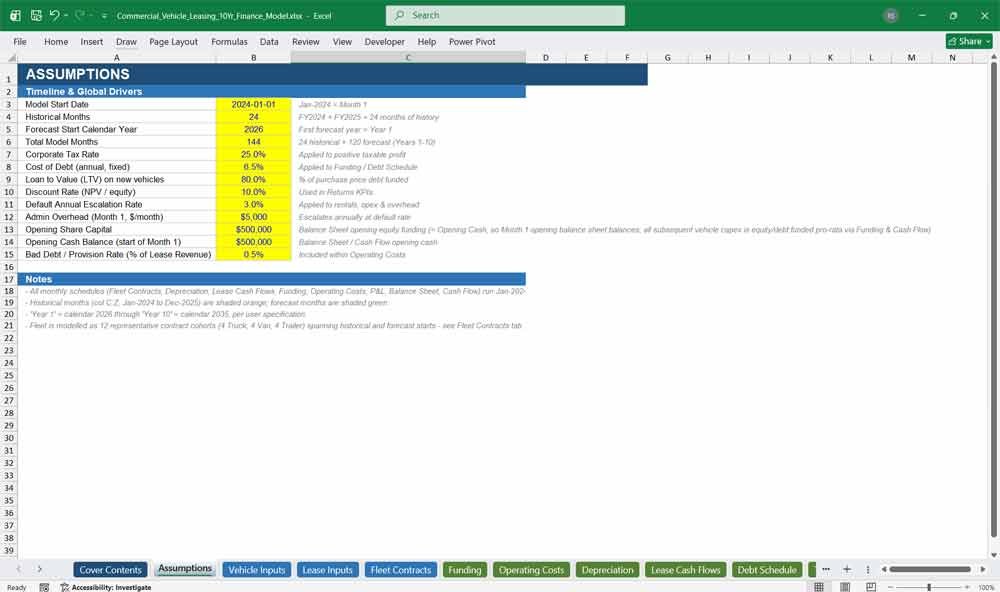
The control panel for the entire model. All of the global drivers that flow through every other tab live here, so scenario changes only need to be made in one place.
- Model timeline anchors: start date, historical month count, forecast start year
- Corporate tax rate, cost of debt, and loan-to-value (LTV) ratio on new vehicles
- Discount rate used for NPV/IRR calculations
- Default annual escalation rate applied to rentals, opex, and overhead
- Opening cash and share capital balances
Vehicle Inputs
Defines the physical and economic characteristics of each vehicle type used throughout the model.
- Purchase price, useful life, and residual value by vehicle type (Truck / Van / Trailer)
- Monthly maintenance, insurance, and tyres/other cost assumptions per unit
- Feeds directly into Depreciation and Operating Costs
Lease Inputs
Defines the commercial terms under which vehicles are leased out to customers.
- Standard lease term, base monthly rental, and deposit percentage by vehicle type
- Annual mileage allowance and excess mileage charges
- Payment frequency and contractual escalation rate
- Feeds directly into Lease Cash Flows and Fleet Contracts
Commercial Vehicle Leasing Model Inputs
Fleet Contracts
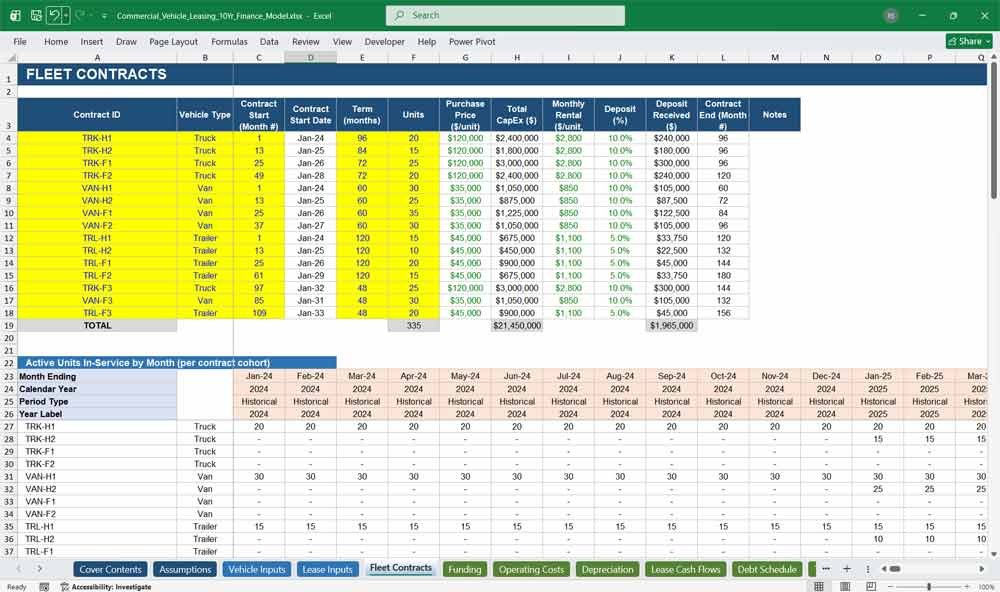
The operational heart of the model — where individual contract cohorts are defined and rolled forward month by month.
- 15 contract cohorts (4+ each of Truck, Van, and Trailer) with individual start dates, terms, and unit volumes
- Automatically calculated total CapEx, monthly rental, and deposit received per cohort
- Monthly “active units in service” grid per cohort and by vehicle type
- Monthly new-vehicle CapEx schedule, used to trigger depreciation and debt draws elsewhere in the model
Funding
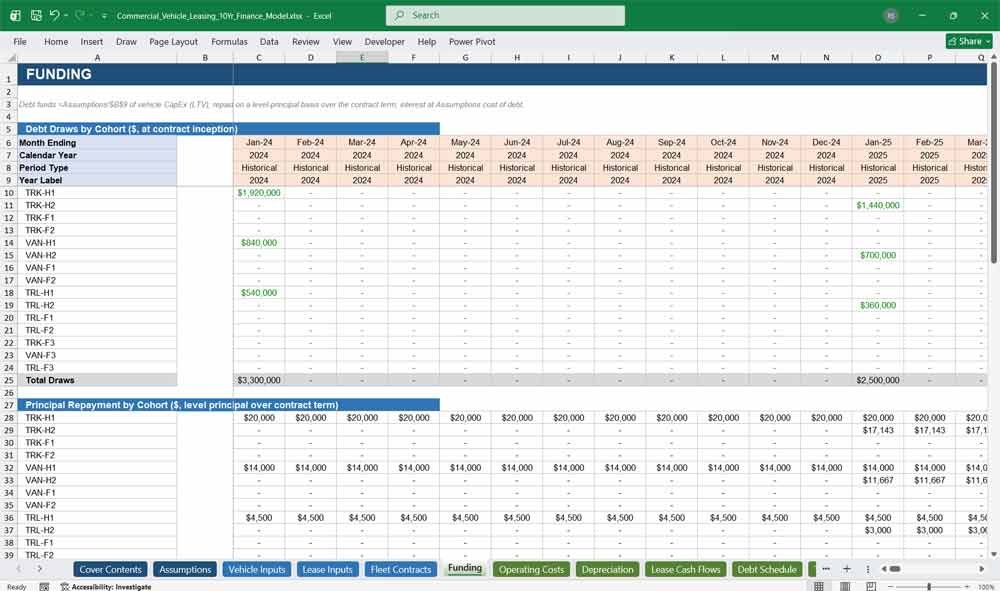
Models the debt facility drawn against each individual contract cohort.
- Debt draws sized at the LTV assumption against each cohort’s CapEx, drawn at contract inception
- Level-principal amortisation over each cohort’s contract term
- Per-cohort interest charge, calculated on the declining balance
- Cohort-level closing balances that roll up into the consolidated Debt Schedule
Operating Costs
Aggregates the day-to-day cost of running the fleet.
- Maintenance, insurance, and tyres/other costs by vehicle type, driven by active fleet volumes
- Annual escalation applied automatically to all cost lines
- Admin overhead and a bad-debt provision (as a percentage of lease revenue)
Depreciation
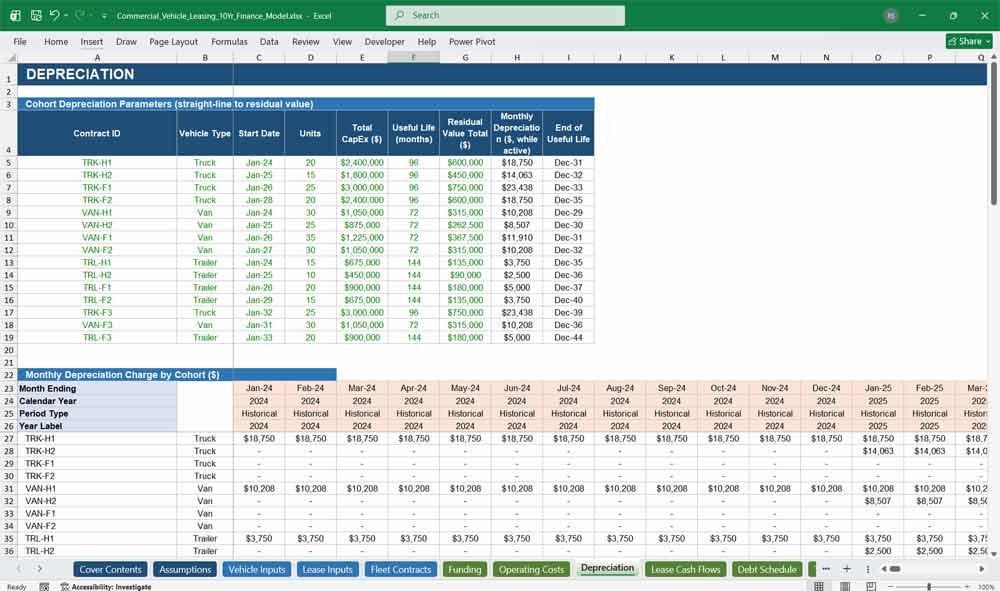
Runs a straight-line depreciation schedule for every cohort, independent of lease term, so vehicles continue depreciating over their full useful economic life.
- Cohort-level depreciation parameters (CapEx, useful life, residual value, monthly charge)
- Monthly depreciation charge by cohort and in total
- Full net book value (NBV) roll-forward by cohort, feeding the Balance Sheet’s fixed asset line
Leasing Cash Mechanics
Lease Cash Flows
Calculates the rental income the business earns from its leased-out fleet.
- Monthly rental income by cohort, automatically escalated each anniversary per the Lease Inputs assumptions
- Deposits received at contract inception, by cohort
- Total lease cash inflows (rental + deposits), feeding the P&L and Cash Flow
Debt Schedule
Consolidates the cohort-level facilities from the Funding tab into a single company-wide debt position.
- Opening balance, new draws, principal repayments, and closing balance each month
- Consolidated interest charge, feeding directly into the P&L
Commercial Vehicle Leasing Tax
A transparent tax calculation sitting between the P&L’s operating result and its bottom line.
- Profit before tax pulled directly from the P&L
- Taxable profit floored at zero (no tax benefit recognised on losses)
- Tax charge calculated at the Assumptions tax rate
Vehicle Leasing 3 Statement Model
Income Statement (P&L)
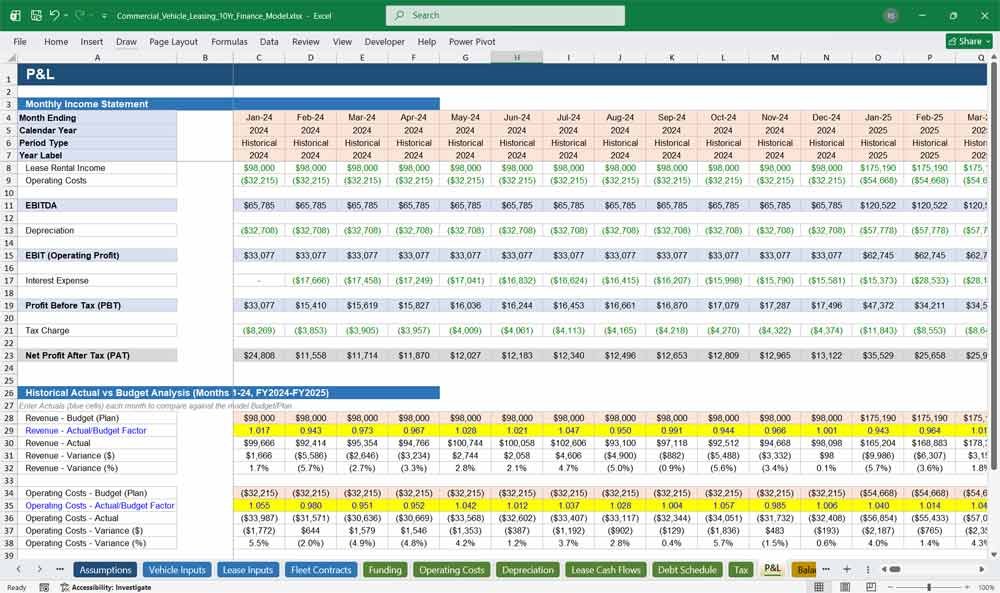
The monthly income statement, built entirely from the upstream schedules, plus a dedicated historical variance analysis. Revenue, operating costs, EBITDA, depreciation, EBIT, interest, PBT, tax, and net profit (PAT)
A Historical Actual vs. Budget section covering the 24 historical months, with an editable variance-factor input so real actuals can be compared against the model’s budgeted plan
Variance shown in both dollar and percentage terms
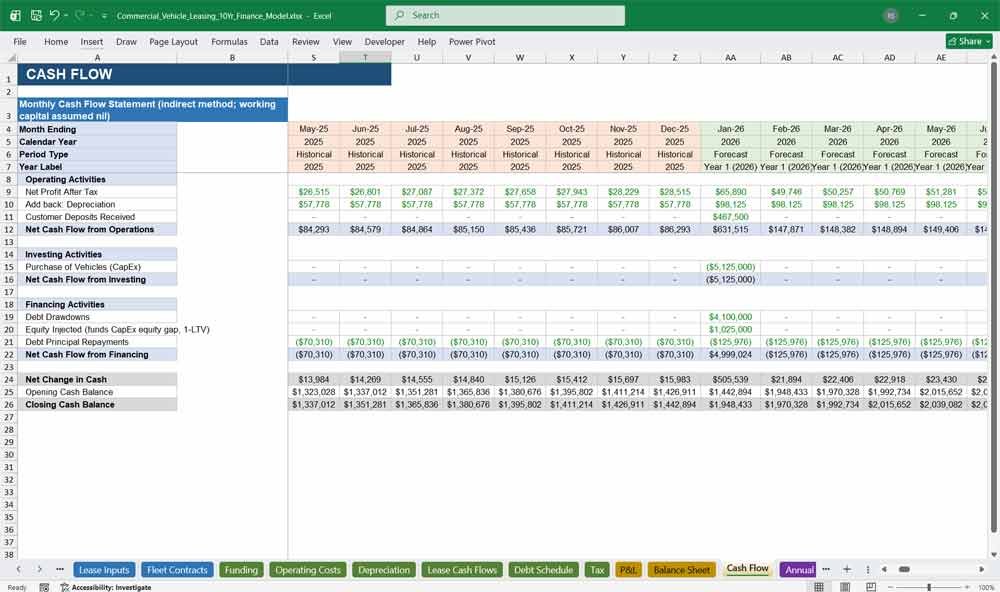
Cash Flow
The monthly cash flow statement, reconciling profit to the movement in cash.
Operating activities: net profit, depreciation add-back, and customer deposits received, investing activities in vehicle CapEx, Financing activities with debt drawdowns, matching equity injections, and principal repayments, Opening and closing cash balances, tying directly to the Balance Sheet.
Balance Sheet
The monthly financial position of the business, built up entirely from the other schedules.
- Assets: cash and vehicles at net book value
- Liabilities: consolidated debt and customer deposits held
- Equity: share capital (opening balance plus ongoing equity injections) and retained earnings
A built-in balance check confirming assets equal liabilities plus equity — verified at $0 in every one of the 144 months
Cash Flow
The monthly cash flow statement, reconciling profit to the movement in cash.
- Operating activities: net profit, depreciation add-back, and customer deposits received
- Investing activities: vehicle CapEx
- Financing activities: debt drawdowns, matching equity injections, and principal repayments
Opening and closing cash balances, tying directly to the Balance Sheet
Commercial Leasing KPI’s
Annual Summary
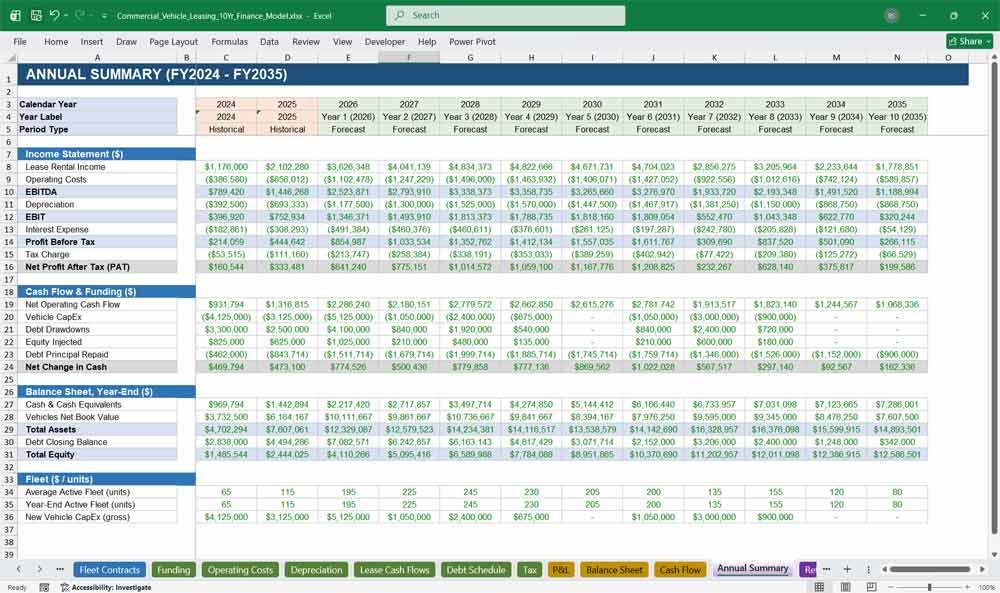
Rolls the entire monthly model up into an annual view across all 12 years — FY2024 and FY2025 as historical years, and Year 1 (2026) through Year 10 (2035) as the forecast.
- Full annual income statement (revenue through PAT)
- Annual cash flow and funding summary (CapEx, debt draws, equity injected, principal repaid)
- Year-end balance sheet snapshot (cash, NBV, total assets, debt, equity)
- Average and year-end active fleet size by year
Returns KPIs
Translates the annual results into the return and credit metrics used to assess the business’s performance.
- EBITDA margin, net margin, return on assets, and return on equity by year
- Debt/equity ratio and interest cover
- Revenue per average fleet unit and fleet size trends
- An illustrative equity cash flow, IRR, and NPV calculation based on annual equity injections and terminal book value
Sensitivity Scenarios
A dedicated what-if tab for stress-testing the model’s key drivers without needing to touch the Assumptions tab directly.
- Three preset scenarios (Downside, Base Case, Upside) covering interest rate, residual value, fleet volume, and escalation shocks
- A dropdown selector to switch between scenarios
- A simplified, formula-driven 10-year impact table comparing Base Case to the selected scenario across revenue, interest, PAT, CapEx, and equity IRR
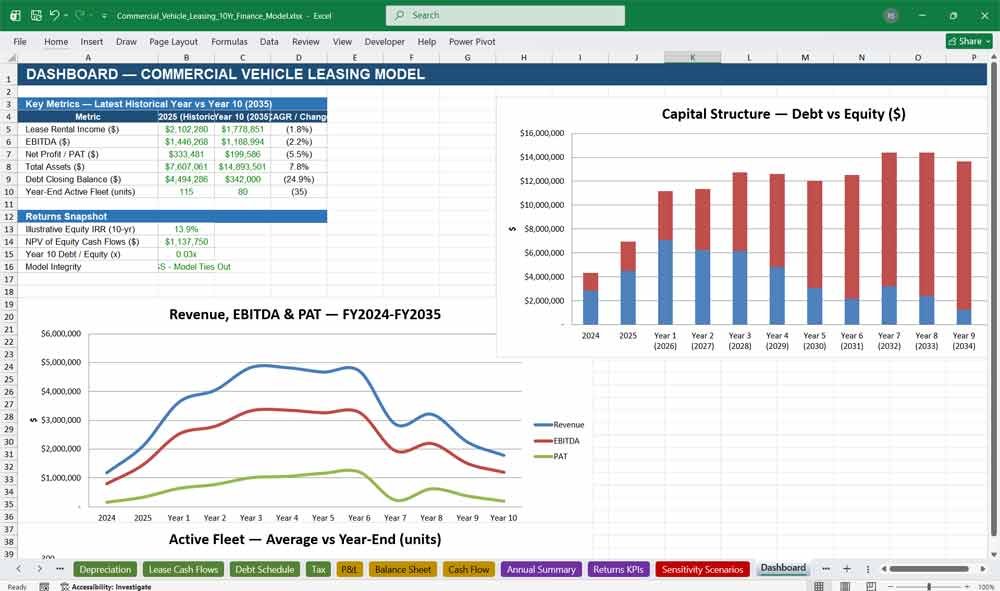
Dashboard
An executive summary view of the model, designed for a quick read of overall performance.
Headline metrics comparing the latest historical year (FY2025) to Year 10 (2035), including CAGR
Equity IRR, NPV, and year-10 leverage snapshot.
A live model-integrity flag pulled from the Checks tab. Charts Revenue/EBITDA/PAT trend, average vs. year-end fleet size, and debt vs. equity capital structure over time
Checks
The model’s built-in audit trail, confirming that everything ties together correctly across all 144 months.
Balance sheet check (assets equal liabilities plus equity), Cash roll-forward check (Balance Sheet cash matches Cash Flow closing cash), Fixed asset roll-forward check (CapEx less cumulative depreciation equals NBV), Debt roll-forward check (cumulative draws less principal equals closing balance), Fleet and funding consolidation checks (cohort-level detail sums to reported totals).
A single master “Pass/Fail” flag summarising all six checks
Further Reading
Equipment Rental Company: Download a comprehensive editable, MS Excel spreadsheet for tracking equipment leasing company finances.
- Construction Plant Hire Model: Track specialised funding that is frequently used for construction plant hire companies and their subsequent infrastructure.