
15 Year Data Centre Financial Model Template
Financial Model for a 15 Year Data Centre
The model is structured around a realistic data center development timeline: a multi-year, phased construction period modeled monthly, followed by a fifteen-year operating forecast — monthly for the first five years to capture the lease-up ramp in detail, then annually for the remaining ten years once the asset stabilizes. A built-in Base / Upside / Downside scenario selector flows through every assumption — power pricing, utilization, capex, leverage — so you can stress-test a deal in seconds instead of rebuilding it. Every tab is fully formula-driven and cross-linked, from MW capacity and PUE through customer cohort ramp-up, debt service, and the three financial statements, so the entire data center capacity and financial model recalculates instantly when you change a single input.
Where this model earns its keep is in the outputs decision-makers actually need: Project IRR, Equity IRR, MOIC, NPV, and an exit valuation built on an EV/EBITDA multiple, alongside a full data center capex model, debt schedule, and depreciation schedule. A dedicated Checks tab continuously verifies that the balance sheet balances, cash reconciles, and debt amortizes correctly — so you can trust the numbers you’re presenting to investment committees, lenders, or acquisition targets. If you’re searching for a data center valuation model, a colocation revenue model, or a data center development budget template that goes beyond a simple back-of-envelope calculator, this is the model built for that job.
Why Buy This Model
Building this data center financial model from scratch — a fully phased construction budget, a cohort-based lease-up engine, a construction-to-term debt schedule, three linked financial statements, and a live Base/Upside/Downside scenario toggle — is easily weeks of analyst time, even before you get to the returns and sensitivity work investment committees actually ask for.
Buying a ready-built, audit-ready data center Excel model instead means you’re underwriting a deal in hours, not weeks, with every assumption clearly labeled, every formula fully transparent, and a dedicated Checks tab proving the balance sheet, cash, and debt schedule all tie out before you ever present the numbers. It’s built for the way real data center deals get evaluated — construction risk, lease-up risk, leverage, and exit value all in one place — so whether you’re a developer sizing a build, an investor underwriting an acquisition, a lender stress-testing coverage, or an analyst who needs a credible model fast, you’re starting from a professional-grade foundation instead of a blank spreadsheet.
Data Center Model Tab by Tab Guide
1. Cover Dashboard
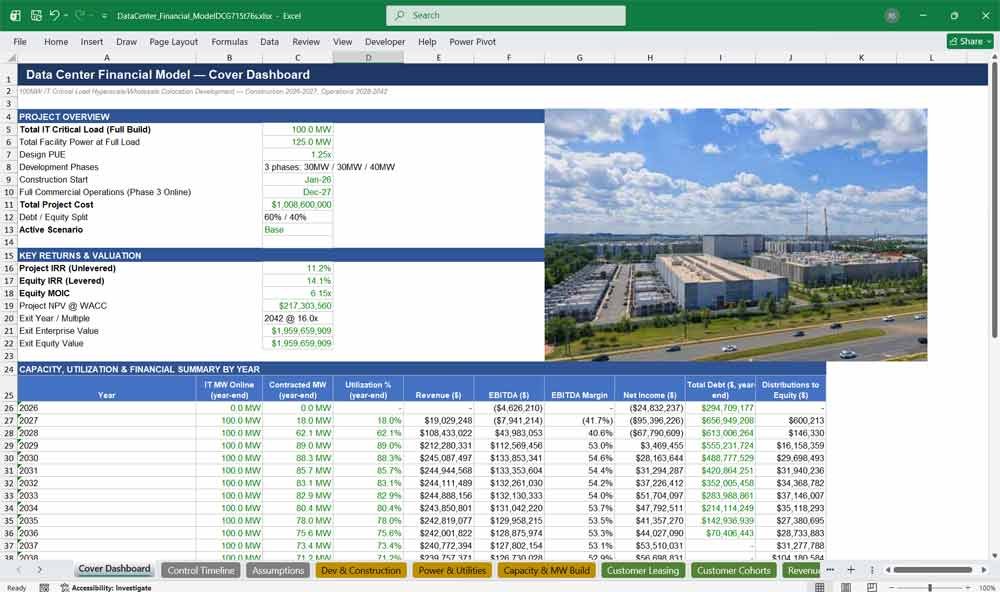
The Cover Dashboard is the executive summary of this data center financial model, showing capacity, utilization, revenue, EBITDA, IRR, MOIC, NPV, and exit valuation in one linked view, the fastest way for investors and lenders to size up the opportunity.
- Key project metrics: total IT critical load (MW), total facility power, PUE, and total project cost in one snapshot
- Headline data center investment returns: Project IRR, Equity IRR, Equity MOIC, and NPV at a glance
- Exit valuation summary, including exit year, EV/EBITDA multiple, and exit equity value
- Year-by-year capacity, utilization, revenue, EBITDA, and debt summary table (2026–2042)
- Built-in charts visualizing revenue/EBITDA growth and MW build-out vs. contracted capacity over time
2. Control Timeline
Control Timeline is the master date engine driving every tab in this data center Excel model, combining monthly and annual periods with a live Base, Upside, and Downside scenario selector that instantly recalculates the entire workbook for any deal scenario.
- Single source of truth for all 94 modeling periods — no risk of dates drifting out of sync across tabs
- Monthly granularity through construction and the first five years of operations, then annual thereafter
- One-click Base / Upside / Downside scenario toggle that recalculates the full model
- Construction vs. operations phase flags used throughout the workbook for conditional logic
Data Centre Power Buildout
3. Assumptions
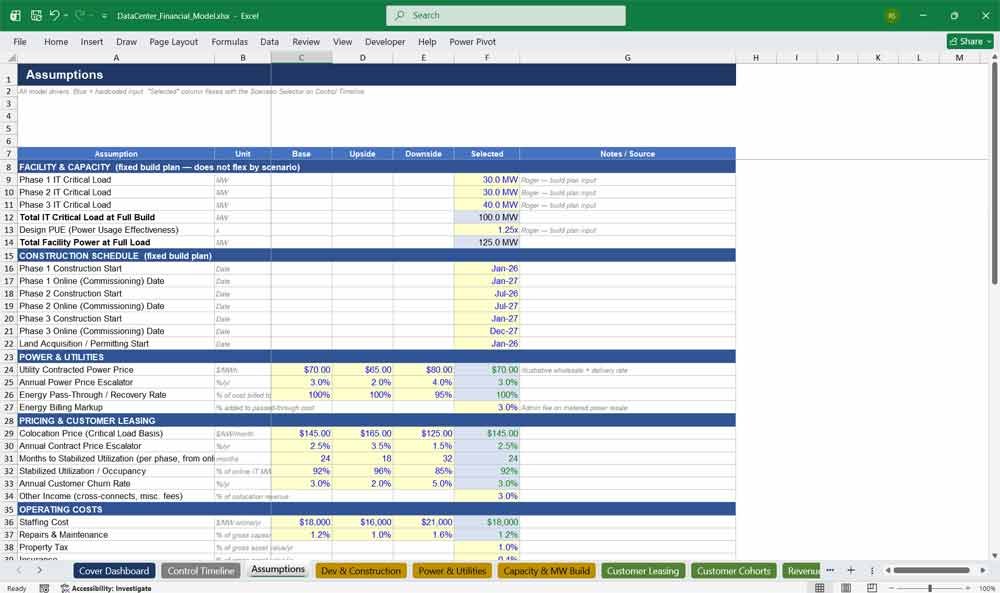
Assumptions centralizes every driver behind this data center pro forma model, power, pricing, utilization, capex, opex, taxes, and financing, all in one editable, clearly labeled block, with Base, Upside, and Downside inputs feeding a single Selected column used everywhere else.
- Base / Upside / Downside inputs for every key driver, feeding a single “Selected” column used everywhere else
- Full data center capex assumptions: land, shell & core, electrical, mechanical, fit-out, and IT infrastructure cost per MW
- Power, pricing, and colocation escalator assumptions driving the entire revenue build
- Financing assumptions — leverage, interest rates, amortization tenor, DSCR covenant, and tax rate — in one editable block
4. Development & Construction
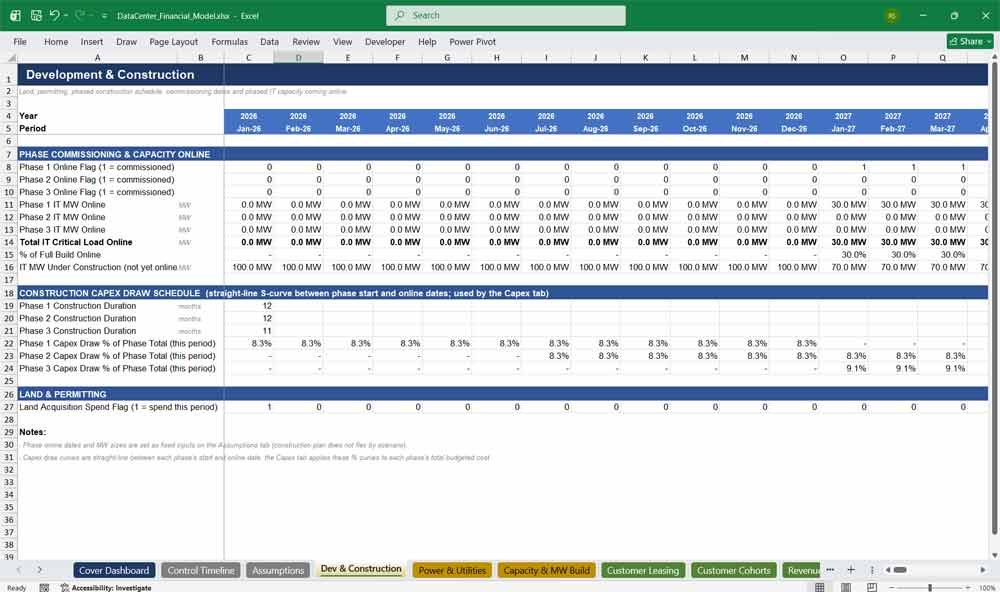
Development and Construction turns a phased data center build-out plan into a working construction schedule and capex draw curve, tracking land acquisition, permitting, and commissioning dates for each phase and converting them automatically into monthly capital draw percentages for lenders.
- Phase-by-phase construction schedule and commissioning (online) dates for a multi-phase MW build-out
- Automatic phased IT capacity coming online, feeding capacity, revenue, and depreciation tabs
- Straight-line capex draw curves by phase, ready to size construction loan draws
- Land acquisition and permitting cost timing captured separately from phased construction capex
5. Power & Utilities
Power and Utilities models the energy backbone of this data center financial model, PUE-driven power draw, utility procurement cost, and customer energy pass-through revenue, turning raw megawatt figures into real electricity cost and full recovery cash flow every single period.
- PUE-driven facility power draw calculated from actual utilized IT load, not just nameplate capacity
- Full energy consumption (MWh) build using actual hours per period
- Utility power cost and customer energy pass-through / recovery revenue modeled side by side
- Configurable energy recovery rate and billing markup to reflect real-world colocation contracts
6. Capacity & MW Build
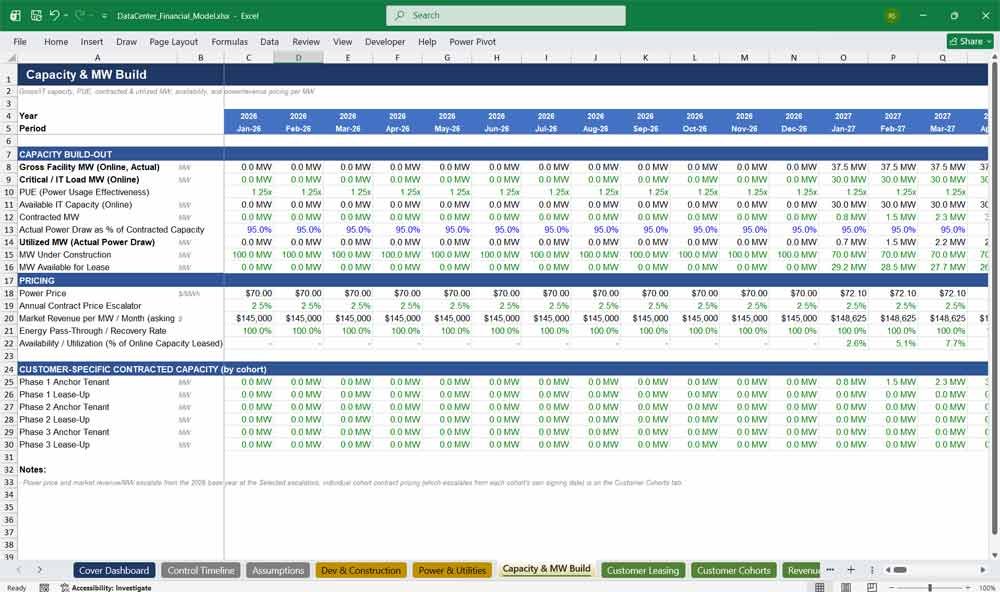
Capacity and MW Build is the operational heart of this data center capacity model, tracking gross facility power, contracted and utilized megawatts, capacity available for lease, power pricing, and revenue per MW, the core KPI sheet every operator recognizes instantly.
- Gross facility MW, critical/IT load MW, PUE, and available IT capacity in one build
- Contracted MW, utilized MW, MW under construction, and MW available for lease, period by period
- Customer-specific contracted capacity broken out by leasing cohort
- Power price ($/MWh), revenue per MW/month, annual escalators, and energy pass-through/recovery rate
Data Centre Revenue & Cohorts
7. Customer Leasing
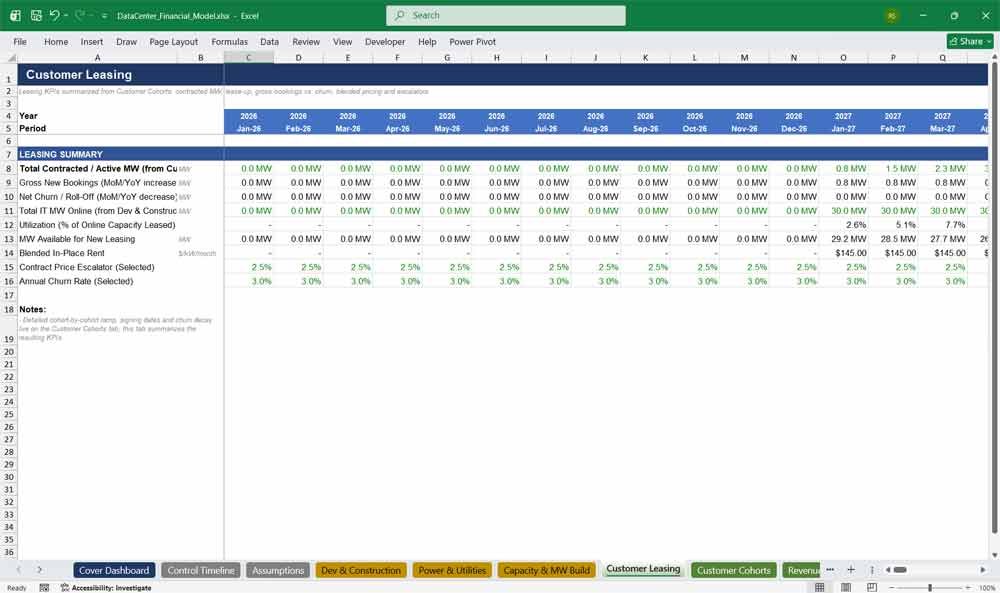
Customer Leasing summarizes the commercial engine of this colocation revenue model, contracted MW, lease-up pace, gross bookings versus churn, utilization, and blended in-place rent, answering exactly how fast a data center fills up and stays leased over the long term.
- Total contracted / active MW, rolled up from the underlying leasing cohorts
- Gross new bookings vs. churn / roll-off, period by period
- Utilization as a percentage of online capacity, plus MW still available to lease
- Blended in-place rent ($/kW/month) and the active contract escalator and churn rate
8. Customer Cohorts
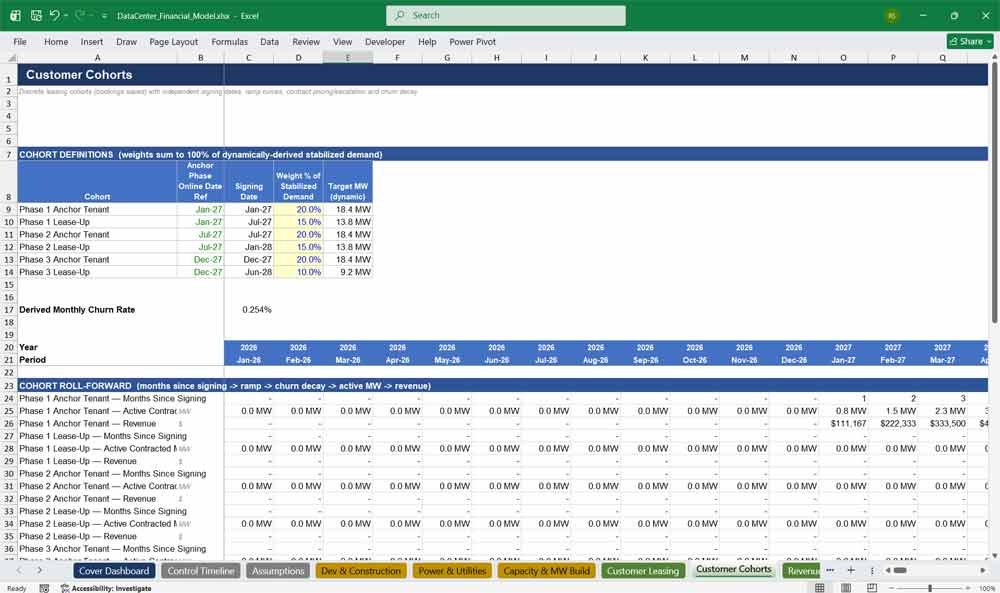
Customer Cohorts is the detailed lease-up engine beneath Customer Leasing, tracking each booking wave independently from signing date through ramp-up, annual escalation, and long-term churn decay, so contracted megawatts and revenue erode realistically across a full fifteen-year operating hold period.
- Independent leasing cohorts (anchor tenants and lease-up waves) tied to each construction phase’s online date
- Realistic ramp-up curves from signing date to full contracted MW
- Contract pricing that escalates on its own signing anniversary, not a single blanket date
- Long-term churn decay modeled monthly, so cohort MW and revenue erode realistically over a 15-year hold
9. Revenue Build
Revenue Build consolidates every income stream into the top line of this data center P&L, colocation and wholesale revenue, energy pass-through, and other income, keeping the mix fully transparent for every single calculation happening downstream in this entire financial model.
- Colocation / hyperscale / wholesale revenue rolled up from the customer cohort engine
- Energy pass-through and recovery revenue linked directly from the Power & Utilities tab
- Other income (cross-connects, ancillary fees) modeled as a percentage of colocation revenue
- One clean, fully-linked total revenue line feeding the P&L, cash flow, and returns tabs
10. Operating Costs
Operating Costs builds the full data center opex model line by line, power, staffing, maintenance, network, property tax, insurance, and G&A, so operating margin is one real, fully auditable calculation rather than a single hidden black-box assumption buried in formulas.
- Utility power cost linked directly from the Power & Utilities tab
- Staffing and network/connectivity costs scaled by MW online and escalated annually
- Maintenance, property tax, and insurance costs scaled off the growing gross asset base
- G&A modeled as a percentage of revenue, keeping corporate overhead tied to scale
11. Capex
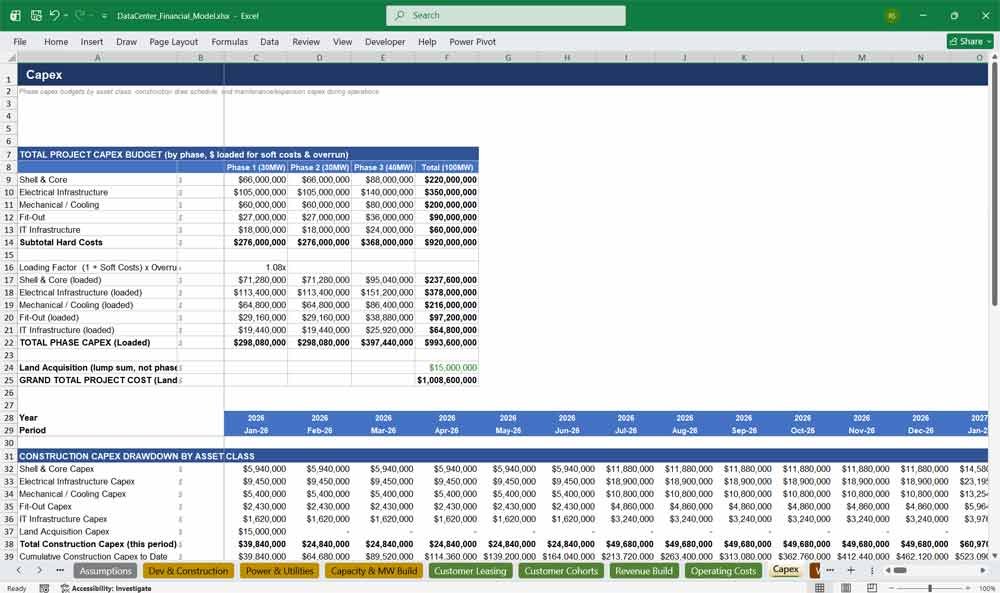
Capex is the complete data center capex model, phase-by-phase construction budgets broken into asset classes, soft cost and contingency loading, a configurable overrun factor, and ongoing maintenance capital, all feeding the debt schedule and fixed assets tabs automatically every period.
- Detailed hard-cost budget by category — shell & core, electrical, mechanical, fit-out, and IT infrastructure — for every phase
- Soft cost and contingency loading applied automatically, plus a configurable capex overrun factor
- Monthly construction capex drawdown by asset class, feeding both the debt schedule and fixed assets
- Ongoing maintenance capex modeled as a percentage of revenue once the asset is operating
Data Centre Capex – Capital -Assets
12. Working Capital
Working Capital models accounts receivable, accounts payable, and customer security deposits, the real cash-timing dynamics many simpler data center models skip entirely, using configurable DSO and DPO day counts that flow directly into the full cash flow statement each period.
- Accounts receivable and accounts payable driven by configurable DSO/DPO day counts
- Customer security deposits modeled as a real balance-sheet liability tied to contracted MW and in-place rent
- Prepaid operating expenses captured alongside AR/AP for a complete working capital picture
- Net working capital and period-over-period change feeding directly into the cash flow statement
13. Fixed Assets & Depreciation
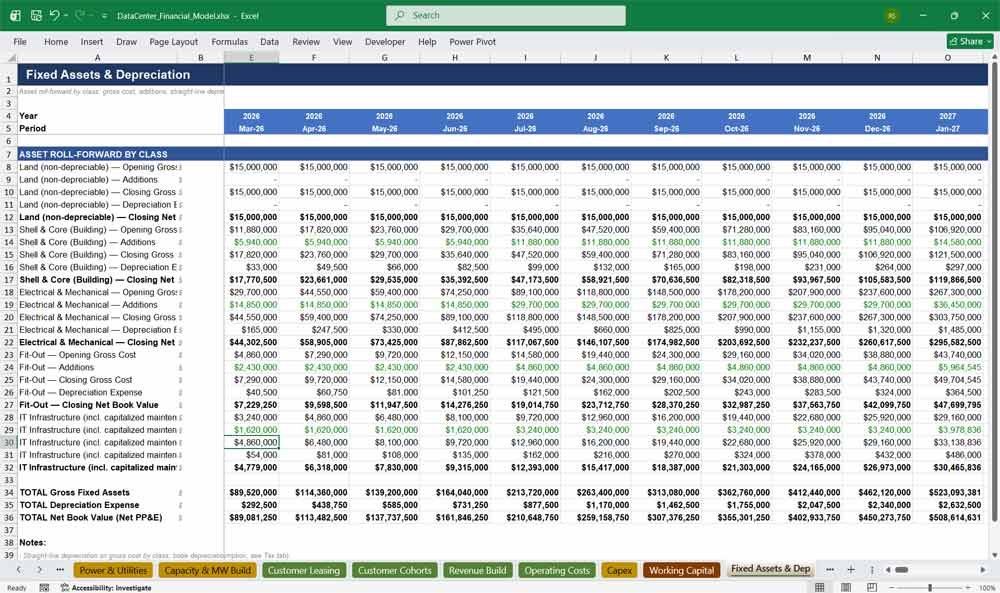
Fixed Assets and Depreciation rolls forward the entire data center asset base by class, land, shell and core, electrical, mechanical, fit-out, and IT infrastructure, using straight-line depreciation and fully configurable useful lives all the way through to final exit valuation.
- Asset roll-forward by class: opening balance, additions, depreciation, and closing net book value
- Straight-line depreciation using configurable useful lives for each asset category
- Depreciation automatically capped so no asset class depreciates below zero
- Feeds directly into the P&L, tax schedule, and balance sheet without manual reconciliation
14. Debt Schedule
Debt Schedule models real-world data center project finance mechanics, a construction loan with capitalized interest converting to a term loan at commercial operations, complete with mandatory amortization, a fully configurable cash sweep, and a built-in, period-by-period DSCR calculation for lenders.
- Construction loan draws tied directly to the capex schedule, with interest capitalized (non-cash) during the build
- Automatic conversion to a term loan at commercial operations, sized off the actual construction loan balance
- Straight-line mandatory amortization plus a configurable cash sweep from excess cash flow
- Built-in DSCR calculation every period, so coverage risk during lease-up is visible, not hidden
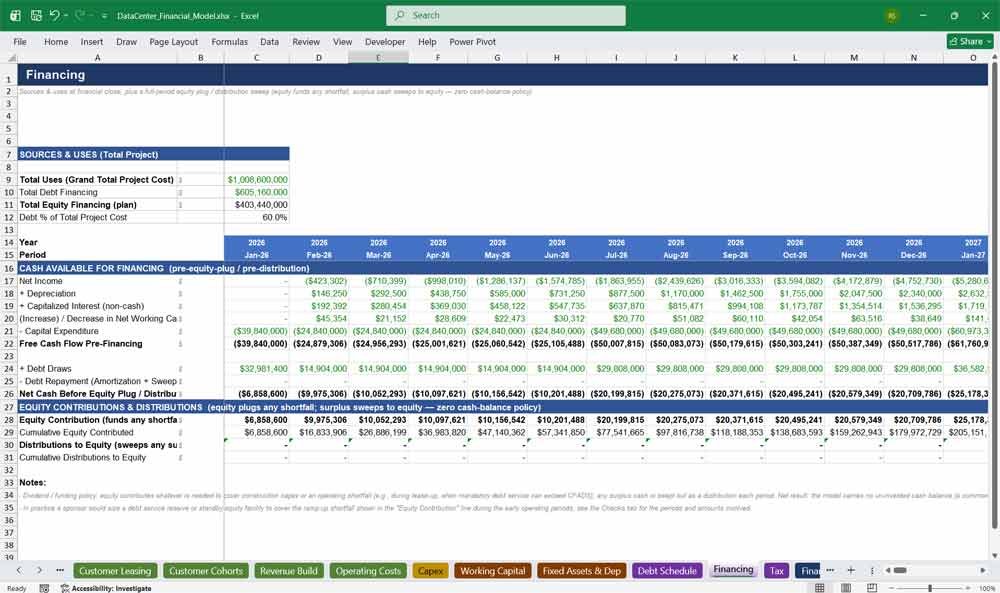
15. Financing
Financing ties the capital stack together, sources and uses at financial close, equity contributions that automatically fund any shortfall, and a distribution sweep returning surplus cash flow to equity, keeping this entire data center financial model’s cash flow fully honest.
- Clear sources & uses summary: total project cost, debt financing, and equity financing at close
- Equity contributions that automatically fund any shortfall, including during the lease-up ramp
- Distribution sweep that returns 100% of surplus cash flow to equity once debt service is covered
- Fully transparent policy notes explaining the funding logic behind every draw and distribution
16. Tax
Tax calculates taxable income, tracks net operating loss carryforwards, and derives cash taxes owed from EBITDA, depreciation, and interest expense, the layer that turns operating profit into a realistic, fully cash-based tax line for the income statement every single period.
- Full taxable income build from EBITDA, depreciation, and interest expense
- NOL carryforward roll-forward, so early development losses properly offset future taxable income
- Configurable corporate tax rate driving cash tax expense every period
- Clean separation from the debt schedule’s simplified sweep-sizing tax proxy, avoiding circular formulas
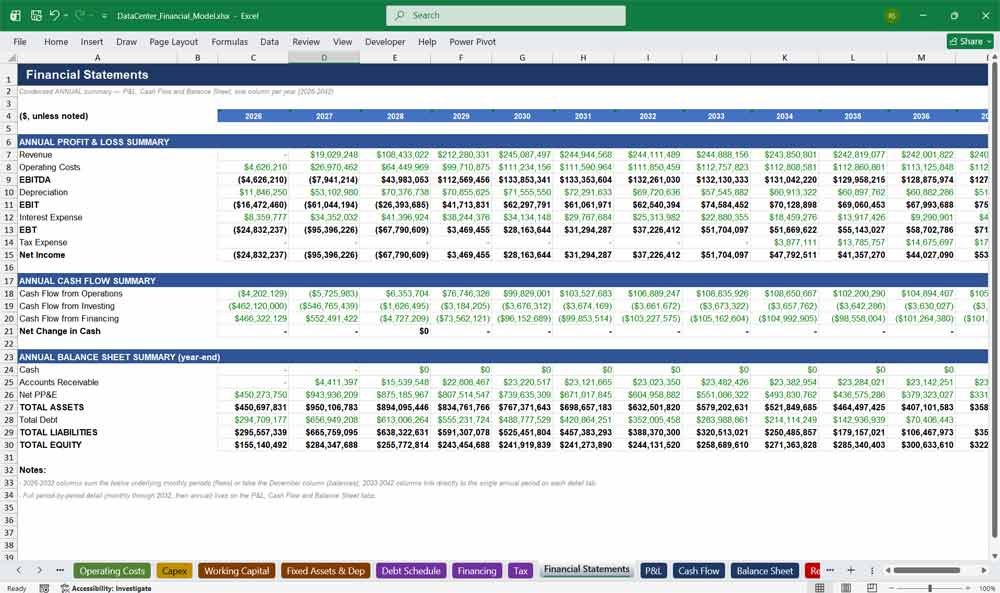
17. Financial Statements
Financial Statements is the at-a-glance annual three-statement summary of this data center financial model, P&L, cash flow, and balance sheet side by side by year, ideal for board decks, lender packages, and quick annual trend review across the full hold.
- Condensed annual P&L, cash flow, and balance sheet from 2026 through 2042 in one place
- Automatically aggregates monthly detail into annual totals during the construction and ramp-up years
- Every figure links live to the detailed monthly/annual tabs — nothing is re-keyed
- Ideal for board decks, lender packages, and quick annual trend review
18. P&L
P&L is the fully linked income statement at the heart of the model, revenue through net income, recalculating instantly with every single assumption change across the full construction-to-exit timeline of this complete data center financial model and long-term operating forecast.
- Complete income statement: revenue, opex, EBITDA, depreciation, EBIT, interest, tax, and net income
- Every line sourced from its dedicated build tab, so nothing is a manual override
- EBITDA and EBIT margins visible period by period for quick profitability tracking
- Feeds directly into cash flow, tax, and returns calculations
19. Cash Flow
Cash Flow reconciles operating, investing, and financing activity into the cash position of the business, the mechanical proof that this data center financial model’s assumptions truly translate into real, fully balanced cash movement in every single modeled period, without exception.
- Full CFO / CFI / CFF build, including non-cash addbacks for depreciation and capitalized interest
- Capital expenditure and working capital changes flow through automatically from their source tabs
- Debt draws, repayments, equity contributions, and distributions all captured in financing activities
- Opening and closing cash roll-forward every period, ready for balance sheet reconciliation
20. Balance Sheet
Balance Sheet is the model’s self-checking anchor, assets, liabilities, and equity fully linked and built to balance to the dollar in every single period, from day one of construction straight through stabilized operations and ultimate exit valuation, with no plugs.
- Complete balance sheet: cash, receivables, prepaids, and net PP&E on the asset side
- Payables, customer deposits, and total debt on the liabilities side
- Paid-in capital and retained earnings roll-forward on the equity side
- Built-in balance check confirming assets equal liabilities plus equity every period
Value Your Data Centre With Valuation Scenarios
21. Returns & Valuation
Returns and Valuation is where this data center investment model earns its name, Project IRR, Equity IRR, MOIC, NPV, and a full exit valuation calculated on actual dates so shifting monthly-to-annual periodicity never distorts a single reported return metric shown.
- Unlevered Project IRR and levered Equity IRR, calculated with XIRR against real period-end dates
- Equity MOIC and Project NPV at the model’s discount rate / WACC
- Exit valuation built on a configurable EV/EBITDA multiple, net of any remaining debt at exit
- Full unlevered and levered cash flow build supporting every return metric shown
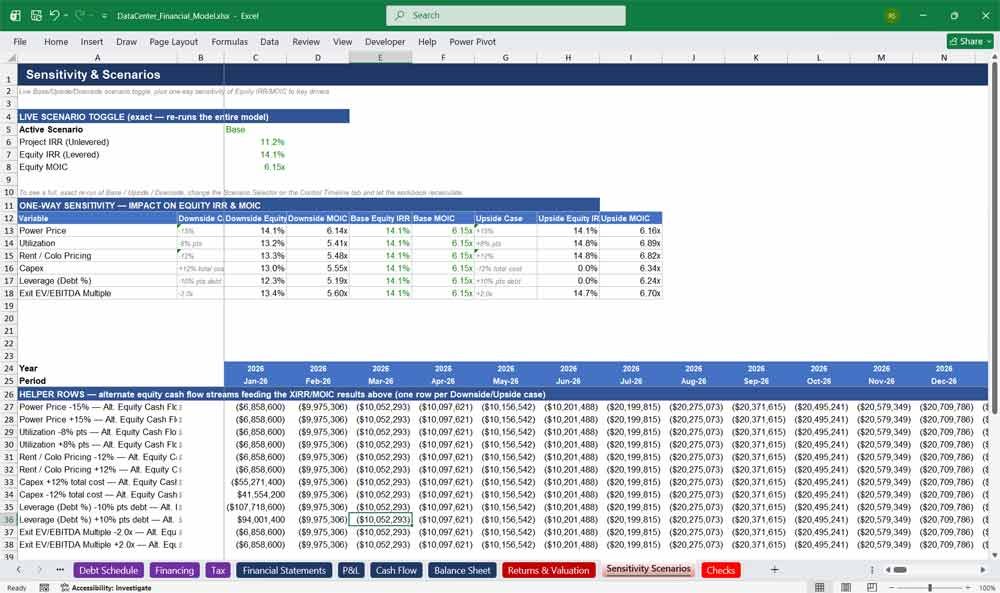
22. Sensitivity & Scenarios
Sensitivity and Scenarios stress-tests the deal from every angle, a live Base, Upside, and Downside toggle plus one-way sensitivity tables on power price, utilization, rent, capex, leverage, and exit multiple, the variables that move data center returns the very most.
- Live scenario toggle that re-runs the entire model exactly, not an approximation
- One-way sensitivity of Equity IRR and MOIC to power price, utilization, rent/pricing, capex, and leverage
- Exact exit-multiple sensitivity table showing the direct valuation impact of cap rate/multiple assumptions
- Clear methodology notes so every approximation is disclosed, not hidden
23. Checks
Checks is the quality-control layer making this a genuinely trustworthy data center financial model rather than just a spreadsheet full of formulas, continuously validating the balance sheet, cash, debt, capacity, and DSCR logic with one overall pass/fail status flag shown.
- Balance sheet check confirming assets equal liabilities plus equity in every period, with zero tolerance drift
- Cash reconciliation check between the cash flow statement and balance sheet
- Debt checks confirming the loan never goes negative and fully amortizes by exit
- DSCR monitoring against the covenant, plus a single overall “all checks pass” status flag
Data Center Frequently Asked Questions (Faq)
“What exactly am I getting for my money?”
A single, fully-linked Microsoft Excel (.xlsx) workbook with 23 color-coded tabs covering construction, leasing, revenue, opex, debt, taxes, three financial statements, returns, sensitivity analysis, and built-in checks — a complete data center financial model, not a stripped-down template with a few sample formulas.
“I don’t want a rigid template — can I actually change the assumptions to fit my own deal?”
Yes. Every input — capacity, pricing, capex, opex, leverage, tax rate, exit multiple, and more — lives on the Assumptions tab as a clearly labeled, editable cell. Change any input and the whole model, from capacity through returns, recalculates automatically.
“Does it only run one static case, or can I actually stress-test the deal?”
It does both. A live Base/Upside/Downside toggle re-runs the entire model instantly, and the dedicated Sensitivity & Scenarios tab shows exactly how power price, utilization, rent, capex, leverage, and exit multiple each move your Equity IRR and MOIC.
“My project isn’t a 100MW hyperscale campus — will this still work for me?”
Yes. The model ships pre-configured for a phased, 100MW-class colocation/hyperscale build, but every capacity, phasing, and pricing assumption is fully editable, so it rescales cleanly to a smaller single-building facility or a larger multi-phase campus.
“Why is part of the timeline monthly and part annual — is that going to cause problems?”
No — it’s intentional. Construction and the critical first five years of lease-up are modeled monthly, where timing risk matters most; the remaining ten years are annual for speed. Returns use XIRR/XNPV on actual dates, so IRR and NPV are never distorted.
“How do I know the balance sheet isn’t just held together with plugs?”
It isn’t. Assets equal liabilities plus equity in every single modeled period, with no manual overrides anywhere. The Checks tab verifies this continuously alongside cash reconciliation, debt amortization, and capacity logic, so you can see it hold up yourself.
“What returns will I actually be able to show my investment committee or lender?”
Project (unlevered) IRR, Equity (levered) IRR, Equity MOIC, Project NPV at your chosen discount rate, and a full exit valuation built on a configurable EV/EBITDA multiple — the exact metrics IC memos and lender packages expect to see.
“I’m not an Excel power user — will I be able to actually use this?”
Yes. Every tab is labeled, color-coded by function, and laid out in a logical flow from assumptions through to returns, with on-sheet notes explaining the methodology as you go — built for confident use by analysts and non-technical stakeholders alike.
Final Notes on the Financial Model
This 15 Year Data Centre Financial Model focuses on balancing capital expenditures with steady revenue growth from diversified subscription-based services. By optimizing operational costs, and power efficiency, and maximizing high-margin services like cloud and managed offerings, the model ensures sustainable profitability and cash flow stability.
Further Reading
Data Center Construction Model: Looking for a model that’s more dedicated to the construction finances, it spans a 5-year (60-month) construction phase followed by a 15-year (180-month) operating phase.
- Data Center 5 Year Model: 5-year data centre financial model. Track power usage effectiveness (PUE), colocation lease-up rates, and operational expenditures.