
Data Center Construction Financial Model
This is a fully formula-driven, monthly-granularity Data Center Construction financial model for a ground development. It spans a 5-year (60-month) construction phase followed by a 15-year (180-month) operating phase — 240 months.
The Excel model covers the full lifecycle of the investment: land acquisition, phased construction and IT capacity delivery, lease-up and revenue ramp, operating costs and energy consumption, construction and permanent debt financing, depreciation and tax, a three-statement financial model (Income Statement, Balance Sheet, Cash Flow Statement), an equity distribution waterfall, an integrated discounted cash flow (DCF) valuation, and sensitivity analysis on the key value drivers.
Financial Template For Data Center Construction
Every output cell is a live formula — nothing is hardcoded — so changing an
assumption anywhere on the input tabs flows automatically through the entire
240-month engine, the three financial statements, and the returns analysis.
The workbook is organized into 19 tabs across four functional groups:
inputs & controls, monthly calculation engines, financial statements, and returns, valuation & sensitivity.
How can this model help you?
This targets the mechanical, electrical, and plumbing (MEP) engineers and project managers who are focused on building costs and investors interested in cash flow projections.
- 240-month monthly engine — every driver (capacity, utilization, pricing,
power cost, debt balances, depreciation) is calculated month-by-month, not
interpolated from annual figures. - Scenario switching — a single Base Case / Upside / Downside toggle
reprices utilization, rental rates, power costs, opex, construction costs,
and construction delay across the entire model. - Phased development — four independent 25MW capacity phases, each with
its own construction schedule, commercial operating date (COD), and
post-COD lease-up ramp curve. - Fully linked three-statement model — Income Statement, Balance Sheet,
and Cash Flow Statement tie out to the same underlying engine, with the
Balance Sheet balancing to the penny every month. - Integrated DCF valuation — unlevered free cash flow discounted at WACC,
with an exit-cap-rate terminal value, a perpetuity-growth cross-check, and
an equity-level NPV cross-check, all built directly into the Returns &
Waterfalls tab. - Multi-tier equity waterfall — return of capital, preferred return, GP
catch-up, and residual promote split, computed monthly and rolled up into
IRR and MOIC. - Color-coded, audit-ready formatting — blue for hardcoded inputs, black
for on-sheet formulas, green for links to other tabs, yellow fill for key
assumptions worth reviewing first.
Tab-by-Tab Guide
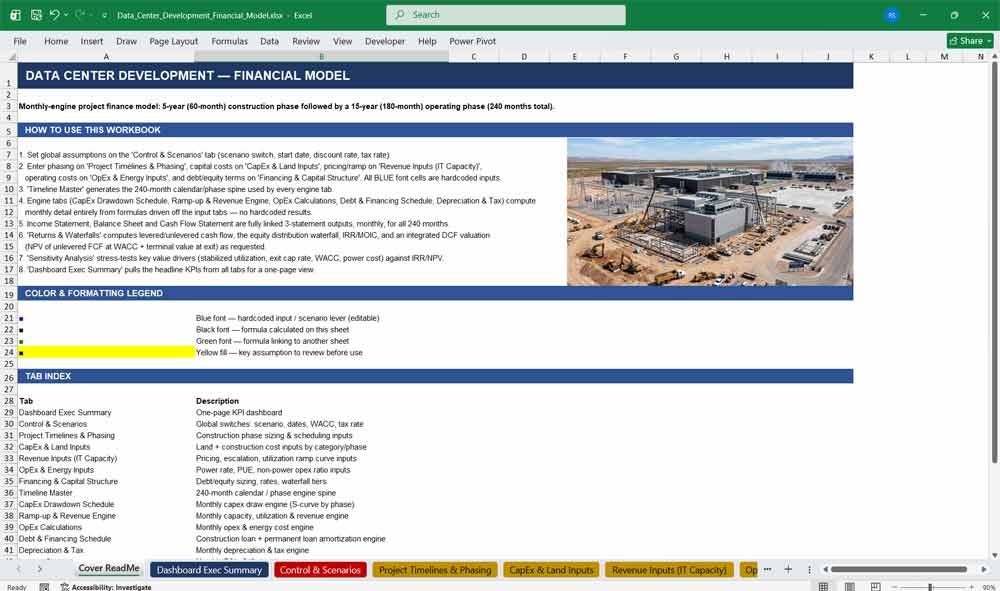
Cover ReadMe
The front door to the workbook. Explains how the model is organized, how to
navigate it, and how to read the formatting conventions before touching any
numbers.
- Step-by-step instructions for working through the input tabs in the right
order - A full color/formatting legend (inputs vs. formulas vs. cross-sheet links
vs. key assumptions) - A tab index with a one-line description of every sheet in the workbook
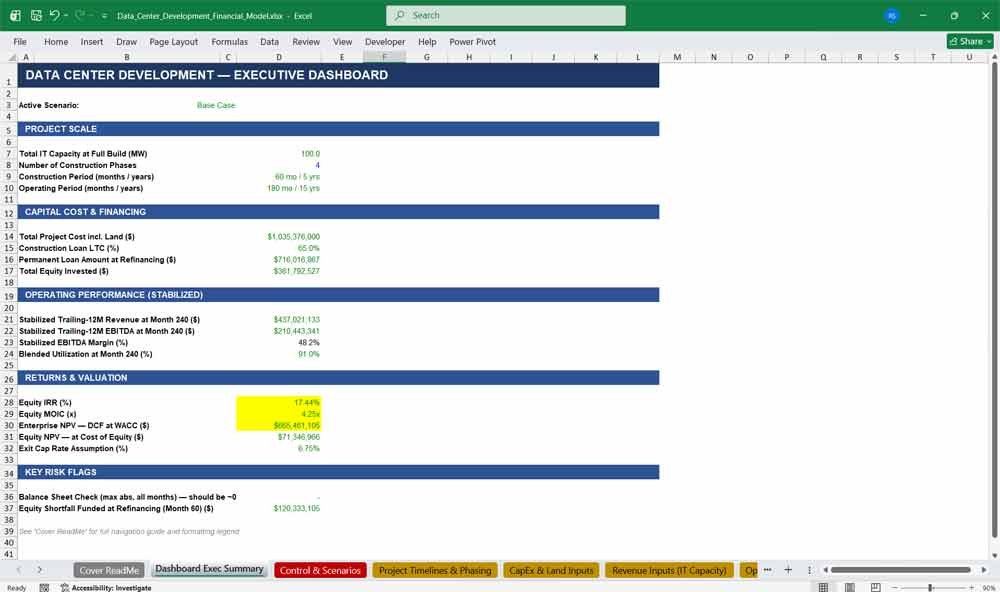
Dashboard Exec Summary
A one-page rollup of the headline numbers, pulled live from every other tab
— the fastest way to see how a change to any assumption moves the overall
deal.
- Project scale (total MW, number of phases, construction/operating
duration) - Total project cost, financing structure, and total equity invested
- Stabilized revenue, EBITDA, and EBITDA margin at the end of the model
horizon - Headline returns: Equity IRR, Equity MOIC, Enterprise NPV, and Equity NPV
- A balance-sheet integrity check and a flag for any equity shortfall funded
at the construction-to-permanent loan refinancing event
Control & Scenarios
The master switchboard for the model. One dropdown here reprices the entire
240-month engine.
- Base Case / Upside / Downside scenario selector, with editable multipliers
for utilization, rental rate, power cost, opex, construction cost, and
construction delay - Global start date and the 60-month construction / 180-month operating
split - Discount rate (WACC) and cost of equity used by the DCF and equity NPV
cross-check - Exit cap rate, terminal growth rate, corporate tax rate, and general
inflation/escalation assumptions
Data Center Construction Timeline And Costing
Project Timelines & Phasing
Defines how the 100MW of total IT capacity is delivered across four construction phases.
Per-phase capacity (MW), construction start month, construction duration,
and commercial operating date (COD)- Scenario-adjusted COD that shifts automatically with the construction
delay multiplier Per-phase ramp-to-stabilization period and stabilized utilization target
- Generator Costs
UPS Costs
PDU Costs
Wiring Costs Design PUE (Power Usage Effectiveness) assumption used throughout the
energy calculations
CapEx & Land Inputs
All capital cost assumptions, broken out by category so they can flow into
both the construction draw schedule and the depreciation engine.
Land cost and purchase timing
- Cost per MW for Shell & Core, Mechanical & Electrical Infrastructure, and
IT Fit-Out, each tagged with its own depreciation useful life Soft cost and contingency percentages applied on top of hard costs
Roll-up of total project cost, feeding directly into the CapEx Drawdown
Schedule and the debt sizing on the Financing tab
Revenue Inputs (IT Capacity)
Pricing and lease-up assumptions that drive the Ramp-up & Revenue Engine.
Base colocation rate ($/kW/month) with annual escalation
A 24-month post-COD utilization ramp curve, expressed as a percentage of
each phase’s stabilized utilization targetOther revenue (cross-connects, remote hands) as a percentage of colocation
revenuePower cost pass-through markup, so tenants reimburse the landlord for
utility costs plus a margin — a standard wholesale colocation structure
OpEx & Energy Inputs
Every non-capital cost assumption used in the monthly OpEx engine.
Utility power rate ($/kWh) with annual escalation
Facilities maintenance & staffing, property tax, and insurance ratios
Management fee (% of revenue) and a fixed, inflation-escalated G&A cost
- PUE is sourced from the Phasing tab to keep the power-draw calculation
consistent across the model
Financing & Capital Structure
Debt and equity terms for both the construction period and the permanent
financing that replaces it at stabilization.
Construction loan: loan-to-cost, interest rate, and upfront fee
Permanent loan: loan-to-cost at refinancing, fixed rate, amortization
period, term, and origination feeEquity waterfall terms: preferred return hurdle, IRR hurdle tiers, GP
catch-up percentage, and promote splits
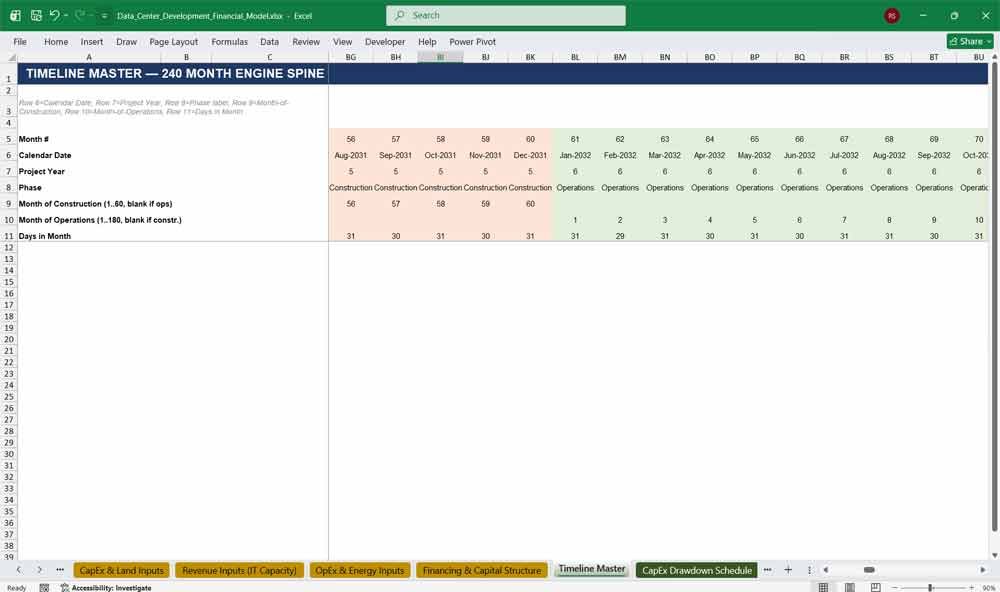
Timeline Master
The 240-month calendar spine that every other engine tab references, so
dates and phase labels are always consistent across the workbook.
Month number, calendar date, and project year for all 240 months
Construction vs. Operations phase flag for every month
Month-of-construction and month-of-operations counters used by
downstream ramp and amortization formulas
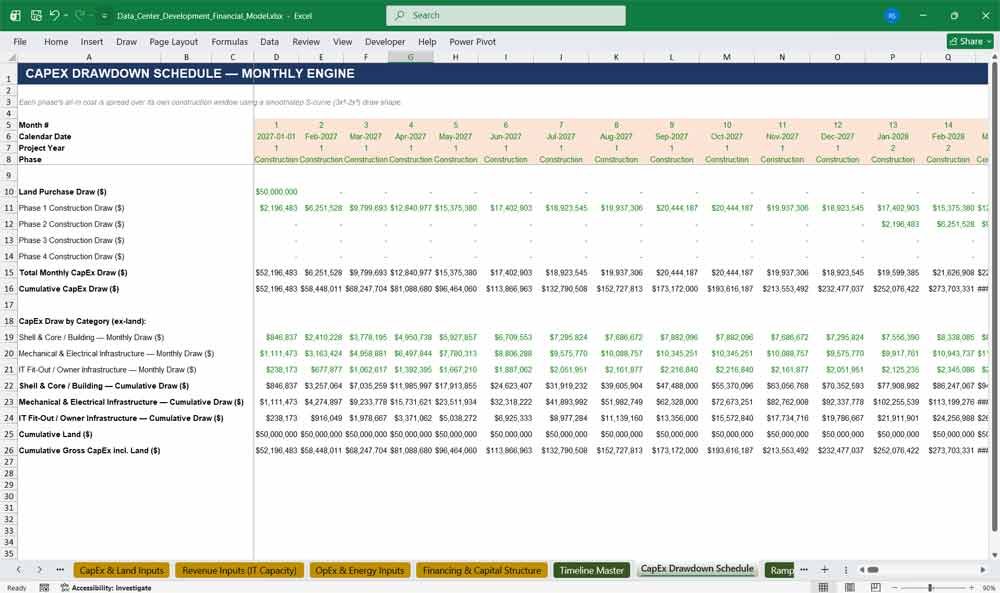
CapEx Drawdown Schedule
Converts the phasing and cost inputs into an actual month-by-month capital
spending plan.
Land draw and four independent phase draws, each spread over its own
construction window using a smooth S-curve (front-loaded, peak, tail)
spending shapeMonthly and cumulative capex by cost category (Shell & Core, M&E, IT
Fit-Out), which feeds the depreciation basisCumulative gross capex including land, used directly by the Balance Sheet
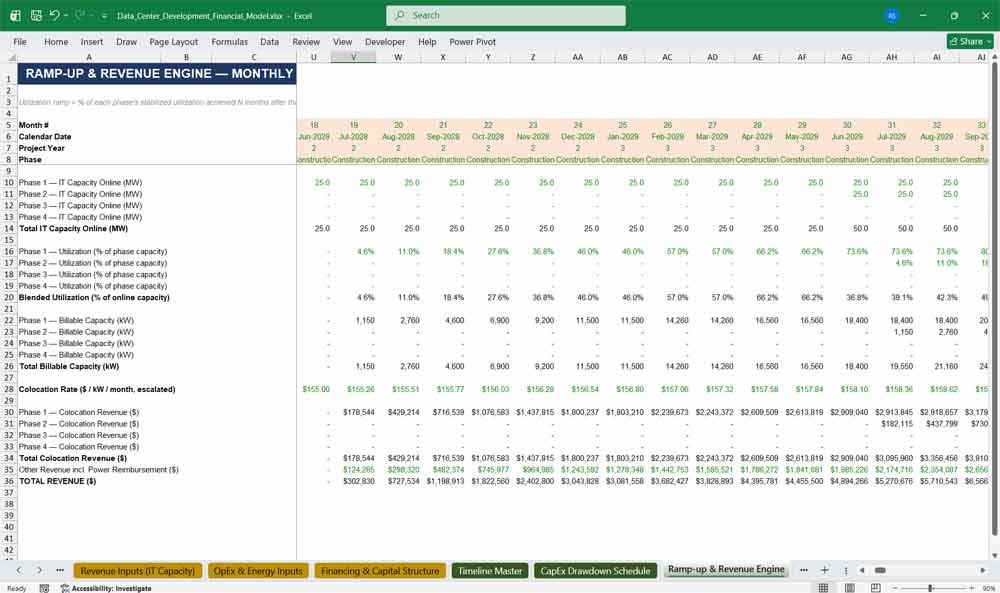
Ramp-up & Revenue Engine
Turns delivered capacity into billed revenue, phase by phase, month by
month.
IT capacity online and blended utilization by month, driven by each
phase’s COD and its own ramp curveBillable capacity (kW) and an escalating colocation rate
Data Center Construction Statement Calculations
OpEx Calculations
The monthly operating cost engine, split between energy costs and
non-power operating costs.
IT power draw and total facility power draw (grossed up by PUE), priced
at an escalating utility rate- Facilities maintenance, property tax, insurance, management fee, and G&A
Total OpEx, which flows straight into the Income Statement and EBITDA
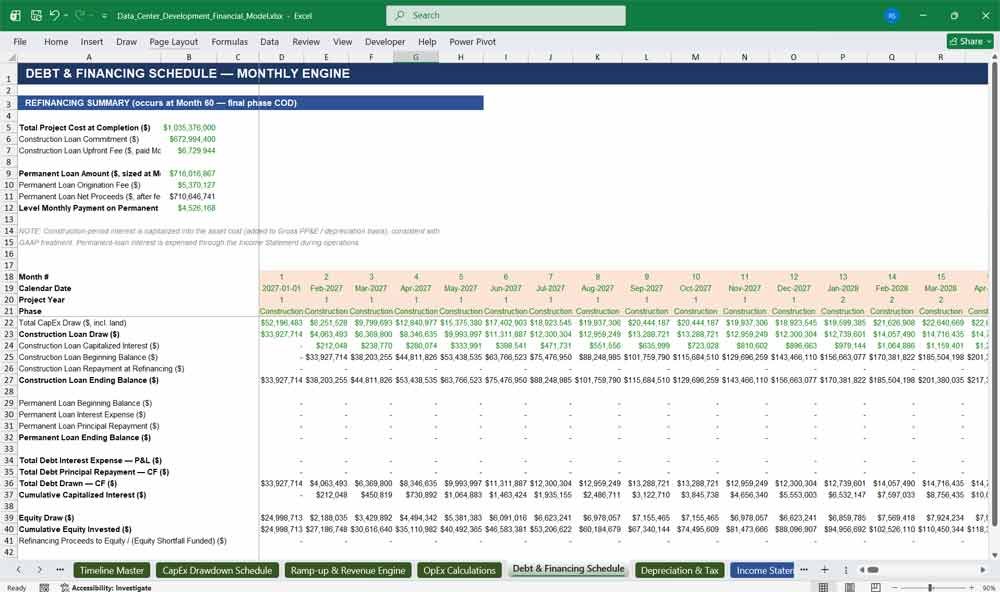
Debt & Financing Schedule
Models both the construction loan and the permanent loan that replaces it,
including the refinancing event itself.
Construction loan draws (pro-rata with capex) and capitalized interest
that compounds monthly during the build- The month-60 refinancing: permanent loan sizing off total completed cost
plus capitalized interest, payoff of the construction loan, and any
resulting equity shortfall or surplus Permanent loan amortization (level payment, fixed rate) for the full
15-year operating periodInterest expense, principal repayment, and cumulative equity invested,
all linked forward into the Income Statement, Balance Sheet, and Returns
tab
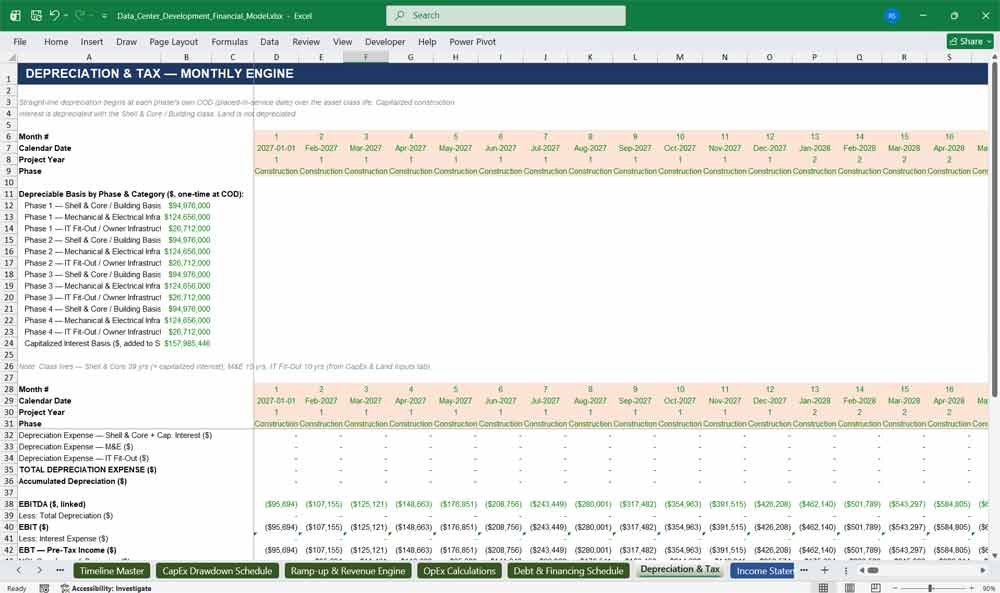
Depreciation & Tax
Places each phase’s capital cost into service at its own COD and
depreciates it on a straight-line basis by asset class.
Depreciable basis by phase and cost category, plus capitalized interest
added to the building classMonthly depreciation expense and accumulated depreciation by category
A full EBITDA-to-net-income build, including an NOL carryforward and
monthly income tax expense
Income Statement
The monthly P&L, fully linked to the revenue and cost engines.
Revenue build (colocation + other/power reimbursement)
Operating expenses, EBITDA, and EBITDA margin
- Depreciation, EBIT, interest expense, pre-tax income, tax expense, and
net income — all 240 months, side by side
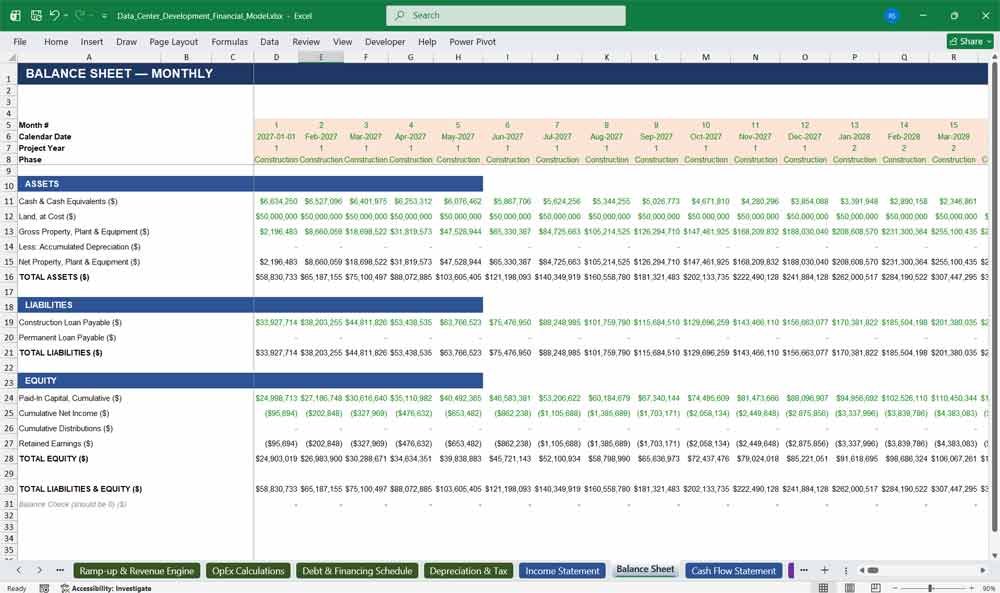
Balance Sheet
The monthly balance sheet, fully linked to the capex, debt, and income
statement engines — and balances every month by construction..
Cash, land, gross PP&E, accumulated depreciation, and net PP&ECash, land, gross PP&E, accumulated depreciation, and net PP&E
Construction loan and permanent loan balances
Paid-in capital, cumulative net income, cumulative distributions, and
retained earnings- A built-in balance check row confirming assets equal liabilities plus
equity in every period
Cash Flow Statement
The monthly cash flow statement, reconciling net income to the ending cash
balance shown on the Balance Sheet.
Cash flow from operations (net income plus depreciation)
Cash flow from investing (capital expenditures)
Cash flow from financing (debt draws and repayments, equity
contributions and distributions)- Beginning and ending cash balance for every month
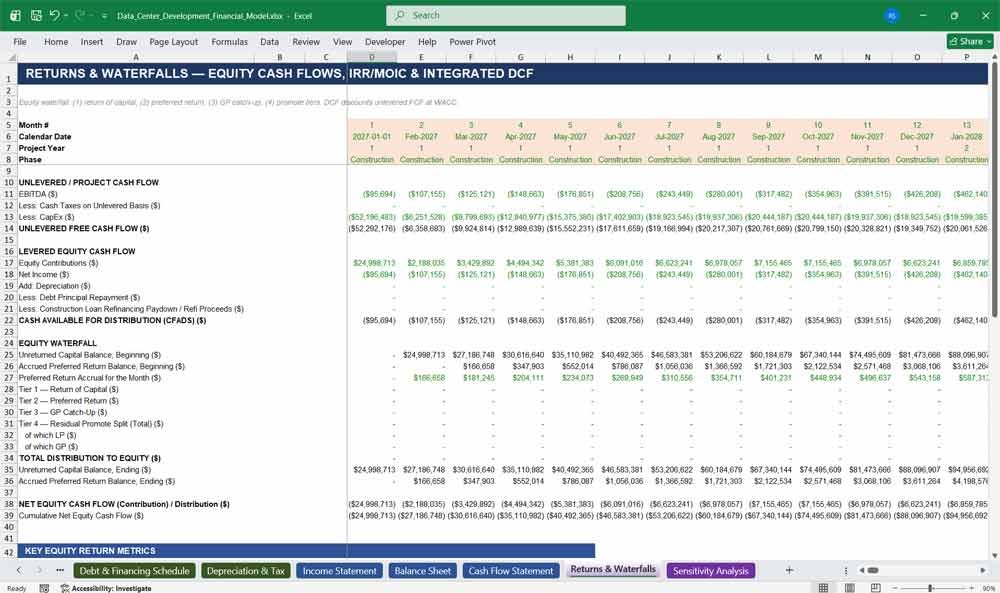
Returns & Waterfalls
The investment-decision tab: equity cash flows, the distribution waterfall,
and an integrated DCF valuation, all in one place.
Unlevered free cash flow (EBITDA less unlevered cash taxes and capex)
A four-tier equity waterfall — return of capital, preferred return, GP
catch-up, and residual promote split — computed monthlyEquity IRR and MOIC, plus total GP promote received
- Integrated DCF: PV of unlevered FCF at WACC, an exit-cap-rate
terminal value on stabilized trailing-12-month EBITDA, and an Enterprise
NPV — with a perpetuity-growth cross-check and an equity-level NPV
cross-check at the cost of equity
Sensitivity Analysis
Stress-tests the headline returns against the assumptions most likely to
move them.
- Equity IRR sensitivity grid: stabilized utilization vs. exit cap rate
- Enterprise NPV sensitivity grid: WACC vs. power cost multiplier
- Built as a transparent, formula-based approximation anchored to the base
case (rather than a full 240-month re-run per cell), so it stays fast and
fully auditable
Conclusion
This provides a detailed framework for assessing the viability of a data center construction template. It captures revenue sources from various construction and installation services, and operating expenses, and presents an opportunity to follow a structured development timeline.
Further Reading
Data Center 5 Year Model: 5-year data centre financial model. Track power usage effectiveness (PUE), colocation lease-up rates, and operational expenditures.
- Data Center 15 Year Model: This advanced template models multi-phase expansions, shifting energy markets, and long-term depreciation schedules.
Download Link On Next Page