
CNC Components Financial Model Template
Build a bankable forecast for your machine shop in hours, not months. This CNC components financial model template is a fully integrated Excel template that links SKU-level sales, machine capacity, materials, labor and overheads into a monthly income statement, balance sheet and cash flow statement, covering three years of history and seven years of forecast.
For a 3D Printing model, go here.
7-Year Financial Model for a CNC Components Manufacturer
Designed for precision machining, contract manufacturing and job-shop businesses, the model captures what actually drives CNC profitability: cycle times, setup hours, machine utilisation, scrap, tooling, and material costs across aluminium, stainless steel, titanium and Inconel. Model 30 individual SKUs plus 20 product families, and see contribution margin, gross margin, EBITDA and net income update instantly.
Whether you are preparing a bank loan, an equipment finance application, an investor pitch, a budget or an acquisition case, one Model Start Date re-dates every tab automatically. Built-in DCF valuation, equity IRR, DSCR covenants, Base, Upside and Downside scenarios, and over forty automatic integrity checks give lenders and investors confidence in every number.
What is inside: tab-by-tab highlights
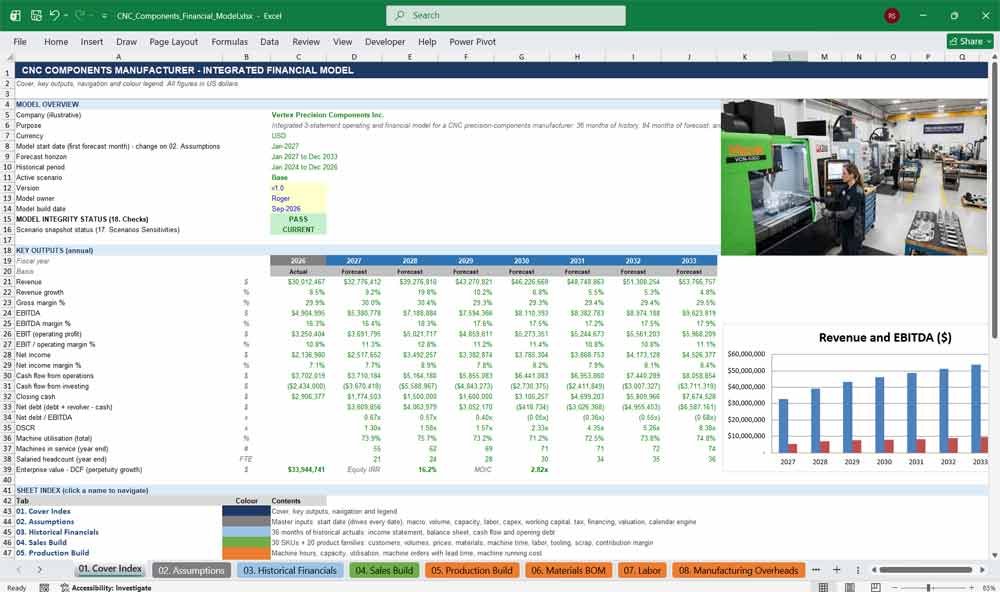
01. Cover Index
The Cover Index is the front page of your CNC financial model, with clickable navigation to all eighteen tabs, a live model-integrity status, key annual outputs and charts, so investors, lenders and managers find revenue, EBITDA, cash and returns instantly.
Highlights
- Clickable index linking all 18 tabs
- Live PASS or REVIEW status pulled from the Checks tab
- Seven-year key outputs: revenue, margins, EBITDA, net income, cash, leverage, DSCR and utilisation
- Three built-in charts, colour legend and step-by-step how-to-use guide
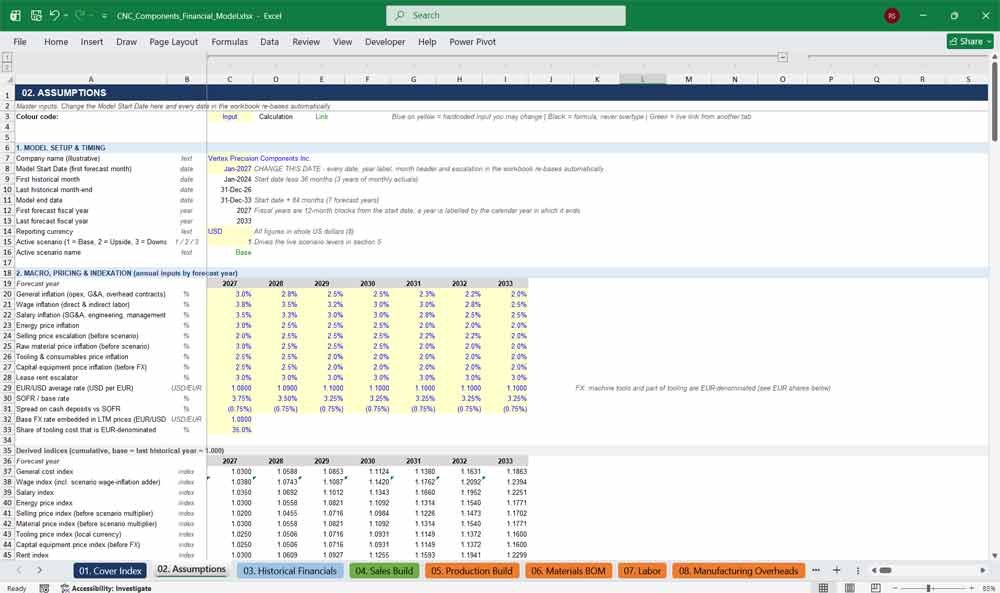
02. Assumptions
Control the whole CNC manufacturing forecast from one Excel assumptions tab. Change the Model Start Date and every date, year label and escalation updates automatically, while inflation, FX, SOFR, volume growth, capex, working capital, debt and valuation inputs stay organised.
Highlights
- One Model Start Date re-dates the entire workbook
- Annual inflation, wage, energy, material, price and FX inputs by forecast year
- Volume growth by SKU group, monthly seasonality and machine fleet table
- Financing, tax, working-capital days, WACC, exit multiple and a master calendar engine
CNC Components Manufacturer Sales & Production
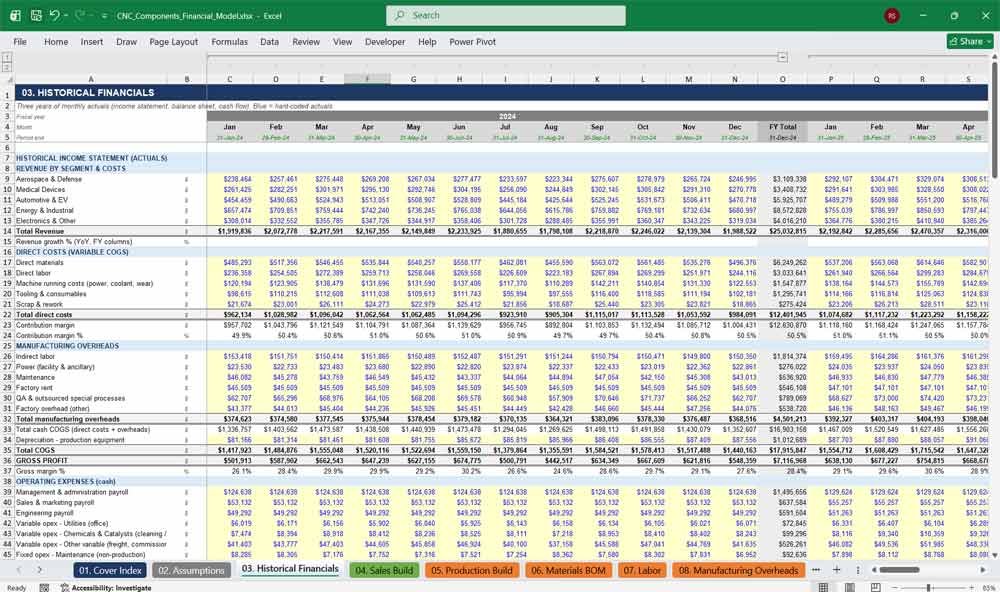
03. Historical Financials
Anchor your CNC business forecast in reality with thirty-six months of historical actuals. This tab holds the monthly income statement, balance sheet and cash flow statement, plus the opening debt schedule, so every forecast starts from a balanced, reconciled position.
Highlights
- 36 months of monthly income statement, balance sheet and cash flow
- Blue hard-coded actuals ready to overwrite with your own accounts
- Opening debt schedule feeding the forecast
- Built-in cash and debt integrity checks
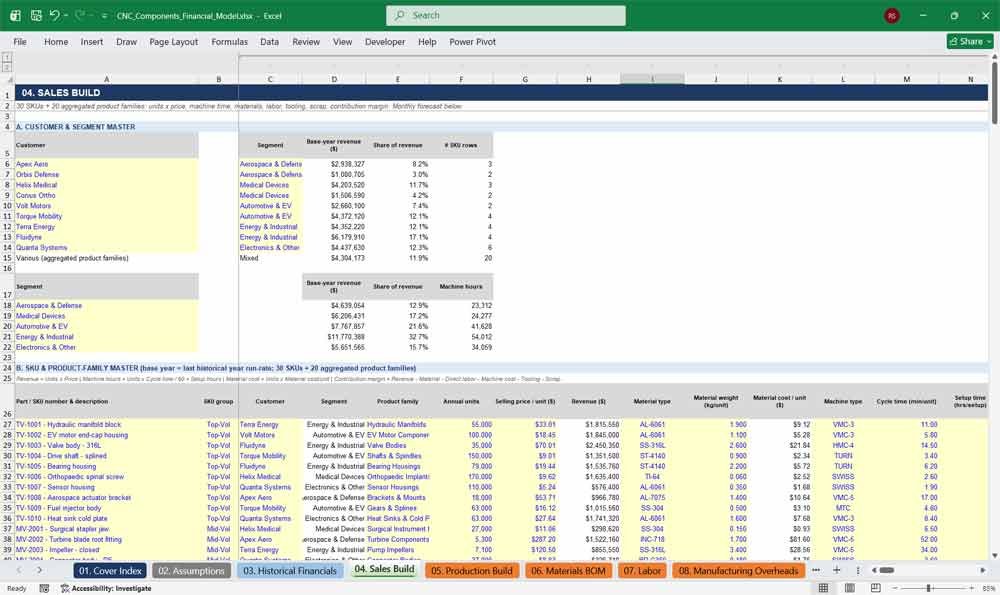
04. Sales Build
Forecast CNC machining revenue bottom-up. Thirty SKUs plus twenty aggregated product families capture customers, part numbers, units, prices, materials, machine type, cycle and setup time, labor, tooling, scrap and contribution margin, covering roughly eighty-eight percent of revenue and machine hours.
Highlights
- 30 SKUs: 10 top-volume, 10 mid-volume, 5 low-volume and 5 new parts, plus 20 families
- Revenue equals units times price; contribution margin calculated per SKU
- Customer and end-market summaries across five industry segments
- Monthly volumes with seasonality, growth by SKU group and new-part ramp-up
05. Production Build
Turn sales volumes into monthly machine hours, capacity and utilisation. Six CNC machine types, shift patterns and availability drive automatic machine orders with lead times, so you can see when capacity binds and what machine expansion the forecast really needs.
Highlights
- Machine hours equal units times cycle time divided by 60, plus setup hours
- Six machine types: 3-axis, 4-axis, 5-axis, turning, mill-turn and Swiss-type
- Utilisation by machine type with an automatic capacity trigger
- Machine running costs and machines-in-service tracking
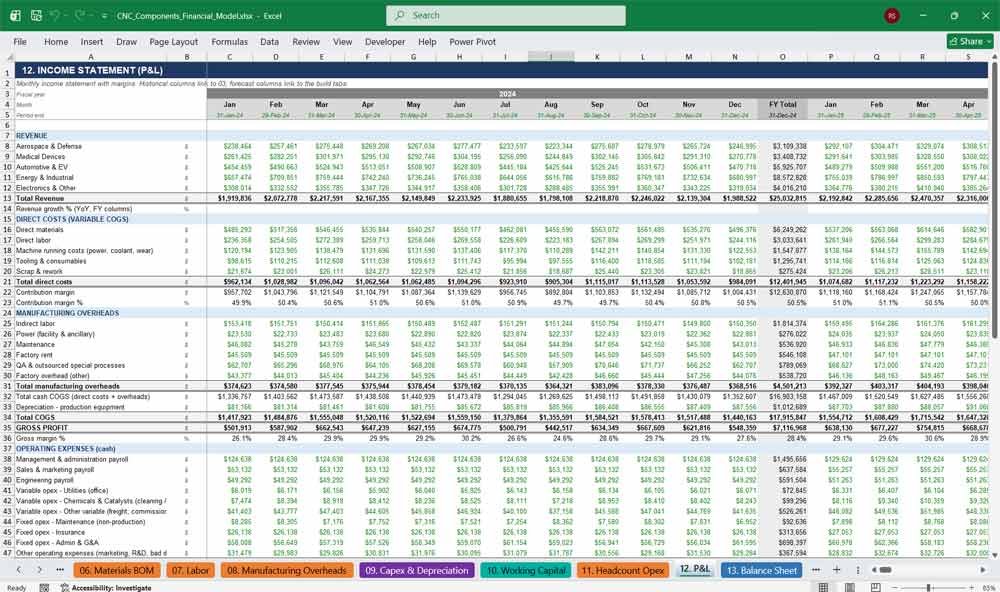
06. Materials BOM
Model raw material and consumable costs with precision. Kilograms per part, eight material grades from aluminium to Inconel, price indices, tooling categories and scrap or rework percentages combine into accurate material cost per finished unit and total cost of goods.
Highlights
- Eight material grades: aluminium, stainless steel, alloy steel, brass, titanium and Inconel
- Material cost per unit and kilograms consumed by SKU
- Tooling split: cutting tools, workholding, gauges and coolants
- Scrap and rework costs by SKU
07. Labor
Capture CNC machinist labor costs accurately and transparently. Direct labor hours by SKU, loaded hourly rates with payroll burden and shift premiums, productivity gains and wage inflation combine with machine-based indirect staffing ratios to forecast total monthly manufacturing labor cost.
Highlights
- Direct labor hours and cost by SKU
- Loaded rate including burden, shift premium and productive time
- Indirect labor headcount driven by machines in service
- Wage inflation plus scenario wage adder
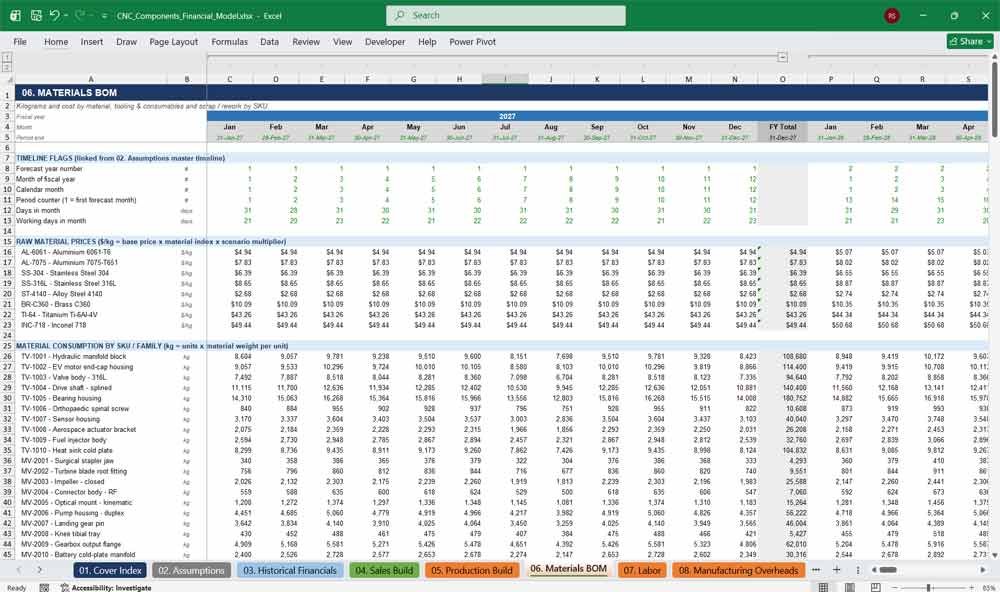
08. Manufacturing Overheads
Forecast CNC factory overheads without any guesswork. Machine power draw, facility electricity, preventive maintenance contracts, repairs, factory rent per square foot, quality assurance, special processes and general factory costs scale automatically with machine count, floor space, production hours and revenue.
Highlights
- Power calculated from machine kW, facility area and tariff
- Maintenance from per-machine contracts and repair cost per machine hour
- Factory rent with annual escalator and floor-space expansion
- QA, certification and outsourced special processes
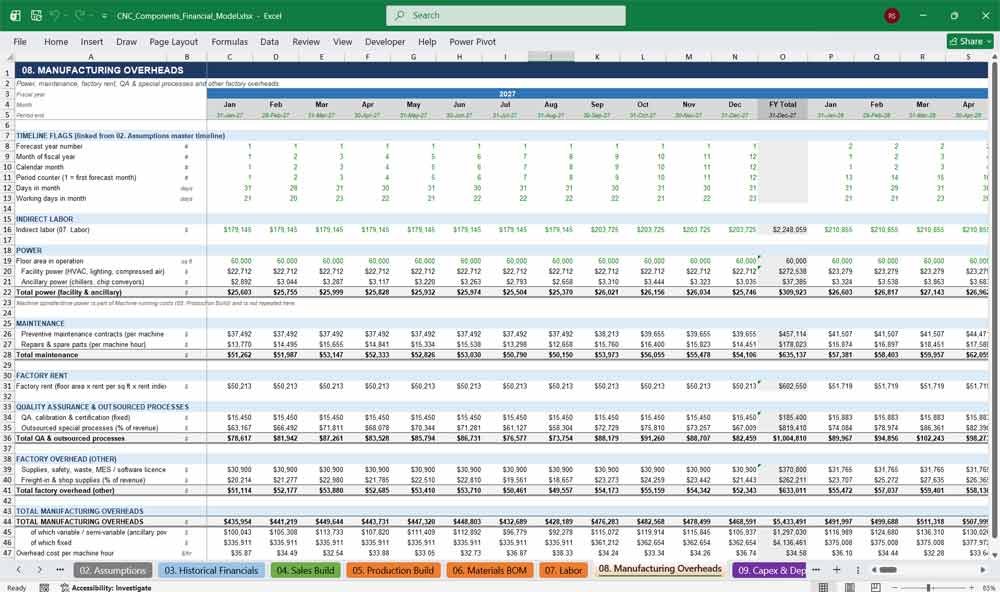
09. Capex & Depreciation
Plan capital investment in CNC equipment with confidence. Replacement and growth machine purchases, capital work in progress, environmental and efficiency projects, major overhauls and software licences feed asset-class depreciation, net book value and a complete monthly fixed-asset roll-forward schedule included.
Highlights
- Maintenance and growth capex with EUR-linked machine pricing
- Capital work in progress transferred at commissioning
- Depreciation by asset class using useful lives and remaining lives
- Environmental, efficiency, overhaul and software capex lines
CNC Components Manufacturer Financial Statements
10. Working Capital
Protect CNC company cash flow with days-based working capital. Receivable days, payable days, raw material, work-in-progress, finished goods and spare parts inventory days, accruals and customer deposits flow directly into the balance sheet and cash flow statement every single month.
Highlights
- DSO, DPO and inventory days by forecast year
- Accruals for payroll, opex, tax and interest
- Customer deposits and other current items
- Scenario DSO adjustment for downside stress testing
11. Headcount Opex
Manage overhead and operating expenses in one place. A fourteen-role salaried headcount plan, variable opex for utilities, chemicals and catalysts, fixed opex for labor, maintenance, insurance and G&A, plus warranty provisioning, complete your CNC manufacturing cost structure with clear detail.
Highlights
- Salaried staffing plan with net hires by year
- Variable opex: utilities, chemicals and catalysts, other variable costs
- Fixed opex: labor, maintenance, insurance, admin and G&A
- Warranty provision feeding the balance sheet
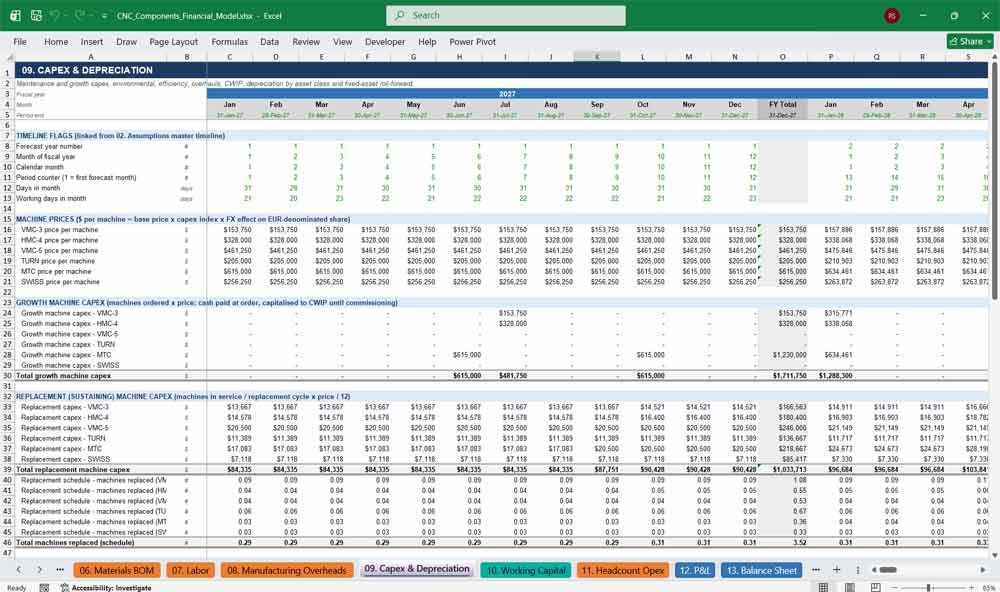
12. Income Statement (P&L)
Review CNC manufacturing profitability month by month. The income statement shows revenue by market segment, direct costs, contribution margin, gross profit, EBITDA, EBIT and net income with margin percentages, all reconciled automatically back to the detailed sales build and cross-checked.
Highlights
- Revenue across five end-market segments
- Gross margin, EBITDA margin, EBIT margin and net income margin
- Contribution margin and cost structure
- Built-in reconciliations to Sales Build and EBIT cross-checks
13. Balance Sheet
Present a fully detailed, always-balanced CNC company balance sheet. Current and non-current assets, liabilities and equity roll forward monthly from historical actuals, with a balance check at the bottom that confirms total assets equal total liabilities plus total shareholder equity.
Highlights
- Detailed current and non-current assets and liabilities
- Gross and net PP&E, CWIP, intangibles and provisions
- Equity with retained earnings, dividends and share premium
- Balance check line confirming zero difference
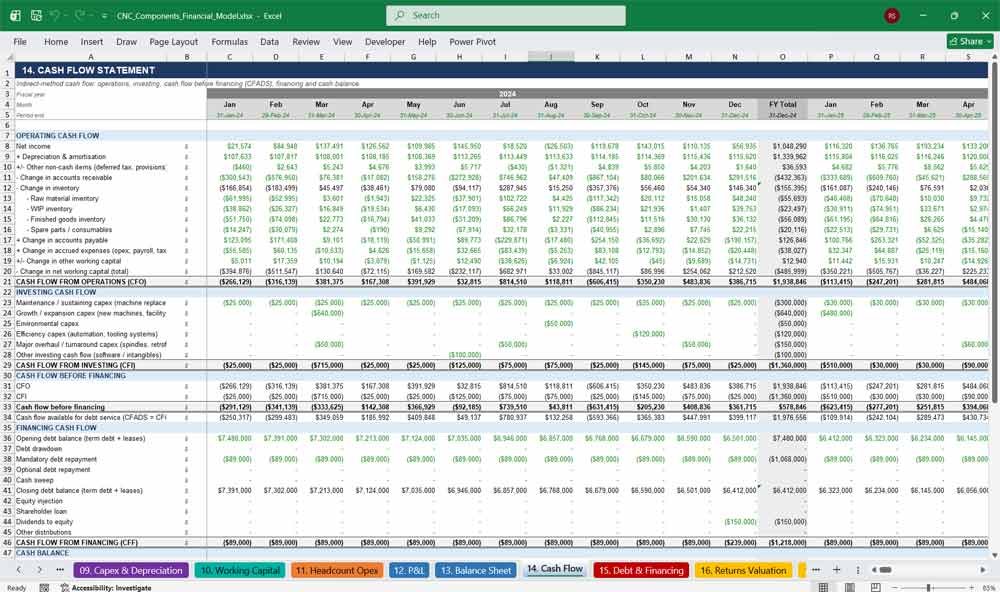
14. Cash Flow
Understand cash generation and funding needs. The indirect cash flow statement covers operations, investing, cash flow before financing including CFADS, and financing including debt drawdowns, repayments, cash sweep, equity, shareholder loans and dividends, ending in reconciled monthly closing cash balances.
Highlights
- Operating, investing and financing cash flow
- Cash flow available for debt service (CFADS)
- Minimum cash, revolver and excess cash tracking
- Closing cash reconciled to the balance sheet
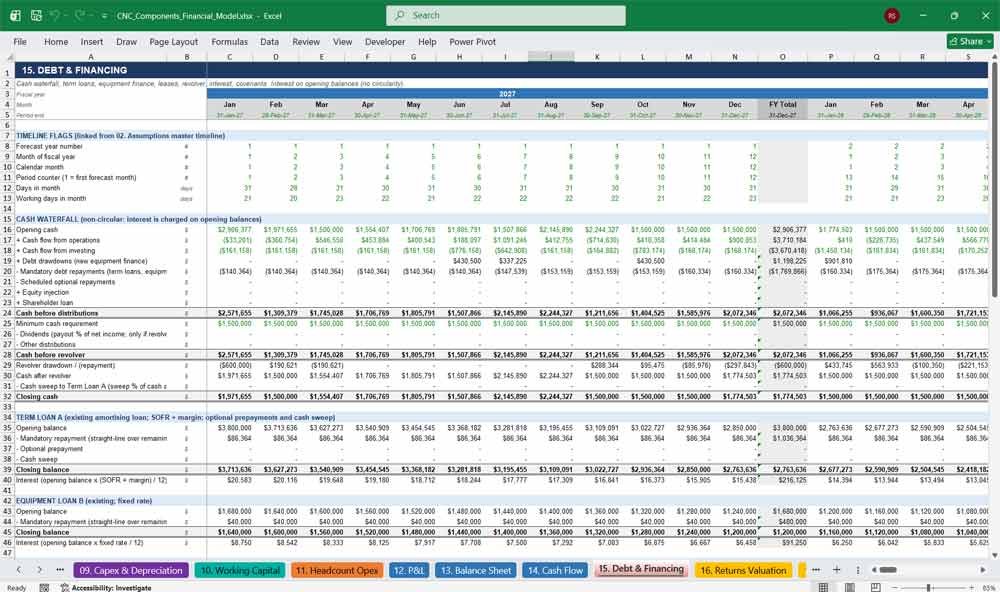
15. Debt & Financing
Structure and stress-test your financing package. Term loan, equipment loan, new equipment finance, finance leases and a revolving credit facility run through a monthly cash waterfall with dividends, cash sweep and covenant testing, all without circular references or iterative calculation.
Highlights
- Term Loan A, Equipment Loan B, new equipment finance, leases and revolver
- Cash sweep, optional prepayments and dividend policy
- Leverage and DSCR covenant tests with interest cover
- Non-circular design that needs no iterative calculation
Key Financial Metrics for an CNC Components Manufacturer
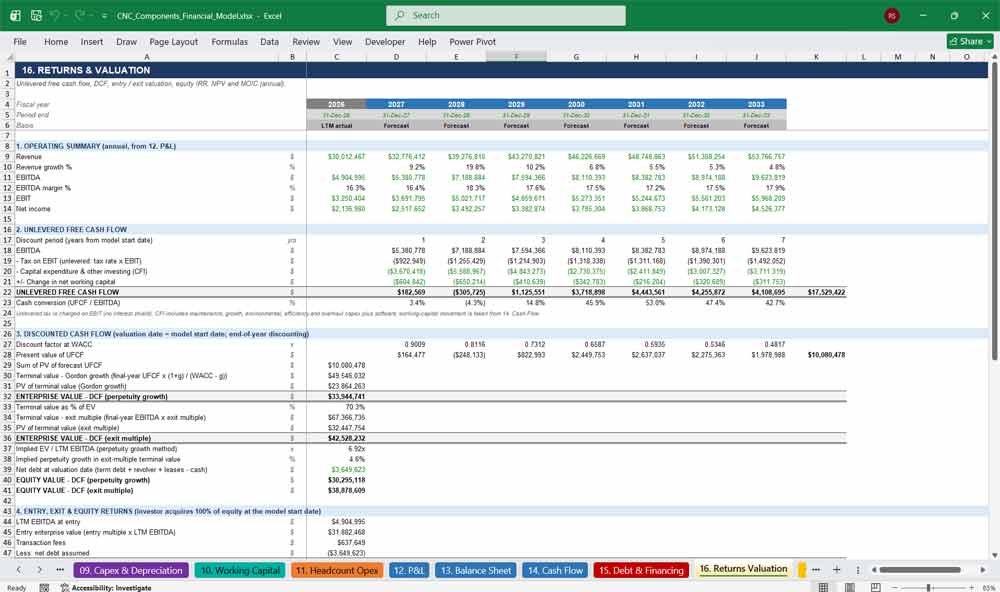
16. Returns Valuation
Value the business and measure investor returns. Unlevered free cash flow drives discounted cash flow valuation using perpetuity growth and exit multiples, alongside entry valuation, equity IRR, NPV, money multiple, return on equity and return on capital employed by year.
Highlights
- Unlevered free cash flow and DCF enterprise value
- Terminal value by perpetuity growth and exit multiple
- Equity IRR, NPV and MOIC from entry to exit
- Credit ratios, ROE and ROCE by year
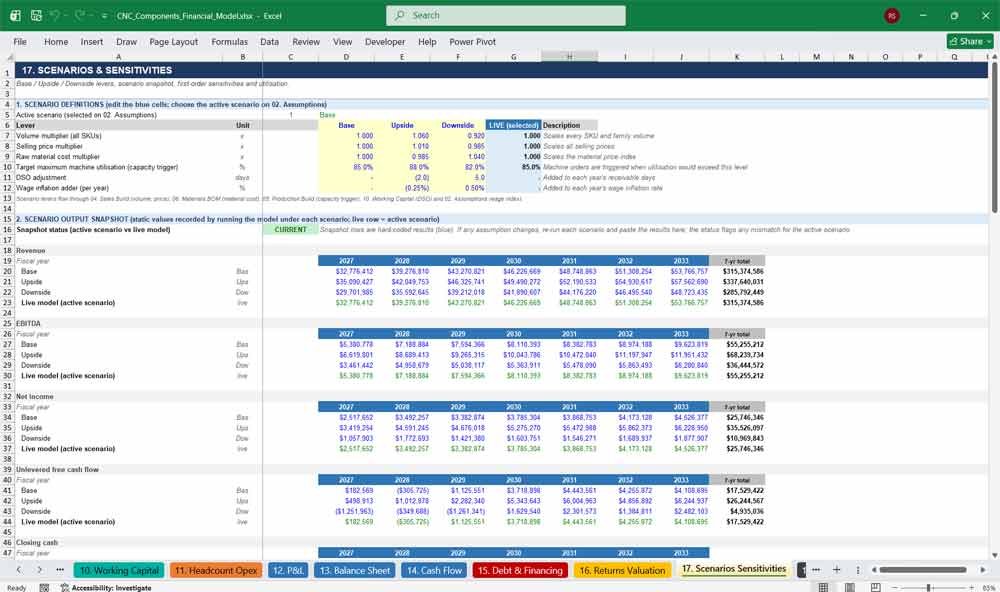
17. Scenarios Sensitivities
Test your CNC manufacturing forecast against uncertainty and risk. Switch between Base, Upside and Downside cases using volume, price, material, utilisation, receivable and wage levers, then review scenario results, sensitivity grids for valuation and returns, and machine utilisation by type.
Highlights
- Base, Upside and Downside scenario selector
- Side-by-side scenario snapshot of revenue, EBITDA, cash, leverage and returns
- Sensitivity grids: WACC versus terminal growth and exit multiple, entry versus exit multiple
- First-order EBITDA sensitivity to price, volume, material and labor
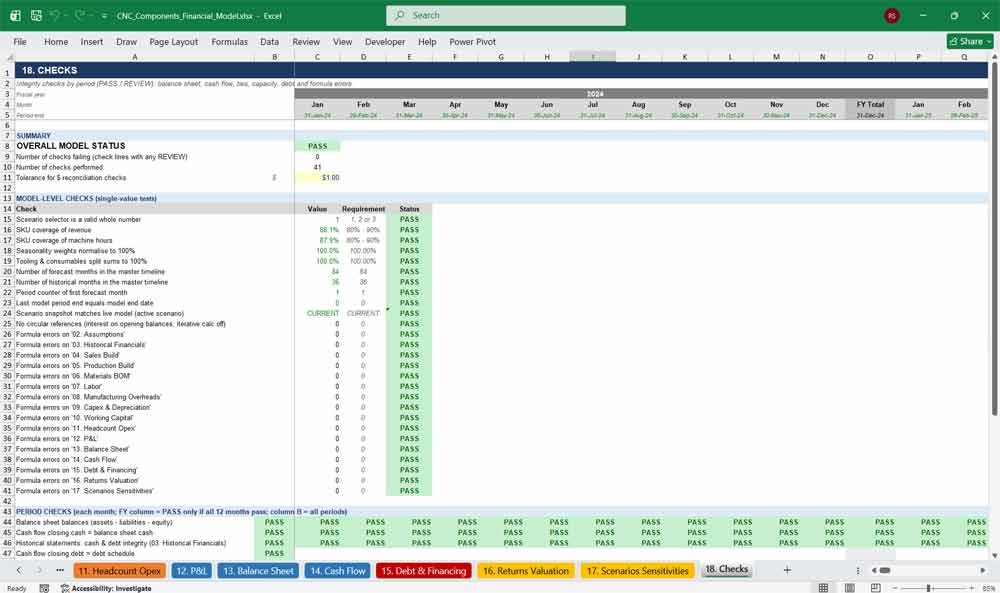
18. Checks
Trust every number with built-in financial model auditing. Over forty automatic PASS or REVIEW checks test balance sheet balance, cash reconciliation, debt roll-forward, cross-tab ties, capacity limits, timeline integrity and formula errors across every single model tab, month and year.
Highlights
- Overall model status shown on the Cover Index
- Monthly checks for balance sheet, cash flow and equity roll-forward
- Utilisation, revolver limit, negative debt and negative cash tests
- Error counts for every tab and liquidity and covenant monitor
Why Buy This CNC Financial Model?
Building a manufacturing financial model from scratch can take weeks of expensive analyst time, and most generic templates ignore how a CNC machine shop really makes money. This model is built around machine hours, cycle times, setups, tooling, scrap and utilisation, so your forecast reflects real shop-floor economics. Every forecast cell is a live formula, with no macros and no circular references, following professional colour-coding and layout standards that lenders, investors and accountants recognise. You get integrated financial statements, debt and covenant analysis, DCF valuation, scenarios and automatic error checks in one Excel file. Replace the illustrative data with your own parts, prices and actuals, and you have a decision-ready model for financing, budgeting, pricing, capacity planning or acquisition analysis, at a fraction of the cost and time of a custom build.
CNC Manufacturing Frequently asked questions (Faq)
Who is this CNC financial model for?
It is designed for owners and finance managers of CNC machine shops, precision machining companies and contract manufacturers, as well as investors, lenders, advisers and accountants who need to assess or forecast a machining business.
Do I need advanced Excel skills to use it?
No. Inputs are in blue on yellow cells, calculations are in black and links are in green. Most users only edit the Assumptions, Historical Financials and Sales Build tabs, and a how-to-use guide is on the Cover Index.
Can I change the start date of the model?
Yes. Change the Model Start Date on the Assumptions tab and every date, year header, month label, escalation, capacity timing and debt schedule re-dates automatically across all eighteen tabs.
Does the model use macros or VBA?
No. It uses standard Excel formulas only, such as SUMIFS, INDEX, MATCH, EDATE and SUMPRODUCT, so there are no security warnings, and the model contains no circular references or iterative calculation.
Can I replace the sample data with my own company’s numbers?
Yes. The company, customers, parts, prices, machines and historical actuals are illustrative. Overwrite the blue input cells with your own data and the income statement, balance sheet, cash flow and valuation all update.
How many parts and SKUs does it support?
The Sales Build holds 30 individual SKUs plus 20 aggregated product families, which together cover the majority of revenue and machine hours. It is designed to be replaced with your own top parts and families.
Does it work for job shops and high-mix, low-volume manufacturing?
Yes. Setup time, batch sizes, cycle time and scrap are modelled per part, and the long-tail and new-part groups let you represent high-mix work alongside high-volume programmes.
Is the model suitable for bank loans and investor presentations?
It follows the structure lenders and investors expect: three integrated statements, CFADS, DSCR and leverage covenants, DCF valuation, equity IRR and scenarios. Always review assumptions with your adviser before submitting to a lender.
How do the Base, Upside and Downside scenarios work?
Choose a scenario on the Assumptions tab and volume, price, material, utilisation, DSO and wage levers flow through the whole model. The comparison table on the Scenarios tab holds recorded results, so refresh them after changing inputs.
How does the model decide when to buy new machines?
It calculates required machine hours against available capacity for each machine type. When projected utilisation exceeds your target, new machines are ordered ahead of demand using the lead time, and flow into capex, depreciation and financing.
Can I use a currency other than US dollars?
The model is built in US dollars. You can relabel the currency for your own reporting, and the EUR/USD input reflects the euro cost of imported machine tools and tooling.
How do I know the model is working correctly?
The Checks tab runs over forty automatic tests covering balance sheet balance, cash reconciliation, debt roll-forward, cross-tab ties, capacity limits and formula errors, and the overall PASS status appears on the Cover Index.
Final Notes on the Financial Model
Financial model for a CNC Components manufacturer
- Scenario Analysis: Create best-case, base-case, and worst-case projections.
- Break-even Analysis: Determine sales volume required to cover fixed & variable costs.
- Sensitivity Analysis: Assess how changes in raw material costs, pricing, or demand impact profitability.
This structured model helps a CNC manufacturing service address a broad market spectrum, offering the right balance between cost, production capacity, support, and customization at each subscription level.
Download Link On Next Page
Download Link On Next Page