
Welding Company Financial Model Excel Template
20-Year Financial Model for a Welding Company
This financial model for a welding and metal fabrication business must account for a unique hybrid of service-based labor, project-based contract work, and heavy capital expenditures. Because welding operations rely heavily on specialized equipment, raw material costs (steel, aluminum, gases), and skilled labor, the model requires distinct granularity in its revenue drivers, Cost of Goods Sold (COGS), and asset depreciation schedules.
Income Statement (Profit & Loss)
The Income Statement projects the company’s profitability over a specific period, detailing how gross revenue translates into net income after accounting for direct production costs and overhead expenses.
Revenue
Structural & Architectural Welding: Long-term or milestone-based contracts for commercial buildings, staircases, handrails, and structural steel framing.
Custom Fabrication: One-off or small-batch custom metalwork for industrial, commercial, or residential clients, billed via project estimates or time-and-materials.
Repair & Maintenance Services: Mobile welding services, emergency repair work, and routine maintenance for heavy machinery, pipelines, or agricultural equipment.
Material Resale & Markup: Sales of raw metals, brackets, or specialized fittings sold directly to clients as part of a project, usually carrying a 15% to 30% material markup.
Cost of Goods Sold (COGS)
Direct Labor: Wages, payroll taxes, and benefits for certified welders, fabricators, and shop assistants directly tied to project execution.
Raw Materials: Consumable metals (carbon steel, stainless steel, aluminum plates, tubing, and structural shapes).
Welding Consumables & Gases: Shielding gases (argon, helium, CO2, oxygen, acetylene), filler metals (mig wire, tig rods, stick electrodes), and tungsten.
Shop Supplies & Tooling: Grinding discs, cutting wheels, plasma cutter tips, nozzle gels, and anti-spatter sprays.
Subcontractor Costs: Specialized third-party services like sandblasting, powder coating, or X-ray nondestructive testing (NDT).
Gross Profit
Calculation: Total Revenue minus Total COGS. This represents the core profitability of the welding operations before overhead.
Operating Expenses (OpEx)
Sales & Marketing: Advertising, website maintenance, trade show attendance, and estimating/bidding software licenses.
Administrative Salaries: Wages for project managers, estimators, administrative staff, and executive management.
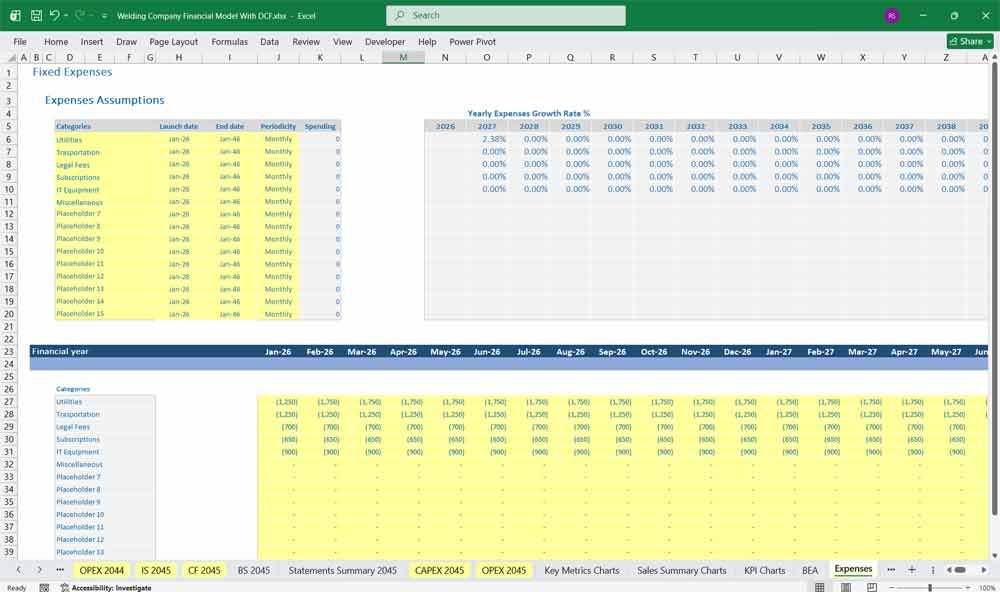
Facility Expenses: Commercial shop rent, property taxes, utilities (heavy three-phase electricity for welders), and waste disposal fees for metal scrap and hazardous waste.
Insurance: High-premium commercial general liability, inland marine (for mobile rigs), workers’ compensation, and professional liability.
Safety & Compliance: Personal Protective Equipment (PPE like helmets, welding jackets, gloves), OSHA compliance audits, and welder certification testing fees.
Vehicle & Fleet Expenses: Fuel, maintenance, and insurance for service trucks and mobile welding rigs.
Operating Income (EBIT)
Calculation: Gross Profit minus Total Operating Expenses.
Net Income
Calculation: Operating Income minus Interest Expense and Income Taxes.
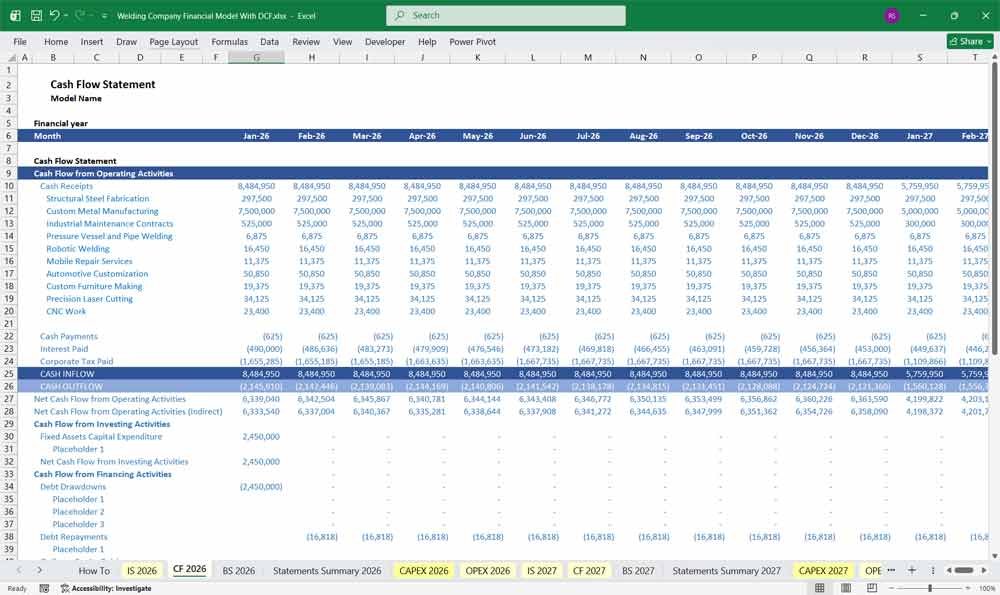
Welding Company Cash Flow Statement
The Cash Flow Statement tracks the actual movement of cash into and out of the welding company, bridging the gap between accrual-based net income and real liquidity.
Cash Flow from Operating Activities
Net Income: The starting baseline from the Income Statement.
Non-Cash Adjustments: Adding back depreciation expense for heavy welding machinery and shop tools (since no cash leaves the business for depreciation).
Changes in Working Capital:
Accounts Receivable: Subtract increases in AR (representing unpaid client invoices that tie up cash) or add decreases.
Inventory: Subtract increases in raw material inventory purchases or add decreases.
Accounts Payable: Add increases in AP (delayed payments to suppliers preserve cash) or subtract decreases.
Cash Flow from Investing Activities
Capital Expenditures (CapEx): Cash outflows for purchasing new capital assets, such as upgrading to a fiber laser cutter, buying a new service truck, or acquiring advanced welding automation equipment.
Asset Sales: Cash inflows from liquidating old, obsolete, or underutilized shop machinery and vehicles.
Cash Flow from Financing Activities
Debt Proceeds: Cash inflows from securing new equipment loans, lines of credit, or term loans.
Debt Repayment: Cash outflows for the principal repayment of existing equipment loans and commercial mortgages.
Owner Distributions / Dividends: Cash outflows representing profits withdrawn by business owners or distributed to shareholders.
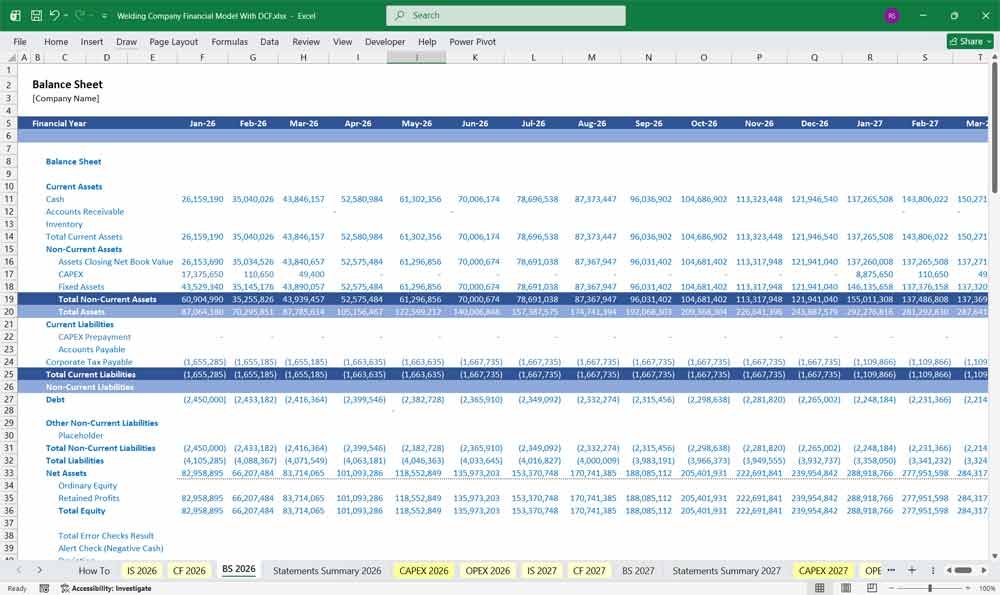
Welding Company Balance Sheet
The Balance Sheet provides a snapshot of the welding company’s financial health, capturing what it owns (assets), what it owes (liabilities), and the net worth of the business (equity).
Assets
Current Assets:
Cash and Cash Equivalents: Operating bank accounts and petty cash for day-to-day shop purchases.
Accounts Receivable (AR): Invoices sent to clients for completed welding projects, tracked via an aging schedule (30, 60, 90+ days).
Inventory: Raw metal stock, structural beams, sheet metal, gases, and spare parts.
Prepaid Expenses: Upfront payments for annual commercial insurance policies or software subscriptions.
Non-Current (Fixed) Assets:
Machinery & Equipment: MIG/TIG/Stick welding machines, plasma cutting tables, press brakes, ironworkers, bandsaws, and overhead cranes.
Fleet Vehicles: Equipped service trucks and delivery vehicles for mobile operations.
Leasehold Improvements: Shop modifications such as heavy-duty ventilation systems, custom electrical drop-downs, and reinforced concrete flooring.
Accumulated Depreciation: Contra-asset account tracking the wear and tear of heavy equipment and vehicles over time.
Liabilities
Current Liabilities:
Accounts Payable (AP): Short-term debts owed to steel distributors, gas suppliers, and tool vendors.
Accrued Payroll & Taxes: Wages earned by welders and staff but not yet paid, along with withheld payroll taxes.
Current Portion of Long-Term Debt: Principal payments due within the next 12 months on equipment loans or vehicle financing.
Non-Current Liabilities:
Long-Term Debt: Notes payable or equipment financing contracts extending beyond one year used to purchase expensive machinery.
SBA or Commercial Loans: Longer-term capital loans secured for facility expansion or major asset acquisitions.
Equity
Owner’s Equity / Common Stock: Initial capital contributions injected into the business by the founders or shareholders.
Retained Earnings: Cumulative net profits retained within the business rather than distributed as owner draws or dividends.
Key Welding Company Specific Considerations
High Fixed Cost Base: Specialist Equipment with high depreciation.
R&D Intensity: Critical for staying competitive.
Quality & Certification: Failure costs can be catastrophic (scrap, rework).
Cyclicality & Diversification: Seasonal demand can affect work volumes.
Operational Assumptions & Revenue Drivers
Revenue is driven by multiplying the production of specific product streams by their respective market prices, factored by demand.
10 Editable Input Examples
Structural Steel Fabrication: Structural steel fabrication revenue is driven primarily by project-based contracts for commercial, industrial, and infrastructure developments, capturing value from the high-volume shaping, cutting, and welding of components like beams, columns, and trusses. Top-line financial performance is heavily influenced by non-residential construction demand, raw material price volatility (such as fluctuating steel and shielding gas costs), and multi-month order backlogs. Because these projects typically require extensive engineering and high upfront labor, revenue recognition relies heavily on milestone completions or percentage-of-completion accounting, balancing project volume against tight material spreads.
Custom Metal Manufacturing: Custom metal manufacturing revenue is generated through specialized, often one-off or small-batch production runs tailored to unique client specifications across industrial, architectural, or consumer markets. Pricing typically incorporates a blended rate that covers intricate engineering, skilled programming of CNC machinery, detailed manual welding, and strict quality assurance. Because these projects vary significantly in complexity and volume, revenue streams rely heavily on time-and-materials billing or custom project estimates, commanding higher profit margins than standardized structural work due to the specialized craftsmanship and problem-solving required.
Industrial Maintenance Contracts: Industrial Maintenance Contract revenue represents recurring income earned through ongoing agreements to provide welding, fabrication, repair, and preventative maintenance services for industrial clients. These contracts typically cover manufacturing plants, processing facilities, warehouses, utilities, and heavy industrial sites, and may include scheduled inspections, equipment repairs, shutdown support, emergency call-outs, and routine maintenance. Revenue is generally recognised based on the terms of the contract, such as fixed monthly fees, labour hours worked, or completed milestones, providing a stable and predictable source of income for the business.
Pressure Vessel and Pipe Welding: Pressure Vessel and Pipe Welding revenue represents income generated from the fabrication, welding, repair, modification, and certification of pressure vessels, process piping, and industrial pipeline systems. This work typically serves industries such as oil and gas, petrochemical, mining, power generation, food processing, and manufacturing, where compliance with strict engineering standards and welding codes is essential. Revenue is generally driven by project contracts, fabrication volumes, labour hours, material requirements, and specialised welding procedures, with pricing often reflecting the technical complexity, certification requirements, and safety standards associated with pressure-containing equipment.
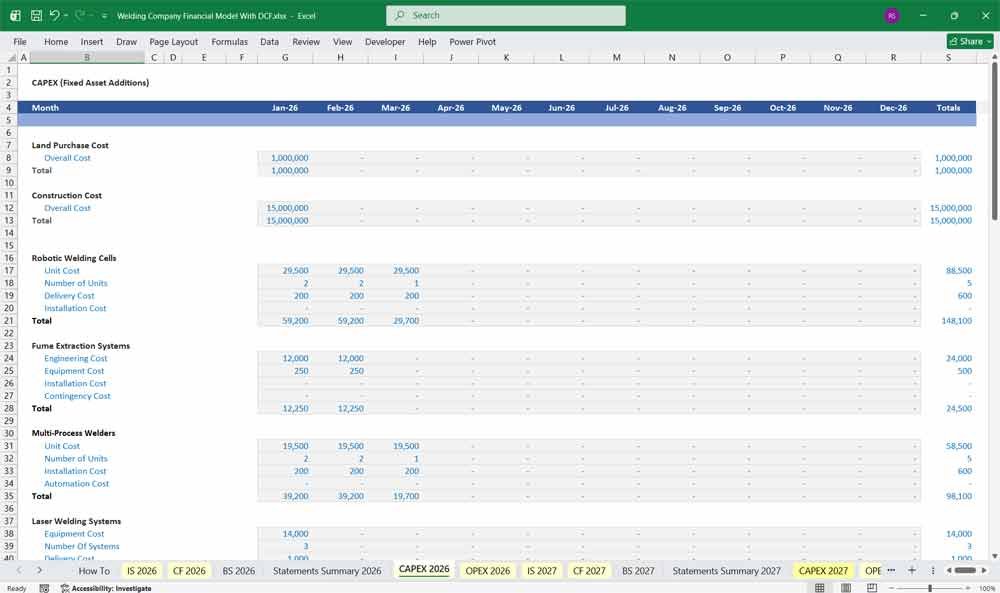
Capital Expenditure (CAPEX) Schedule
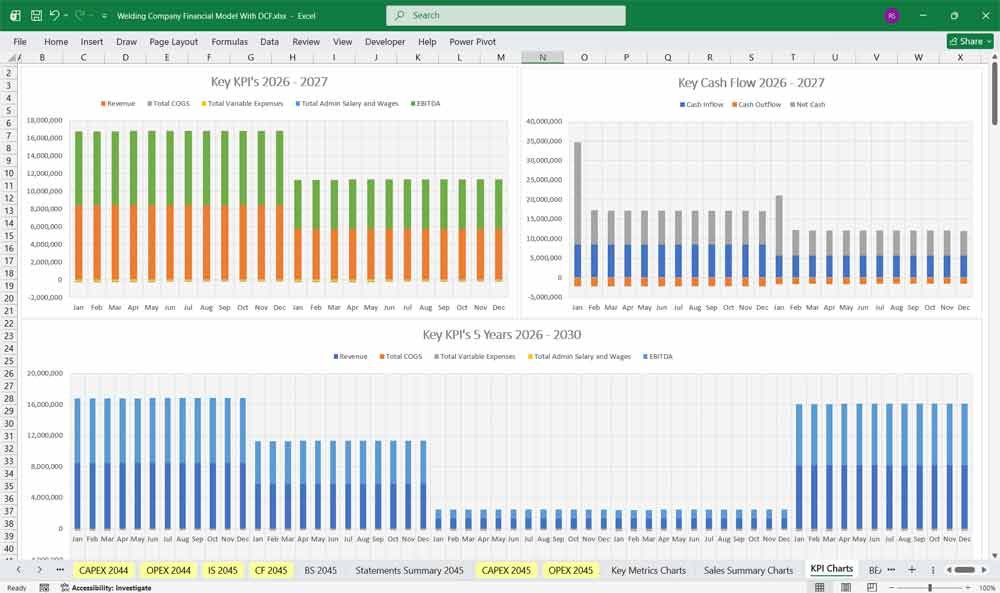
Upgrading or beginning a startup welding company requires substantial upfront and sustaining capital. The CAPEX schedule models the purchase price, installation costs, useful life, and salvage value of specific equipment, which directly drives the depreciation schedule.
Key Machinery Line Items
Robotic Welding Cells: In a CAPEX (Capital Expenditure) environment, a robotic welding cell is evaluated as a major strategic investment, defined by a significant upfront cost that is justified by a clear and rapid financial return. The initial capital outlay for a fully integrated, production-ready cell ranges from $85,000 for pre-engineered setups to over $350,000 for custom systems, but the purchase price of the robot arm itself is often the smallest part of the expense.
Multi-Process Welders: As a capital expenditure (CAPEX), a multi-process welder is a strategic investment that trades a higher initial purchase price for versatile, long-term operational savings and efficiency . By consolidating multiple functions like MIG, TIG, and Stick welding into a single, advanced power source, it eliminates the need to purchase and maintain separate, single-process machines . The true value proposition, however, lies in the significant reduction of non-value-added time. Advanced multi-process systems feature technologies like Quick-Select that enable near-instantaneous process switching without manually changing cables or gas hoses, which drastically cuts downtime and minimizes the risk of setup errors.
Laser Welding Systems: As a capital expenditure (CAPEX), a laser welding system represents a substantial, integrated investment defined by a high upfront cost that must be justified by transformative productivity gains and long-term savings. The total price tag for an automated cell can quickly soar from $200,000 to over $500,000, as you are not just buying a laser source but an entire ecosystem including robotics, precision tooling, safety enclosures, and peripheral systems like chillers. The CAPEX, however, is compelling when considering the dramatic operational advantages: robotic laser welding can be up to 10 times faster than manual methods, drastically reducing labor costs and rework while enabling 24/7 production.
Submerged Arc Welders: As a capital expenditure (CAPEX), a submerged arc welding (SAW) system requires a substantial upfront investment that is justified by its unmatched productivity and efficiency in heavy fabrication . The total cost, which includes power sources, wire feeders, flux handling systems, and mechanized carriages, is significant and often prohibitive for small workshops.
Pipe Beveling Machines: As a capital expenditure (CAPEX), a pipe beveling machine requires a significant upfront investment that is strategically justified by its ability to drastically reduce labor costs and improve productivity in pipe fabrication and maintenance. Automated beveling machines deliver cold, precise, and repeatable end preparations in a fraction of the time, eliminating secondary finishing operations like deburring and significantly reducing reject rates . Their ability to process multiple pipe diameters and wall thicknesses with quick-change tooling also improves overall equipment effectiveness (OEE) and workflow efficiency.
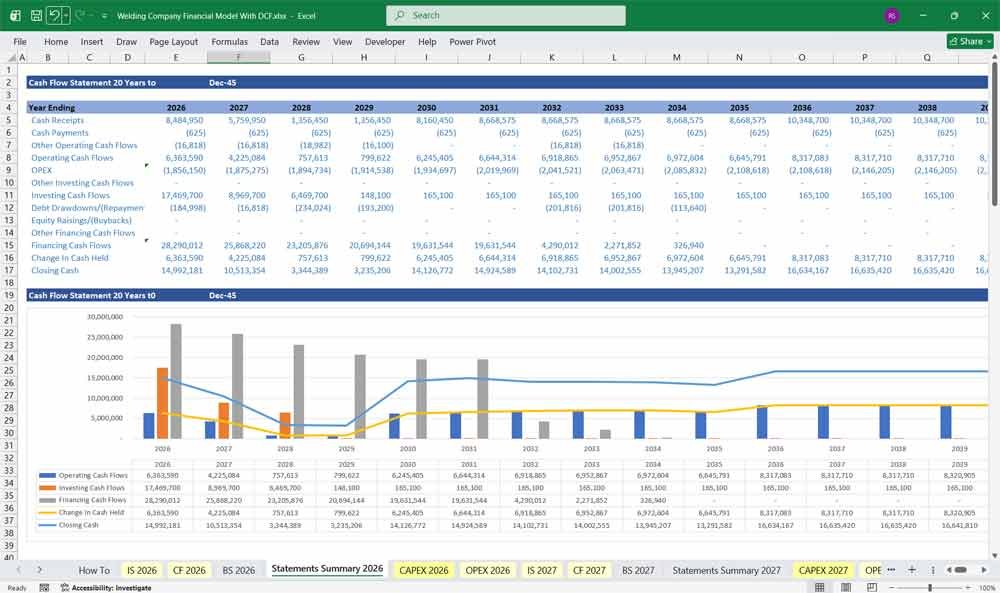
Value Your Welding Company With A DCF
20-Year DCF: Valuing Skilled Labor Capacity and Contract Pipelines
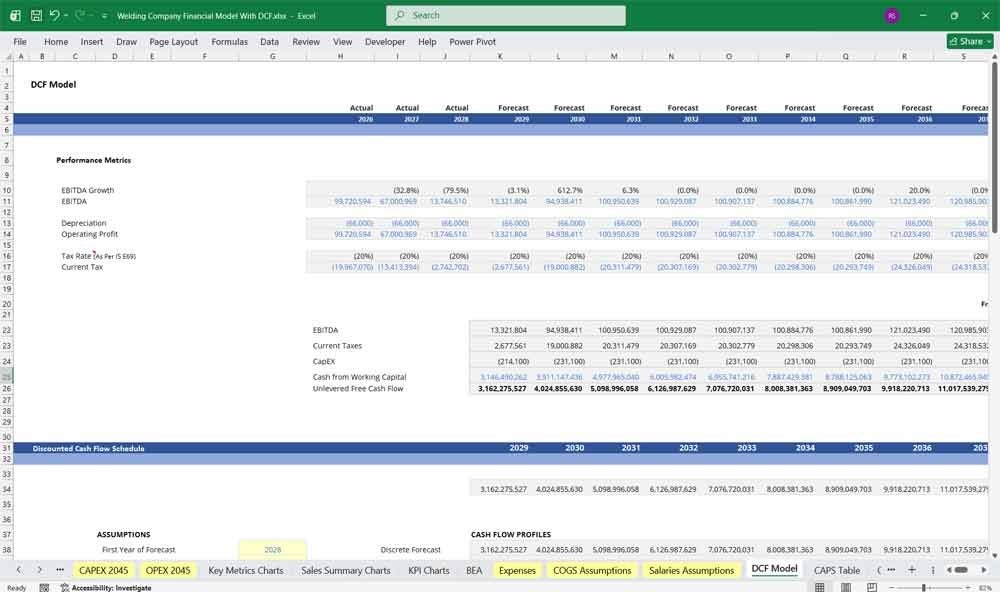
In a 20-year Discounted Cash Flow (DCF) analysis for a commercial or industrial welding company, the valuation centers on billable welder hours, project backlog density, and capital efficiency. The model projects cash flows driven by specialized fabrication, structural steel erection, and maintenance contracts, balanced against CapEx for multi-process welding power sources, CNC plasma cutting tables, rig trucks, and safety ventilation systems. Unlike pure asset-heavy manufacturers, the business is constrained by certified labor availability, meaning cash flow growth depends on labor utilization rather than unconstrained machine capacity. A 5-year horizon aligns with typical infrastructure and commercial project funding cycles, with the Terminal Value reflecting the firm’s brand reputation, safety record (EMR rating), and ability to win recurring industrial maintenance retainers.
WACC: Pricing Cyclical Construction Risk and Labor Dependency
The Weighted Average Cost of Capital (WACC) for a welding company typically sits between 9.5% and 13%, positioning it as a middle-market specialty trade contractor. Because the business owns tangible machinery, vehicle fleets, and real estate fabrication shops, it can secure moderate levels of asset-backed debt, which keeps borrowing costs grounded. However, the Cost of Equity carries a premium for “Construction and Cyclical Beta.” In the 2026 industrial market, investors require a higher hurdle rate to shield future cash flows from the cyclical volatility of commercial real estate, fluctuating raw steel prices, and severe structural shortages of AWS-certified welders, which can drive up labor costs faster than contracts can be re-priced.
Sensitivity Analysis: Stress-Testing Labor Margins and Project Delays
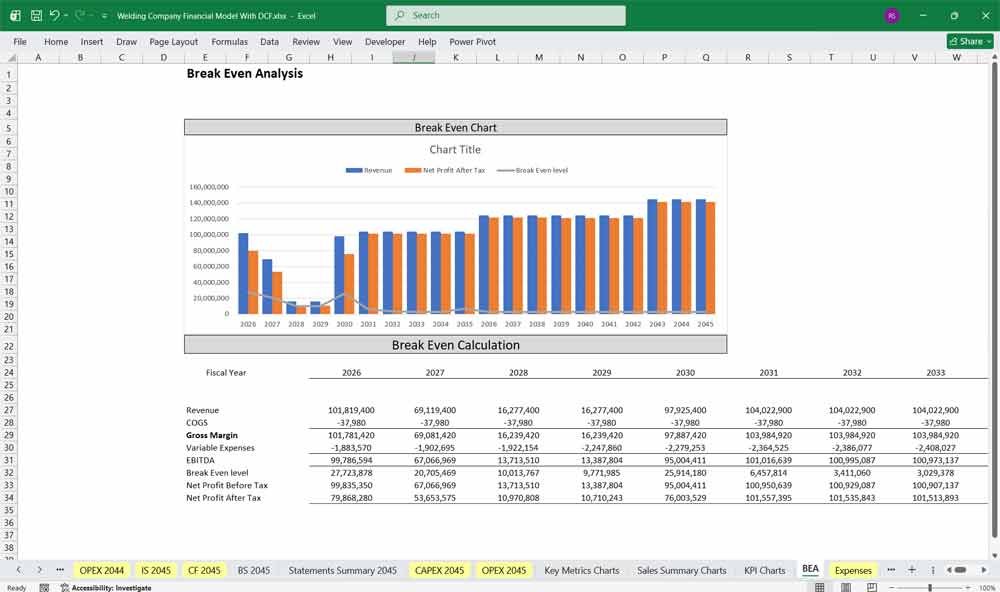
For a welding business, Sensitivity Analysis is the primary tool for measuring resilience against margin compression and project schedule slippage. Financial analysts build sensitivity matrices to observe how a 10% increase in structural steel or gas consumables costs or a 15% overrun in project labor hours impacts the company’s free cash flow and EBITDA margins. The most critical variables to cross-reference are Billable Welder Utilization % and the Gross Labor Margin (billable rate minus fully burdened welder pay). Because shop overhead, equipment depreciation, and insurance remain fixed, a small drop in productive billable hours or a spike in unbillable rework can rapidly consume net profitability. The sensitivity table highlights the exact operational threshold needed to remain profitable during a local construction slowdown.
Final Notes on the Financial Model
This 20 Year Welding Company Financial Model Excel Template focuses on balancing capital expenditures with steady revenue growth from a diversified services. By optimizing operational costs, and power efficiency, and maximizing high-margin services, the models ensure sustainable profitability and cash flow stability.