
3D Printing Financial Model Template
This 3D Printing Manufacturer Financial Model Template is a fully integrated Excel template for founders, investors and lenders planning an additive manufacturing business. It covers a 3-year construction phase and 5 years of operations, all monthly with annual roll-ups. It links revenue, production capacity, cost of goods sold, capex, working capital, debt and the three financial statements in one model. Whether you are launching a 3D printing service bureau, scaling a contract manufacturing plant or raising money for a metal additive facility, this model turns your assumptions into investor-ready projections in USD.
Looking for a CNC net shape parts model.
Financial Model for a 3D Printing (Additive Mfg) Manufacturer
Unlike generic startup templates, this 3D printing business plan financial model is built around how additive manufacturing actually works. Revenue is driven by machine fleet, available machine hours, utilisation, print success rates, parts per build and scrap rates across nine technologies: FDM, SLA, SLS, MJF, DMLS, SLM, Binder Jetting, DED and ceramic printing. Material consumption, powder recovery, electricity, inert gas, post-processing, quality costs and outsourced production are all modelled, so you can see your real gross margin per part, per build and per machine hour.
Every hard-coded input sits on one Assumptions tab, and every date updates automatically when you change the model start date. The workbook includes five switchable scenarios (Base, Upside, Downside, Management and Custom), sensitivity and two-variable tables, a KPI dashboard with charts, a funding shortfall analysis and a checks tab that confirms the balance sheet balances in every period. It is formatted to professional banking standards, with colour-coded inputs, formulas and links, so it is ready to share with investors, banks and equipment financiers.
What’s Inside: Tab-by-Tab Overview
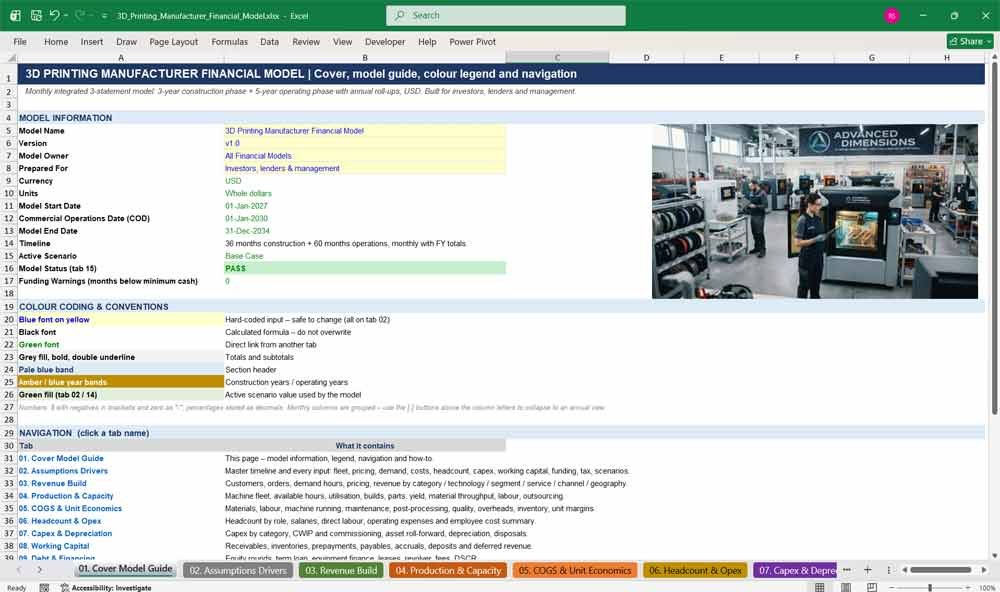
01. Cover Model Guide
The cover page shows the model name, version, currency, units, owner, key dates and live model status. Clickable navigation links to all fifteen tabs, a colour-coding legend and step-by-step instructions help any user understand and run this 3D printing financial model quickly.
- Model information panel with start date, COD and end date
- Live PASS / REVIEW integrity status and funding warning count
- Hyperlinked navigation to every tab
- Colour legend for inputs, formulas, links and totals
- Six-step “how to use” guide
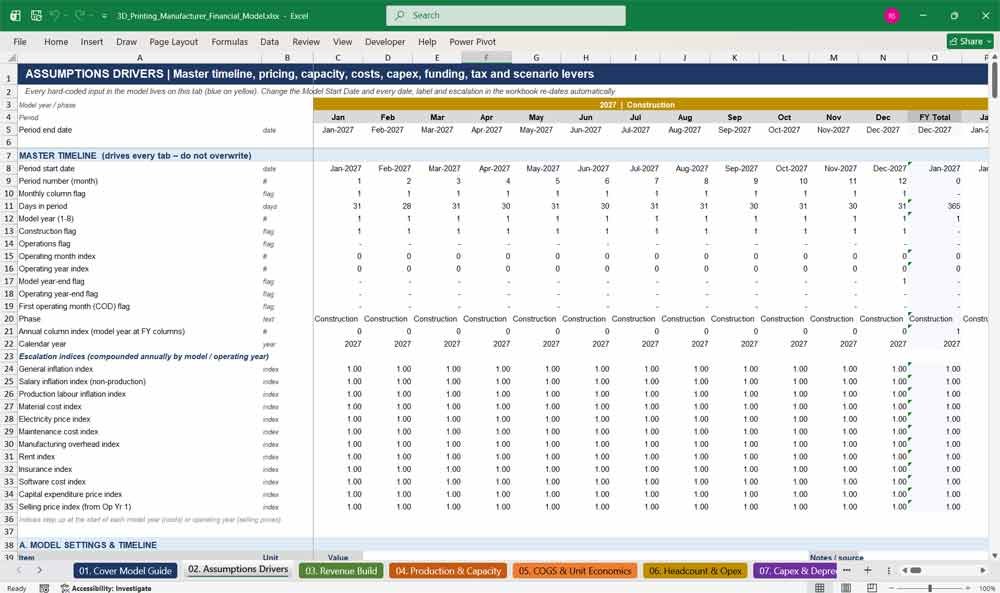
02. Assumptions Drivers
All inputs for the 3D printing business sit in one place: machine fleet, pricing, demand, utilisation, scrap rates, material costs, salaries, capex, working capital, funding and tax. Change the start date once and every timeline, label and inflation index updates.
- Master timeline driven by a single Model Start Date
- Per-technology inputs for nine printing technologies
- Headcount and salary plan for 16 roles across 8 years
- Funding inputs: equity rounds, term loan, equipment finance, leases, revolver
- Five-column scenario matrix with an active scenario selector
3D Printing Manufacturer Revenues & Expenses
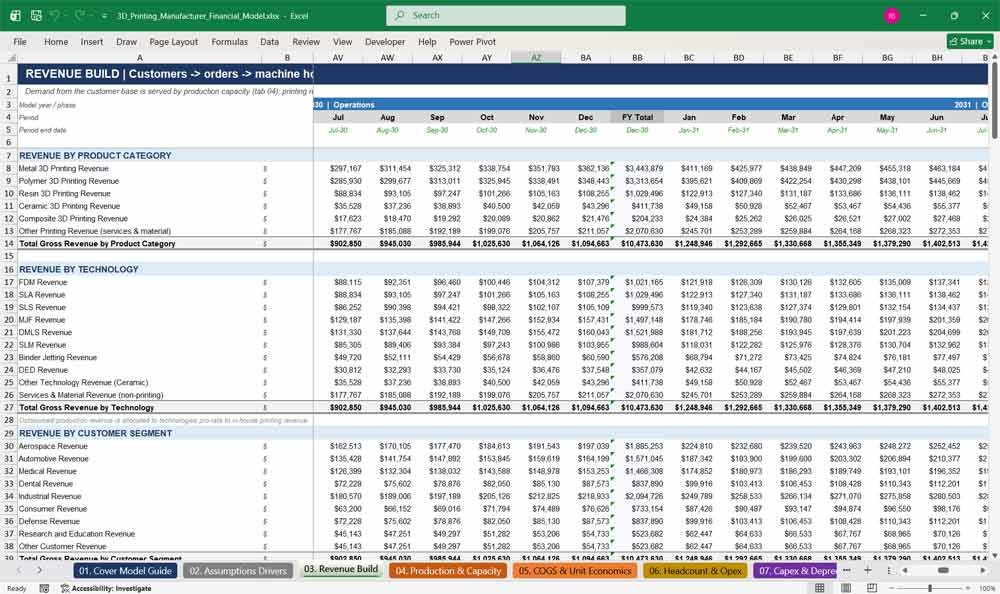
03. Revenue Build
Revenue is built from customers, orders and machine hours demanded, then priced per part, per dedicated build or per machine hour. Revenue is broken down by product category, printing technology, customer segment, service type, sales channel and geography, with net revenue after discounts.
- Customer acquisition, retention and active-customer forecasting
- Pricing drivers: price per part, build, machine hour, kilogram and order
- Revenue by metal, polymer, resin, ceramic and composite printing
- Breakdowns by aerospace, automotive, medical, dental, defence and more
- Revenue growth analysis and recurring revenue percentage
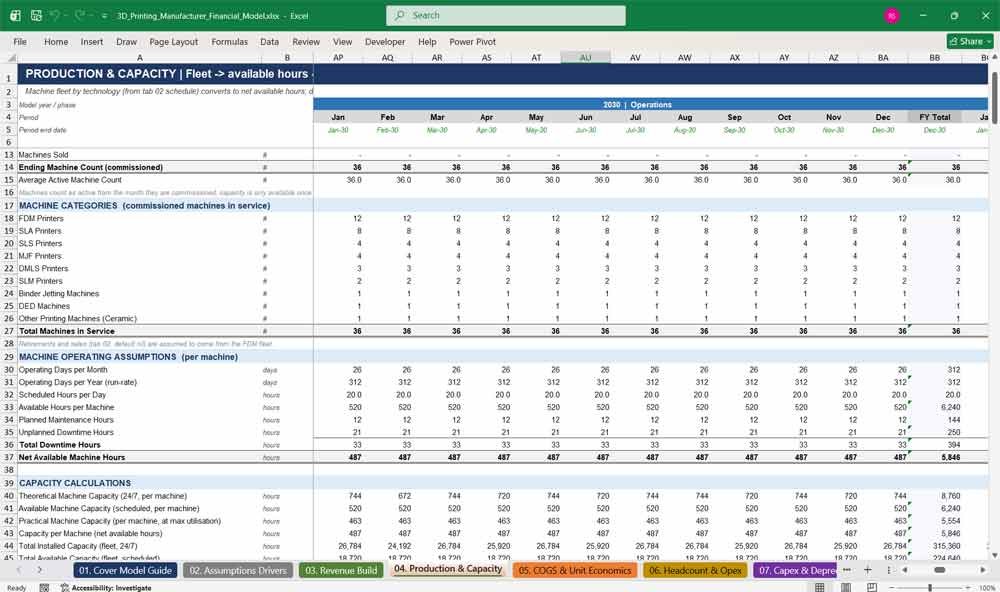
04. Production & Capacity
This tab turns the printer fleet into real production capacity. It models machine hours, downtime, target and actual utilisation, builds, parts, yield, material throughput, labour capacity, outsourced production and capacity expansion, so you can spot bottlenecks early.
- Machine fleet roll-forward and machines in service by technology
- Theoretical, available, practical and effective capacity calculations
- Print success rate, first pass yield, scrap and rework rates
- Material input, recovery, reuse and waste in kilograms
- Capacity constraint indicator and outsourced production logic
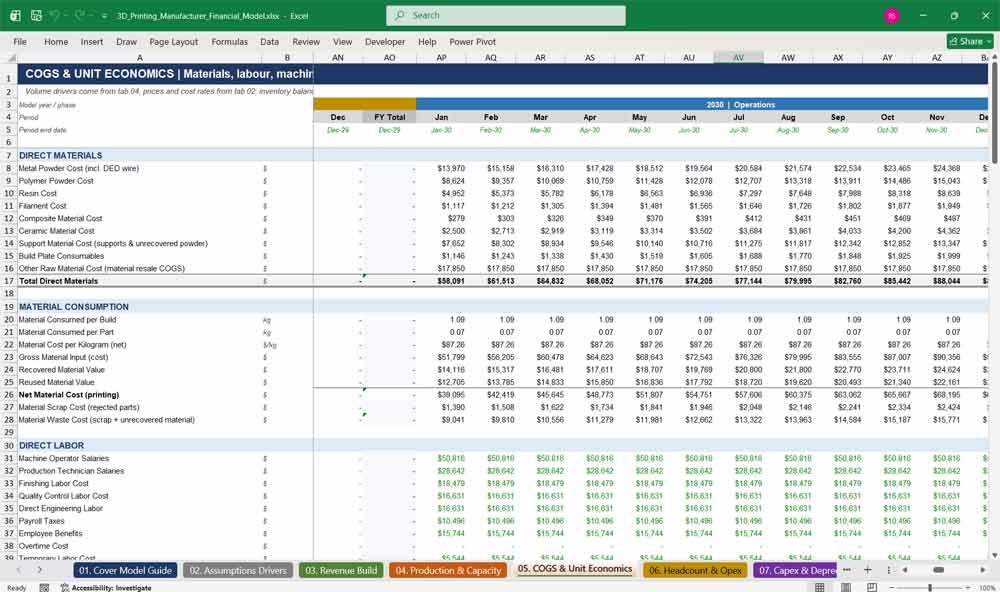
05. COGS & Unit Economics
A detailed additive manufacturing cost of goods sold build covering metal and polymer powder, resin, filament, labour, electricity, inert gas, maintenance, post-processing, quality, overheads and outsourcing. It calculates cost and gross profit per part, build, kilogram and machine hour.
- Direct material costs by material type, with powder recovery credits
- Machine running and maintenance costs linked to fleet and hours
- Post-processing: heat treatment, CNC, support removal, polishing, coating
- Inventory adjustments from raw materials, WIP and finished goods
- Fully loaded cost per part and gross margin per part, build and hour
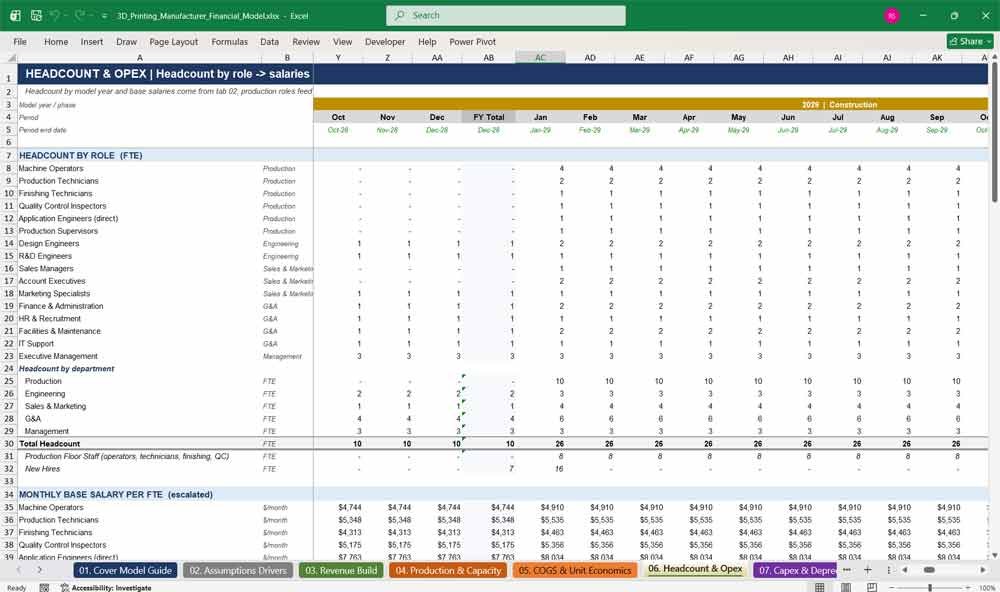
06. Headcount & Opex
This tab plans headcount by role, including operators, technicians, engineers, sales, finance and management, with escalating salaries, payroll taxes, benefits, overtime and temporary labour. Production staff costs flow to COGS, and all other operating expenses build up to a complete opex forecast.
- Headcount by role and department for every model year
- Direct labour split for COGS, with an overtime calculation
- Pre-operating staff costs during construction
- Sales commissions, marketing, R&D, rent, insurance and software
- Employee cost summary by function
07. Capex & Depreciation
The capex schedule covers printers, post-processing equipment, CNC machines, furnaces, inspection and scanning equipment, factory fit-out and IT. It tracks construction work in progress, machine commissioning, the asset roll-forward, straight-line depreciation, disposals, and maintenance and replacement capex for your additive manufacturing plant.
- 18 capital expenditure categories with installation, shipping and commissioning costs
- CWIP and commissioning timing linked to machine delivery dates
- Useful life assumptions and residual values
- Depreciation roll-forward and net fixed assets
- Maintenance versus growth capex split
3d Printing Manufacturer Financial Statements
08. Working Capital
This tab forecasts receivables, raw materials, work in progress and finished goods inventory, spare parts, prepayments, payables, accruals, customer deposits and deferred revenue on a days basis. Movements feed the cash flow statement, showing the true cash impact of growth.
- Customer and supplier payment days, adjustable by scenario
- Inventory days for raw materials, WIP and finished goods
- Customer deposits and deferred revenue billed in advance
- Net working capital and operating working capital
- Warranty provision calculation
09. Debt & Financing
The funding schedule covers equity rounds, a construction term loan, equipment financing for expansion printers, leases on right-of-use printers and a revolving credit facility that keeps cash above the minimum balance. It is ideal for capital-intensive 3D printing machine investment and lender presentations.
- Four equity rounds with share capital and share premium split
- Term loan with grace period, straight-line or annuity repayment
- Equipment finance and lease liability schedules
- Automatic revolver draw and repayment to protect minimum cash
- Debt service coverage ratio (DSCR) and net debt
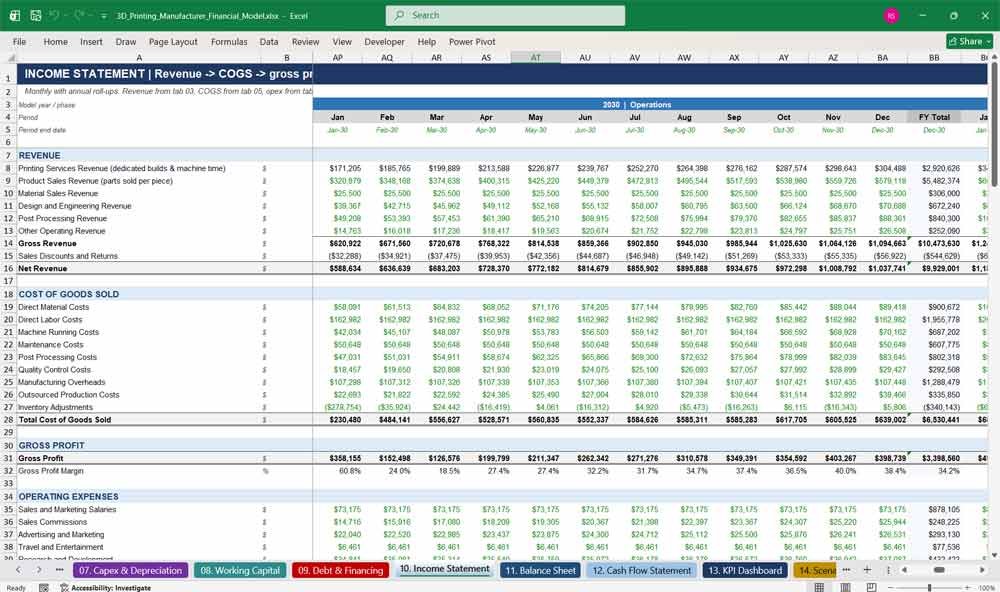
10. Income Statement
A monthly and annual profit and loss statement running from revenue through gross profit, EBITDA, EBIT, finance costs, tax and net income. It includes tax loss carry-forward, deferred tax and a break-even analysis showing the revenue needed to cover fixed costs.
- Revenue split between printing services, product sales, materials and services
- Full COGS and operating expense detail
- EBITDA, EBIT and net income margins
- Tax losses carried forward and deferred tax
- Break-even revenue and first EBITDA-positive month
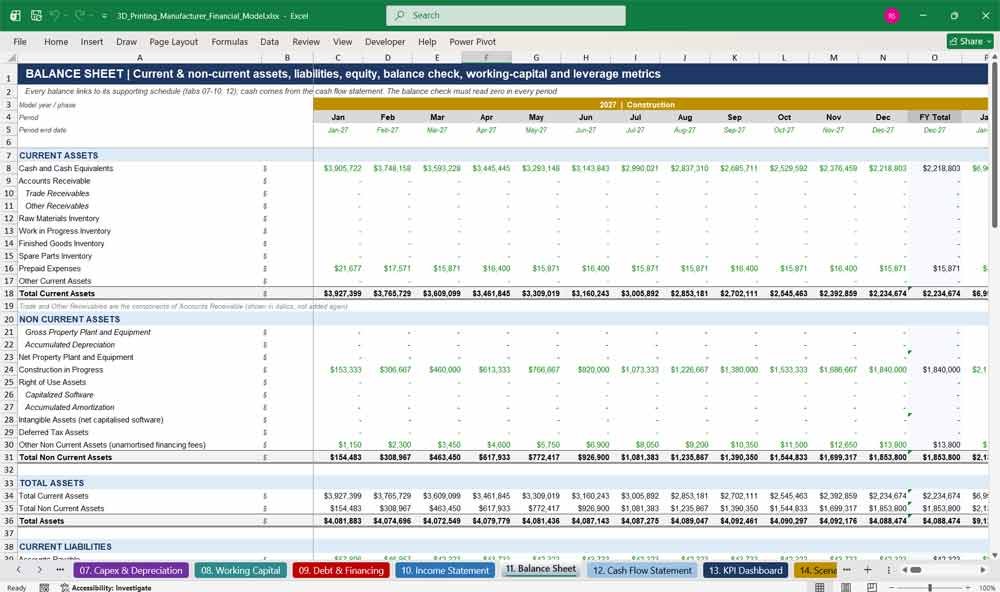
11. Balance Sheet
A fully linked balance sheet showing cash, receivables, inventories, property, plant and equipment, construction in progress, right-of-use assets, payables, debt, leases and shareholders’ equity. A balance check confirms it balances every month, with working capital, liquidity, leverage and return metrics.
- Current and non-current assets and liabilities
- Retained earnings and current-year net income roll-forward
- Balance sheet check in every period
- Current ratio, quick ratio and debt to equity
- Return on assets, return on equity and ROIC
12. Cash Flow Statement
An indirect cash flow statement covering operating, investing and financing activities, reconciled to closing cash every month. Liquidity analysis shows the minimum cash requirement, funding surplus or shortfall, cash burn and runway, all essential for planning 3D printing startup funding.
- Working capital movements and non-cash adjustments
- Capex by equipment category in investing activities
- Equity, debt, equipment finance and lease cash flows
- Cash runway and average monthly burn
- Free cash flow, cash conversion and DSCR
Key Financial Metrics for a 3D Printing Manufacturer
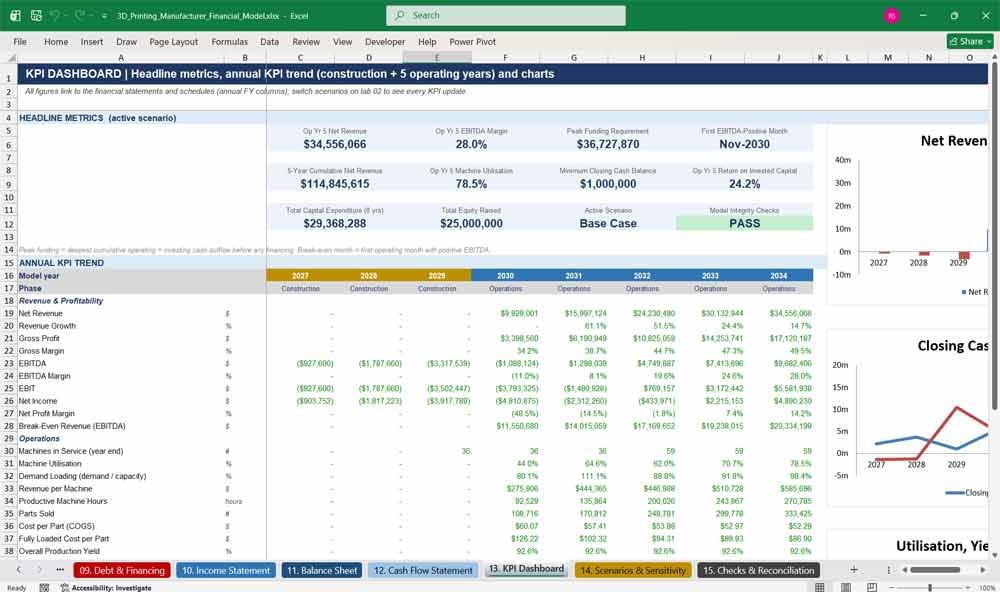
13. KPI Dashboard
An at-a-glance dashboard of headline metrics and annual KPI trends for the 3D printing manufacturer: revenue, margins, EBITDA, machine utilisation, revenue per machine, cost per part, yield, cash, net debt, DSCR and ROIC, with charts ready for pitch decks.
- Twelve headline metric tiles, including peak funding requirement
- Eight-year annual KPI trend table
- Revenue vs EBITDA, cash vs net debt and utilisation charts
- Break-even month and minimum cash balance
- Live model integrity status
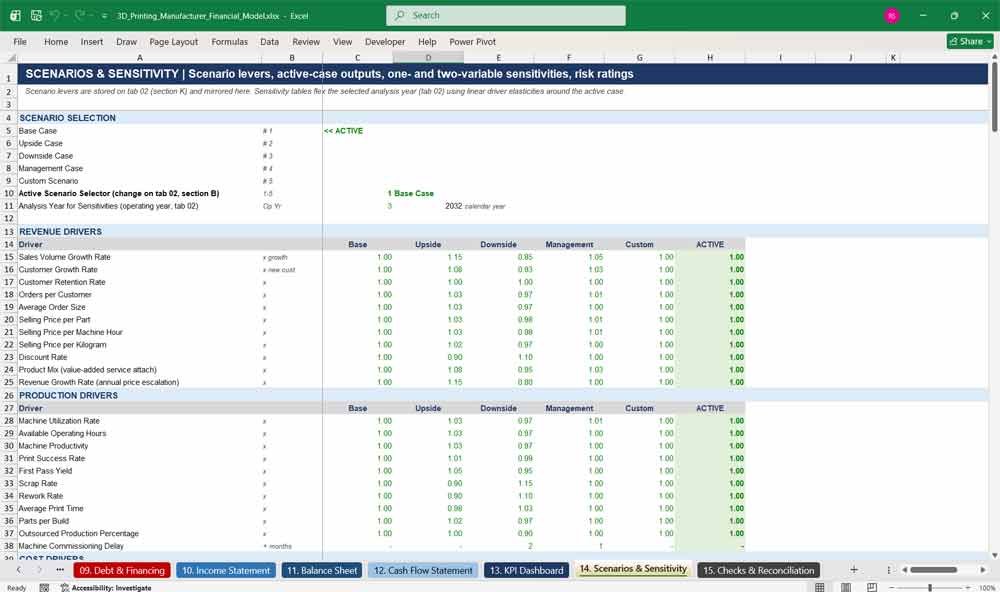
14. Scenarios & Sensitivity
Test Base, Upside, Downside, Management and Custom cases across demand, pricing, utilisation, material costs, yield, capex, machine delivery delays and financing. Sensitivity tables, two-variable grids and a risk rating matrix show how EBITDA, cash and funding needs respond to key assumptions.
- More than 60 scenario levers across seven driver groups
- Scenario output table for each operating year
- One-variable sensitivity for price, volume, utilisation, scrap and more
- Eight two-variable sensitivity tables (EBITDA, margin, cash, DSCR)
- Risk analysis with Low, Medium and High ratings
15. Checks & Reconciliation
The integrity tab tests every period automatically: balance sheet balance, cash reconciliation, revenue breakdown tie-outs, COGS, fleet, fixed assets, debt and equity roll-forwards. Failed checks are highlighted red, and a master PASS flag gives users confidence in every number in the model.
- 20 period checks with a master PASS / REVIEW status
- Input integrity checks, such as mix percentages totalling 100%
- Funding shortfall and negative cash warnings
- Red / green conditional formatting
- Status linked to the Cover and the KPI Dashboard
Why Buy This Model
Building a credible financial model for a 3D printing company from scratch takes weeks and needs both financial modelling skill and an understanding of additive manufacturing operations. This template gives you both, ready to use. It links machine capacity, utilisation, yield and material use to revenue and margins, so your projections hold up when investors, banks and equipment lenders ask tough questions. You get a monthly, fully integrated three-statement model with a construction phase, funding plan, scenarios, sensitivities and automatic checks. Simply replace the illustrative assumptions with your own figures, and you’ll have a professional, investor-ready 3D printing business plan model in hours, not weeks.
3d Printing Frequently Asked Questions (Faq)
Is this model suitable for a 3D printing service bureau or only for manufacturers?
Both. The model handles parts sold per piece, dedicated builds and machine-time contracts, plus engineering, post-processing and material resale. That makes it suitable for service bureaus, contract manufacturers, in-house production plants and specialist metal additive businesses.
Which 3D printing technologies are included?
Nine: FDM, SLA, SLS, MJF, DMLS, SLM, Binder Jetting, DED and an “Other” column set up for ceramic printing. Each technology has its own machine count, price, print time, parts per build, success rate, scrap rate, material cost and selling prices.
Can I remove technologies I don’t use?
Yes. Set the number of machines for that technology to zero and it drops out of capacity, revenue, costs and capex automatically. You don’t need to delete any rows or rewrite any formulas.
What period does the model cover?
It covers a 3-year construction phase (2027 to 2029 by default) and 5 years of operations (2030 to 2034). Every year is monthly, with an annual total column, so it works for both detailed cash planning and annual investor summaries.
How do I change the start date?
Change the Model Start Date on the Assumptions Drivers tab. Every date, year label, month header, inflation index and timing calculation across all fifteen tabs updates automatically.
I’m not a financial modeller. Is it easy to use?
Yes. All inputs are on one tab, shown in blue on a yellow background, and everything else calculates automatically. The cover page includes navigation links, a colour legend and a step-by-step guide, and the checks tab confirms the model is working correctly.
Does it include a balance sheet and cash flow statement?
Yes. It is a fully integrated three-statement model, with an income statement, balance sheet and cash flow statement. The balance sheet balances in every month, and closing cash reconciles to the cash flow statement.
Will it show how much funding I need to raise?
Yes. The model calculates your peak funding requirement, minimum cash balance, cash runway and any funding shortfall against your minimum cash requirement. You can then adjust equity rounds, debt and revolver limits until the funding plan works.
Can I model equipment loans and leasing for my printers?
Yes. You can fund printers through a construction term loan, equipment finance for expansion machines, leases recognised as right-of-use assets, and a revolving credit facility. Interest, repayments, current and non-current balances and DSCR are all calculated for you.
How are scenarios and sensitivities handled?
Choose Base, Upside, Downside, Management or Custom with one selector, and the whole model recalculates. The Scenarios & Sensitivity tab also shows one-variable and two-variable sensitivity tables, scenario outputs by year and a risk rating matrix.
Does the model account for scrap, failed builds and powder recycling?
Yes. It models print success rates, scrap and rework rates, failed build costs, and material recovery and reuse for powder-bed technologies. These feed directly into parts produced, material costs and quality costs.
What happens if demand is higher than my machine capacity?
The model caps in-house production at your target utilisation, outsources part of the excess demand up to a partner capacity limit, and flags unserved demand. The capacity constraint indicator shows when you need to add more machines.
Is the data in the model real market data?
No. The model comes with illustrative assumptions so you can see how everything works. You should replace them with your own quotes, pricing and market research before presenting the model to investors or lenders.
Which currency does the model use?
The model is in US dollars by default. The calculations work in any currency, so you can enter your own figures in GBP, EUR or another currency and update the currency label on the Assumptions tab.
Which software do I need?
The model is built for Microsoft Excel and uses standard Excel functions, with no macros or VBA. Monthly columns are grouped, so you can collapse the model to an annual view in one click.
Can I use this model in my business plan or investor pitch deck?
Yes. The KPI dashboard, charts, financial statements and scenario outputs are designed to drop straight into business plans, pitch decks, bank loan applications and board reports.
Final Notes on the Financial Model
5 Year Financial model for a 3D Printing manufacturer
- Scenario Analysis: Create best-case, base-case, and worst-case projections.
- Break-even Analysis: Determine sales volume required to cover fixed & variable costs.
- Sensitivity Analysis: Assess how changes in raw material costs, pricing, or demand impact profitability.
This structured model, along with other financial templates, helps a 3D manufacturing service address a broad market spectrum, offering the right balance between cost, production capacity, support, and customization at each subscription level.