
Chemical Financial Model Template
Building a reliable chemical manufacturer financial model template in Excel is difficult because chemicals are a capacity-driven, feedstock-sensitive business. This 19-tab integrated model links plant capacity, utilisation and yield to production volumes, sales revenue and raw-material cost, then flows the results through a full income statement, balance sheet and cash flow statement. It gives finance teams, lenders, investors and advisers a single, transparent forecasting tool for specialty and commodity chemical operations.
Financial Model for a Chemical Manufacturer
The workbook combines five years of monthly historicals with a ten-year forecast: years one to five are monthly with an annual roll-up column, and years six to ten are annual. Every date, year label and inflation escalation is driven by one Model Start Date on the Assumptions tab. With 60 SKUs aggregated into 15 product families and 20 revenue categories, plus 12 raw materials, six utilities and a nine-project capex register, the model captures the operating detail that determines margins, cash flow and debt capacity.
Built to bankable-model standards, the template includes colour-coded inputs, days-based working capital, a revolver and cash sweep with no circular references, and a Checks tab that flags any break in the model. A Base, Upside and Downside scenario selector, sensitivity tables and a DCF valuation with trading and transaction comparables support budgeting, project finance, fundraising, M&A and lender presentations. All company data is illustrative, so you can replace it with your own actuals and start forecasting immediately.
Tab-by-Tab Overview
01. Cover Control
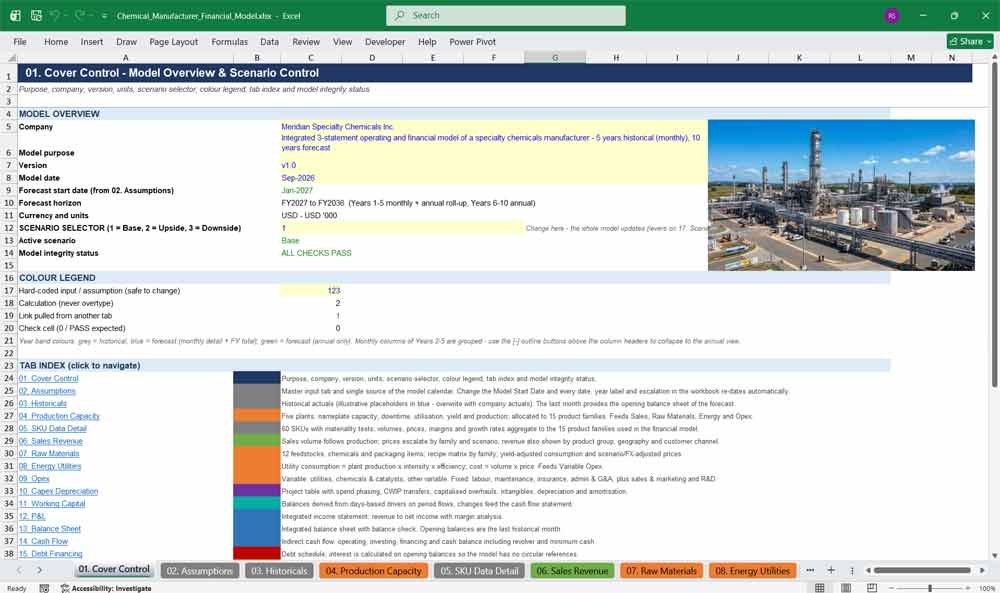
The Cover Control tab is the command centre of this chemical manufacturer financial model. Switch between Base, Upside and Downside scenarios, monitor live integrity status, use a hyperlinked tab index, and review headline revenue, EBITDA, cash flow and leverage outputs.
- Scenario selector that updates the whole model instantly
- Live “ALL CHECKS PASS” integrity status
- Hyperlinked tab index with colour-coded tabs
- Headline outputs table across all ten forecast years
- Colour legend for inputs, calculations and links
02. Assumptions
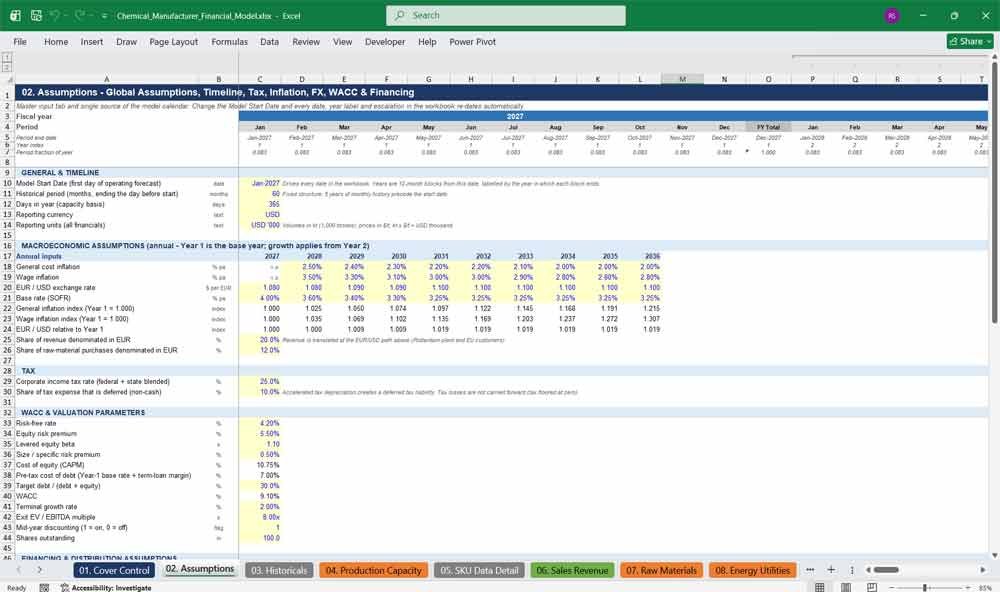
The Assumptions tab holds every key driver in one place. Change the Model Start Date and the calendar, year labels and escalations update automatically. Macro tables for inflation, wages, FX and interest rates sit beside tax, WACC and financing inputs.
- One start date drives every date in the workbook
- Annual inflation, wage, FX and SOFR tables with derived indexes
- Tax, WACC, debt margin and minimum cash inputs
- Blue-on-yellow input cells clearly separate assumptions from formulas
Chemical Manufacturer Revenues & expenses
03. Historicals
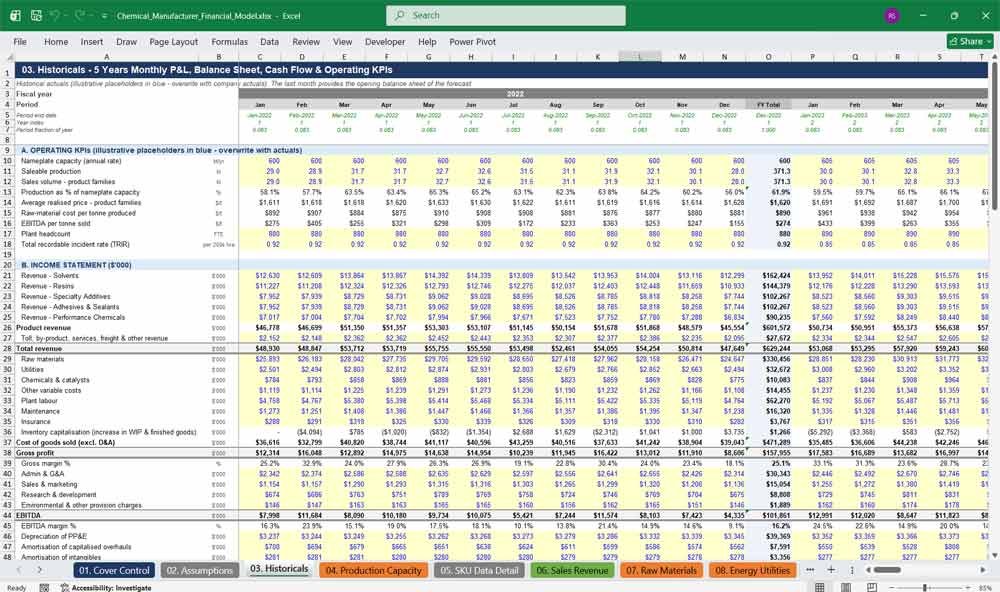
The Historicals tab provides five years of monthly financial history covering the income statement, balance sheet and derived cash flow. Illustrative data is pre-loaded and fully reconciles, so you can overwrite it with actuals and immediately benchmark forecast performance accurately.
- 60 months of P&L, balance sheet and cash flow data
- Built-in balance sheet and cash reconciliation checks
- Opening forecast balances link to the last historical month
- Placeholder figures ready to replace with company actuals
04. Production Capacity
The Production Capacity tab is the heart of the operating model. Nameplate capacity multiplied by utilisation and yield produces saleable tonnes per plant, adjusted for turnarounds, routine downtime and new capacity from the capex register, then allocated across product families.
- Five plants modelled with capacity × utilisation × yield
- Turnaround, routine and unplanned downtime built in
- Capacity additions driven by the capex project register
- Production allocated to 15 product families
05. SKU Data Detail
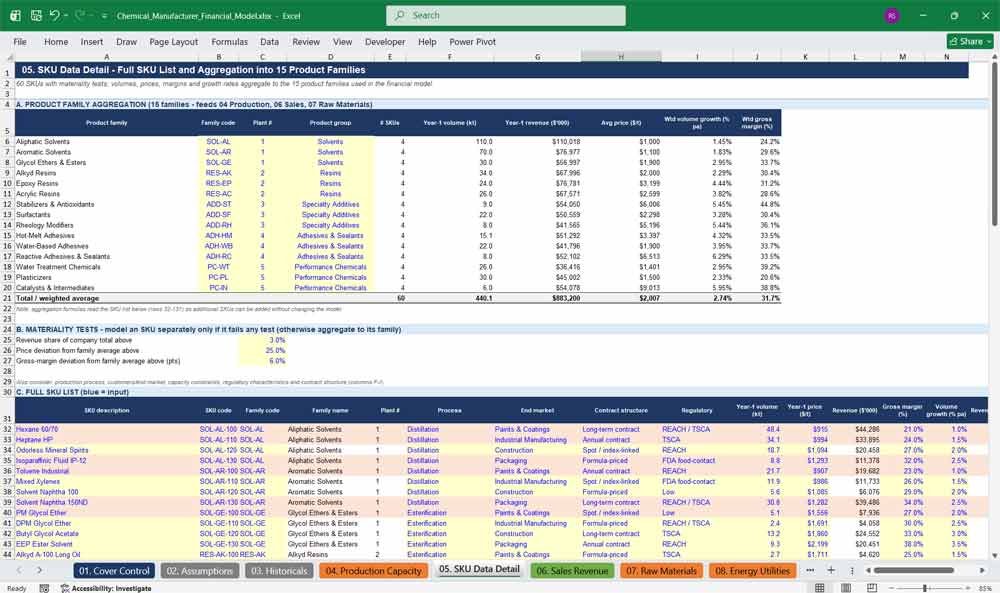
The SKU Data Detail tab stores the full product list and aggregates 60 SKUs into 15 product families. Materiality thresholds show which SKUs justify separate modelling, keeping the sales forecast detailed where it matters and simple where it does not.
- 60 SKUs mapped to 15 product families and five product groups
- Volume, price and revenue detail by SKU
- Materiality tests to decide which SKUs to model individually
- Tie-out check between SKU totals and family aggregation
06. Sales Revenue
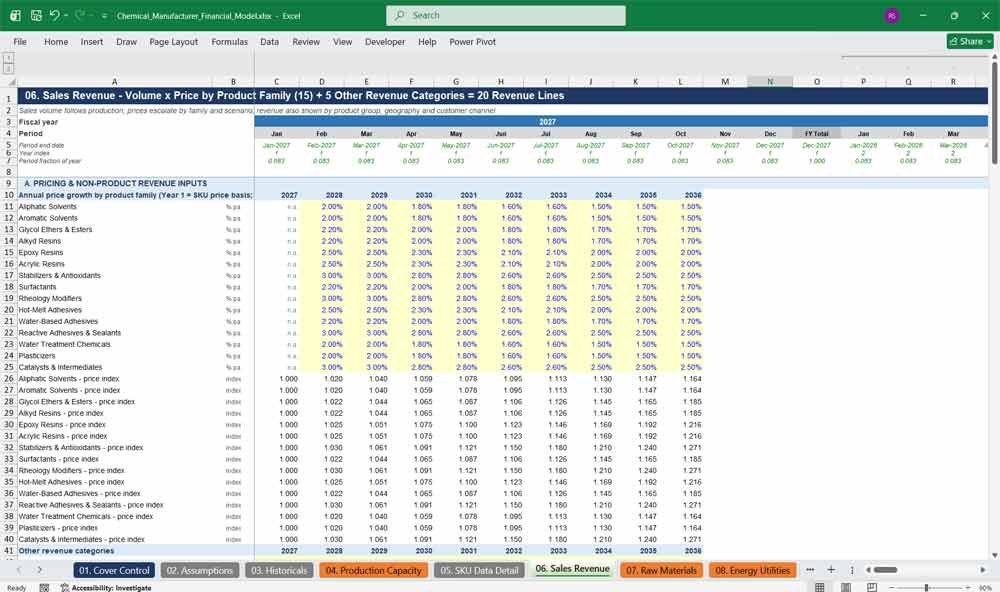
The Sales Revenue tab converts production into revenue using sales volume multiplied by price. Prices escalate by product family and scenario, and revenue appears across 20 categories, including toll manufacturing, by-products, technical services, licensing and freight recharges, with geography splits.
- 15 product-family revenue lines plus five other revenue categories
- Price growth and index by product family
- Revenue splits by product group, geography and customer channel
- Reconciliation to the income statement in every period
07. Raw Materials
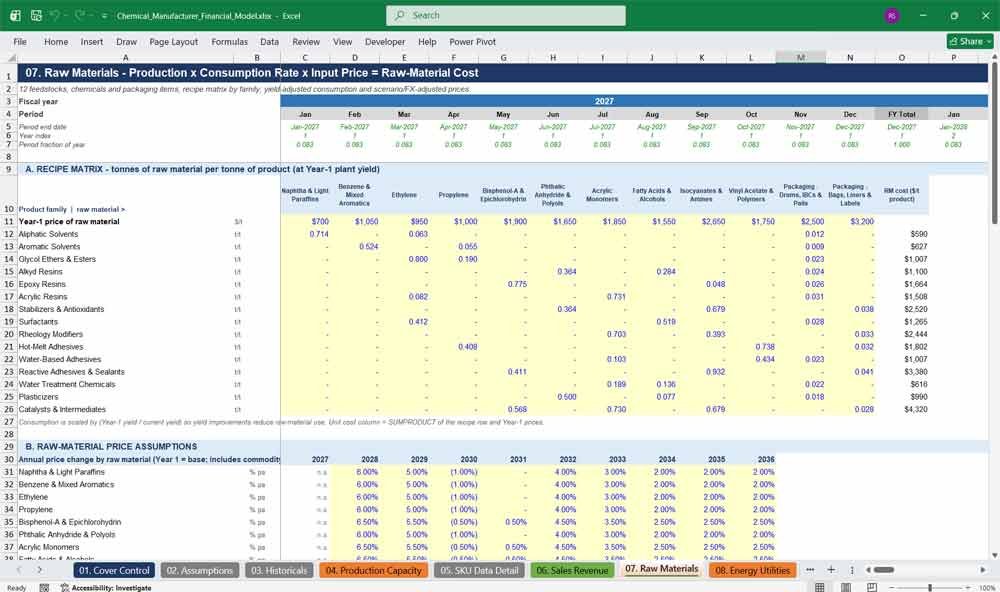
The Raw Materials tab multiplies production volume by recipe consumption rates and input prices to calculate raw-material cost. A product-family recipe matrix, FX-adjusted feedstock prices and yield effects show how commodity movements change margins, cost per tonne and material spread.
- 12 feedstocks, chemicals and packaging items
- Recipe matrix linking each product family to inputs
- Commodity price growth, FX and scenario adjustments
- Raw-material cost per tonne, percentage of revenue and material spread
08. Energy Utilities
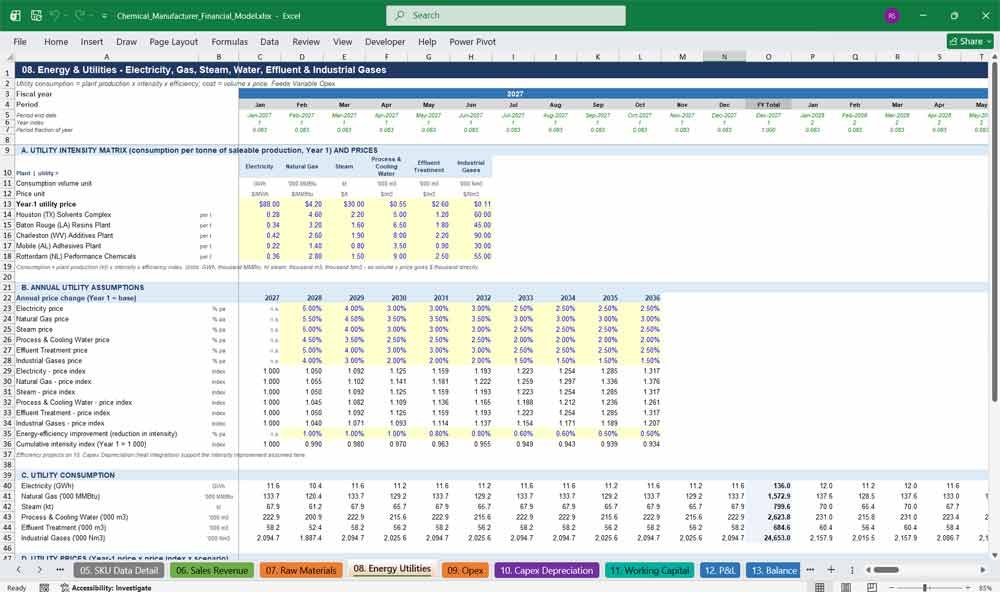
The Energy Utilities tab models six utilities, including electricity, natural gas, steam and process water, using a plant-by-utility intensity matrix. Consumption per tonne, utility prices and scenario shocks produce total energy cost, cost per tonne and energy share of revenue.
- Six utilities with plant-specific intensity rates
- Consumption driven by actual production volumes
- Utility price escalation and scenario overlays
- Energy cost per tonne and as a percentage of revenue
09. Opex
The Opex tab separates variable costs (utilities, chemicals and catalysts, other variable) from fixed costs (labour, maintenance, insurance, admin and G&A). Headcount, wage inflation and unit-cost metrics reveal how operating leverage and plant utilisation influence EBITDA across every forecast period.
- Variable and fixed cost structure clearly separated
- Headcount and wage-indexed labour cost
- Maintenance, insurance, G&A, sales and R&D lines
- Total opex per tonne produced
10. Capex Depreciation
The Capex Depreciation tab tracks a nine-project register with phased spend and commissioning dates, plus maintenance, growth, environmental, efficiency and turnaround capex. Construction-in-progress transfers, gross PP&E and depreciation schedules feed the balance sheet and income statement automatically every single period.
- Project register with phasing, cost and added capacity
- Five capex categories, including capitalised turnarounds
- CWIP and gross PP&E roll-forwards
- Depreciation and amortisation schedules
Chemical Manufacturer Financial Statements
11. Working Capital
The Working Capital tab uses a days-based approach to calculate receivables, raw-material, WIP and finished-goods inventory, spares, payables and accruals. It converts operating activity into cash, tracks net working capital balances, and links directly to the cash flow statement automatically.
- Receivable, inventory and payable days as drivers
- Raw-material, WIP, finished goods and spares inventory
- Accrued expenses, taxes and interest payable
- Net working capital and cash-flow movements
12. P&L
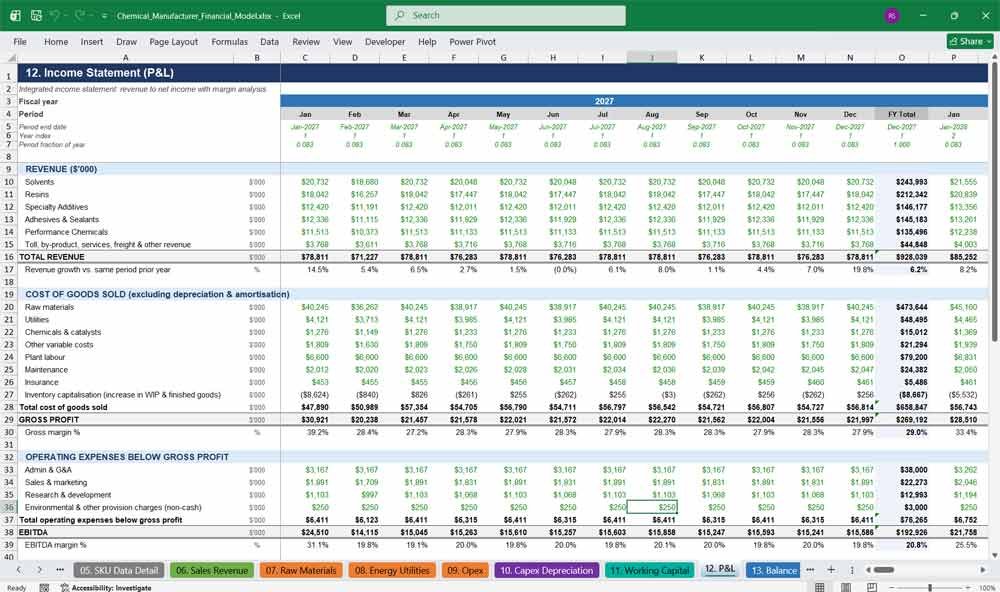
The P&L tab presents a complete income statement from revenue through cost of goods sold, gross profit, EBITDA, EBIT and net income. Margin percentages appear at every level, so profitability can be assessed quickly for any month or year shown.
- Revenue by product group and other categories
- COGS excluding depreciation and amortisation
- Gross, EBITDA, EBIT and net income margins
- Interest, tax and independent EBITDA cross-check
13. Balance Sheet
The Balance Sheet tab delivers a fully integrated statement of assets, liabilities and equity. Cash, working capital, fixed assets, debt and equity link directly to other tabs, and a Balance Check at the bottom confirms it balances in every period.
- Complete current and non-current asset and liability structure
- Equity roll-forward with dividends and retained earnings
- Debt and cash linked to the financing schedules
- Balance Check = Total Assets − Total Liabilities − Total Equity
14. Cash Flow
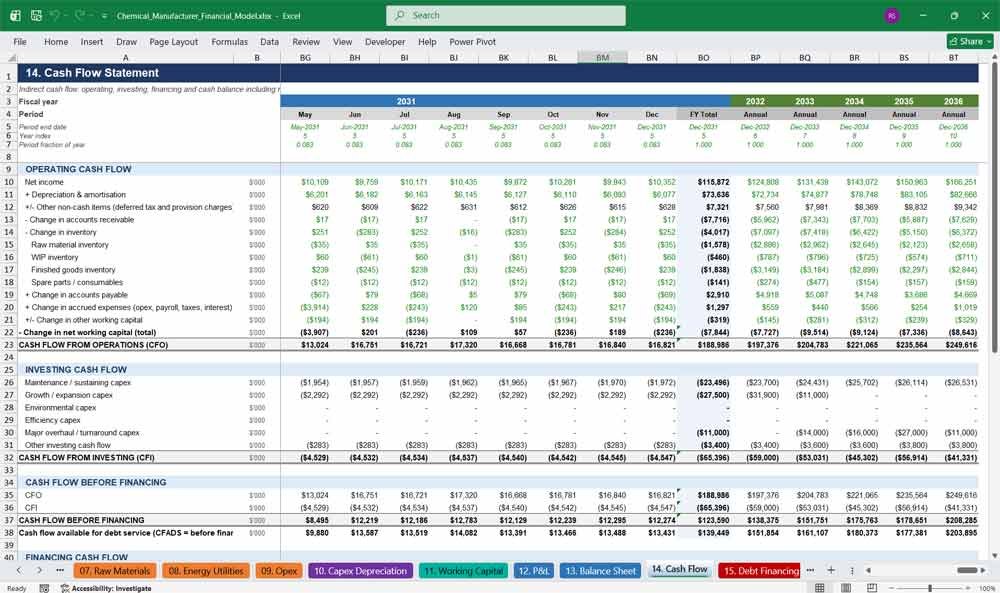
The Cash Flow tab reports operating, investing and financing cash flows, cash flow before financing and CFADS, then the closing cash balance. Minimum cash, revolver movements and excess cash reveal liquidity headroom, funding needs and debt capacity in every period.
- Indirect operating cash flow with working capital detail
- Investing cash flow by capex category
- Cash flow before financing and CFADS
- Cash balance with minimum cash, revolver and excess cash
15. Debt Financing
The Debt Financing tab manages a term loan and revolving credit facility. Mandatory repayments, optional prepayments, a cash sweep, commitment fees and interest on opening balances deliver realistic debt schedules and lender-ready metrics without any circular references or macros required.
- Term loan with amortisation, prepayment and sweep
- Revolver that draws automatically to protect minimum cash
- Interest expense and interest income calculations
- Total debt and net debt reconciled to the balance sheet
16. Financial KPIs
The Financial KPIs tab turns the three statements into decision-ready metrics. Track margins, unit economics per tonne, ROIC, ROE, ROA, leverage, interest cover, DSCR, cash conversion and working-capital days across every month and year of the entire forecast horizon shown.
- Gross, EBITDA and net margins with growth rates
- Revenue, raw-material and EBITDA per tonne
- ROIC, ROE and ROA
- Net debt/EBITDA, interest cover and DSCR
Key Financial Metrics for a Chemical Manufacturer
17. Scenarios Sensitivities
The Scenarios Sensitivities tab controls Base, Upside and Downside cases using seven levers: price, utilisation, raw materials, energy, opex, capex and receivable days. Overlays, comparison tables and tornado sensitivities quantify exactly which assumptions drive earnings, cash flow and enterprise value.
- Seven scenario levers plus user overlay column
- Side-by-side comparison of all three scenarios
- Tornado table showing EBITDA and enterprise value impact
- Live first-order sensitivity to 1% changes
18. Valuation
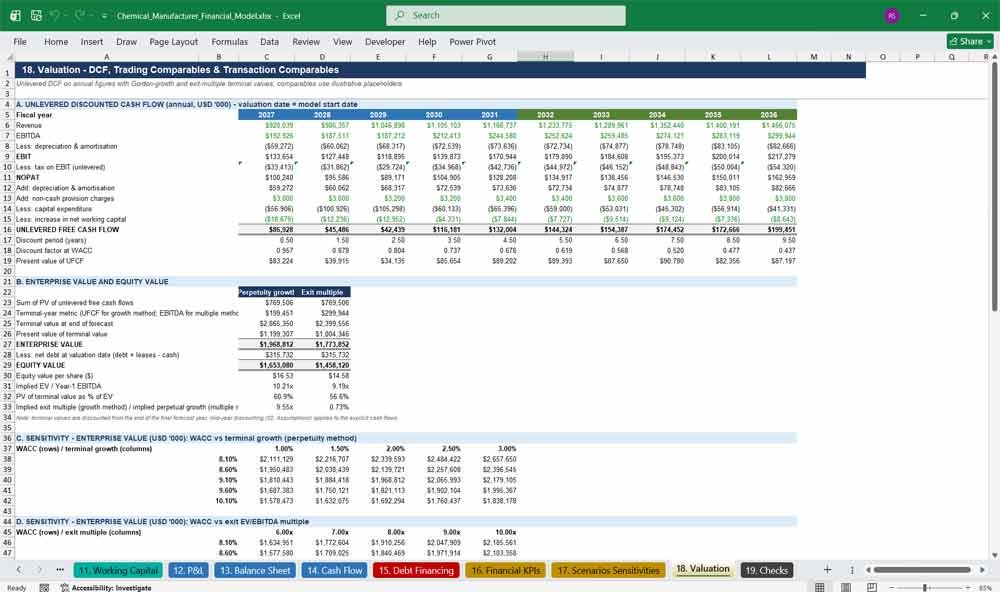
The Valuation tab calculates enterprise and equity value using a discounted cash flow with perpetuity growth and exit multiple methods. WACC sensitivity grids, trading comparables, transaction comparables and a football-field summary support fundraising, M&A, investor and lender discussions with confidence.
- Unlevered free cash flow DCF with mid-year discounting
- Perpetuity growth and exit multiple methods
- WACC versus growth and multiple sensitivity grids
- Trading and transaction comps templates (illustrative data)
19. Checks
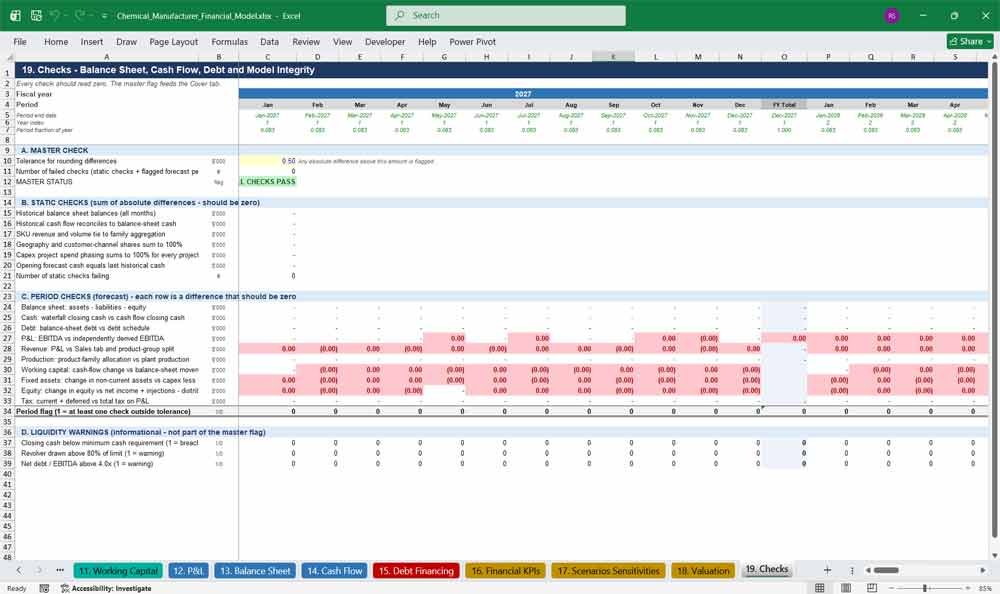
The Checks tab consolidates every integrity test into one master status. Balance sheet, cash, debt, revenue, production, working capital, fixed asset, equity and tax checks flag any period outside tolerance, giving reviewers, lenders and investors confidence in the model’s numbers.
- Master “ALL CHECKS PASS” status feeding the Cover tab
- Static and period-by-period reconciliation tests
- Adjustable rounding tolerance
- Informational liquidity and leverage warnings
Why Buy This Model
Most chemical company models are either generic three-statement templates that ignore plant economics, or one-off builds that only their author understands. This model starts from the physical business: capacity, utilisation, yield, recipes, energy intensity, turnarounds and capex projects, and only then turns those drivers into revenue, margins, cash flow and value. That makes it credible with lenders, boards and investors who want to see what actually drives EBITDA. It saves weeks of build time, uses consistent lender-style formatting, includes 50,000 live formulas with built-in integrity checks, and lets you flex price, feedstock and energy shocks in seconds. Instead of debugging a fragile spreadsheet, you can focus on your assumptions, your strategy and your decisions.
Chemical Manufacturing Frequently Asked Questions (Faq)
Who is this chemical manufacturer financial model designed for?
It is designed for CFOs, FP&A teams, corporate development teams, investment analysts, lenders, private equity investors and consultants who need to forecast or value a chemical manufacturing business. It suits specialty and commodity producers with multiple plants and product lines.
What is the forecast horizon and time structure?
The model contains five years of monthly historicals and a ten-year forecast. Years one to five are monthly with an annual roll-up column, and years six to ten are annual. All figures are in US dollars (‘000), and timelines run horizontally.
Is it a fully integrated three-statement model?
Yes. The income statement, balance sheet and cash flow statement are fully linked, and the balance sheet includes a Balance Check row that must equal zero in every period. Debt, working capital, capex and depreciation schedules all feed the statements.
Does the model come pre-loaded with real company data?
No. It uses a fictional company, Meridian Specialty Chemicals, with illustrative historicals, SKUs, prices and comparables. These are placeholders designed to show how the model works, and you should replace them with your own actuals and market data.
Can I change the start date of the model?
Yes. Change the Model Start Date on the Assumptions tab and every date, year label and escalation updates by formula. Years are labelled by the calendar year in which each twelve-month block ends.
How does the model calculate revenue and raw-material cost?
Plant capacity multiplied by utilisation and yield gives production. Sales volume multiplied by price gives revenue across 15 product families and five other revenue categories. Production multiplied by recipe consumption and input price gives raw-material cost.
How many products, plants and raw materials are included?
The template includes five plants, 60 SKUs grouped into 15 product families, 12 raw materials, six utilities and a nine-project capex register. You can adapt the structure to your own portfolio.
What scenario and sensitivity analysis is included?
A selector on the Cover tab switches between Base, Upside and Downside cases across seven levers. The Scenarios tab also includes a three-scenario comparison, a tornado sensitivity table and live first-order sensitivities. The comparison and tornado tables are pasted values from full model runs, so re-run them after changing the base case.
What valuation methods are included?
The Valuation tab includes a discounted cash flow using perpetuity growth and exit multiple methods, WACC sensitivity grids, trading comparables, transaction comparables and a football-field summary. The comparables contain illustrative placeholders that you must replace with current market data.
Does the model use circular references or macros?
No. Interest is calculated on opening balances, so there are no circular references, and the workbook contains no macros. It is built entirely with standard Excel formulas.
How do I know the model is working correctly?
The Checks tab tests balance sheet balance, cash reconciliation, debt, revenue, production, working capital, fixed assets, equity and tax in every period. A master status on the Cover tab shows “ALL CHECKS PASS” or highlights how many issues need review.
Can lenders and investors use it for financing discussions?
Yes. It includes CFADS, DSCR, interest cover, net debt to EBITDA, a term loan, a revolver and cash sweep, and minimum cash tracking. Users should still validate all assumptions and outputs before relying on them in financing materials.
Can I adapt the model to my own business?
Yes. All inputs are in clearly coloured cells and every calculation is formula-driven, so you can replace the illustrative data, rename products and plants, adjust recipes and edit assumptions. Structural changes, such as adding plants or product families, require extending the relevant tabs.
Final Notes on the DCF Financial Model
Financial model for a Chemical manufacturer
- Scenario Analysis: Create best-case, base-case, and worst-case projections.
- Break-even Analysis: Determine sales volume required to cover fixed & variable costs.
- Sensitivity Analysis: Assess how changes in raw material costs, pricing, or demand impact profitability.
This structured 20-Year Chemical Manufacturer Financial Model addresses a broad market spectrum, offering the right balance between cost, production capacity, support, and customization at each subscription level.
Further Reading
Biochemical Fermentation Plant: Accelerate your bio-production scale-up with our state-of-the-art biochemical fermentation plant model. We combine automated bioreactors with real-time metabolic tracking to maximise high-value yields, eliminate batch variability, and slash your commercialisation costs.
- Synthetic Biology Model: Streamline your synbio venture’s path to profitability with our investor-ready synthetic biology financial model. Specifically engineered for deep-tech founders, this dynamic forecasting framework lets you accurately project bioreactor scale-up costs, map out multi-trait R&D timelines, and simulate unit economics (CapEx/OpEx) with institutional-grade precision.
Download Link On Next Page