
Telehealth Company Financial Model Template
This Telehealth Company Financial Model Template is a fully integrated Excel workbook built for virtual care startups, digital health founders, investors and advisors. It forecasts patient acquisition, cohort retention, visit volumes, provider capacity and revenue by service line. The output is a three-statement model with a linked P&L, cash flow statement and balance sheet. Two years of monthly historicals sit alongside a seven-year forecast: Years 1–4 are monthly with annual roll-up columns, and Years 5–7 are annual. You get a lender-ready telehealth business plan without building a spreadsheet from scratch.
7-Year Financial Model for A Telehealth Company
This telehealth financial projection model is driven by the real economics of virtual healthcare. Revenue is built from patient visits, visit mix, price per visit, prescriptions, membership subscriptions and employer PEPM contracts, then split by payer: cash pay, commercial insurance, government and employer-sponsored. Contractual allowances, refunds, discounts and bad debt bring gross revenue down to net revenue. A provider capacity model hires physicians, nurse practitioners and therapists based on visit demand, so your clinical payroll scales realistically with growth.
Every date in the workbook is driven by a single start date, so the full timeline re-dates instantly when your launch moves. Built-in Base, Upside and Downside scenarios let you stress-test growth, churn, pricing and CAC in one click. The model includes a DCF valuation, revenue and EBITDA multiples, a venture capital method valuation, cash runway analysis, debt and equity financing schedules, and an automated checks tab. It is ideal for fundraising, investor pitch decks, bank loans, budgeting and strategic planning.
What’s Inside: Tab-by-Tab Overview
01. Cover Dashboard
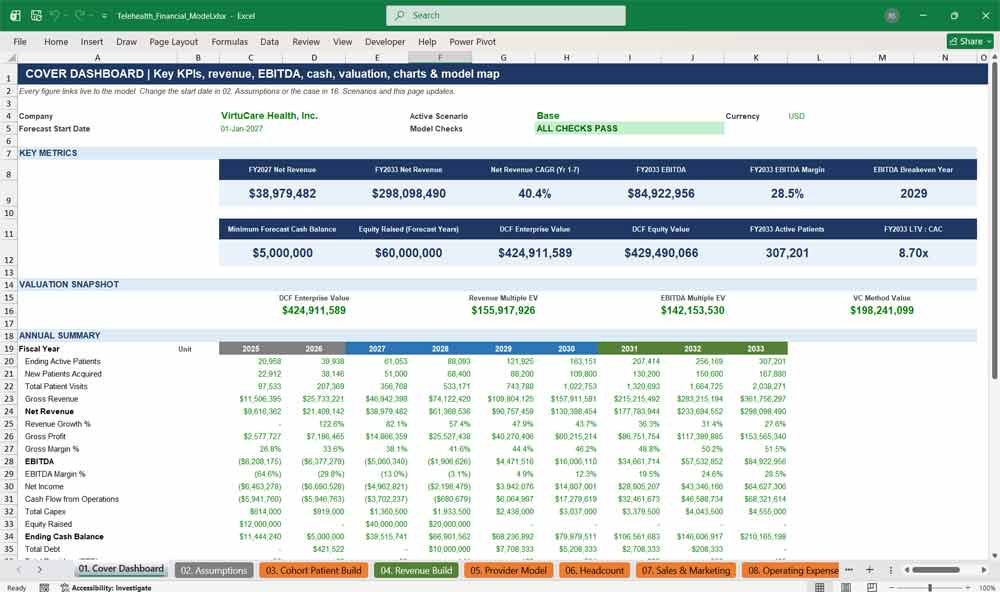
The Cover Dashboard gives investors an instant executive summary of your telehealth business. It shows headline KPI cards, an annual financial summary, valuation snapshot, revenue, EBITDA, cash and patient charts, and a live model-check status. It is all presentation-ready for board meetings and pitch decks.
- KPI cards: net revenue, revenue CAGR, EBITDA margin, breakeven year, minimum cash, LTV:CAC
- Nine-year annual summary table (historical and forecast)
- Charts for net revenue and EBITDA, ending cash and active patients
- Valuation snapshot across four methods
- Clickable model map linking to every tab
- Colour legend for inputs, formulas and links
02. Assumptions
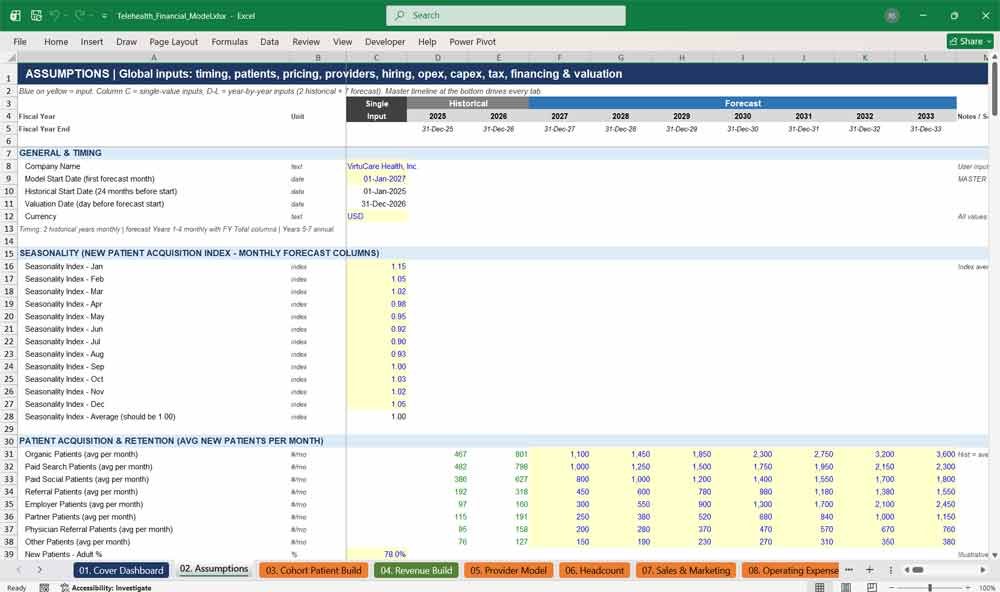
The Assumptions tab is the single control centre for your telehealth forecast. It covers timing, patient acquisition, churn, pricing, payer mix, provider pay, hiring, operating costs, capex, working capital, tax, financing and valuation. Clearly colour-coded inputs make updating your business plan fast and error-free.
- One master start date re-dates the entire model
- Year-by-year inputs for 2 historical and 7 forecast years
- Seasonality index for monthly patient demand
- Equity round, term loan and revolver inputs
- Opening balance sheet with automatic balancing
- Notes column documenting every assumption
Telehealth Revenue & Cash Flow
03. Cohort Patient Build
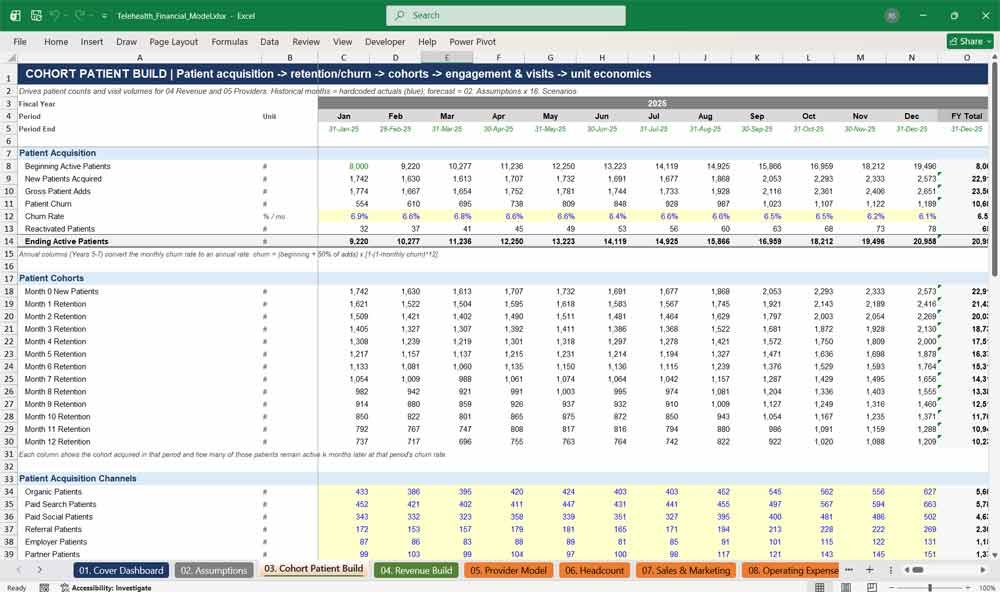
The Cohort Patient Build forecasts how many patients your telehealth platform acquires, retains and reactivates each month. Channel-level acquisition, demographic splits, monthly churn and engagement drive total patient visits, while cohort retention curves and unit economics reveal the long-term value of each patient.
- New patients across 8 acquisition channels
- Beginning, churned, reactivated and ending active patients
- Month 0–12 cohort retention curves
- Adult, pediatric and other demographic splits
- Monthly active patients and visit frequency
- Revenue, gross profit, CAC and LTV per patient
04. Revenue Build
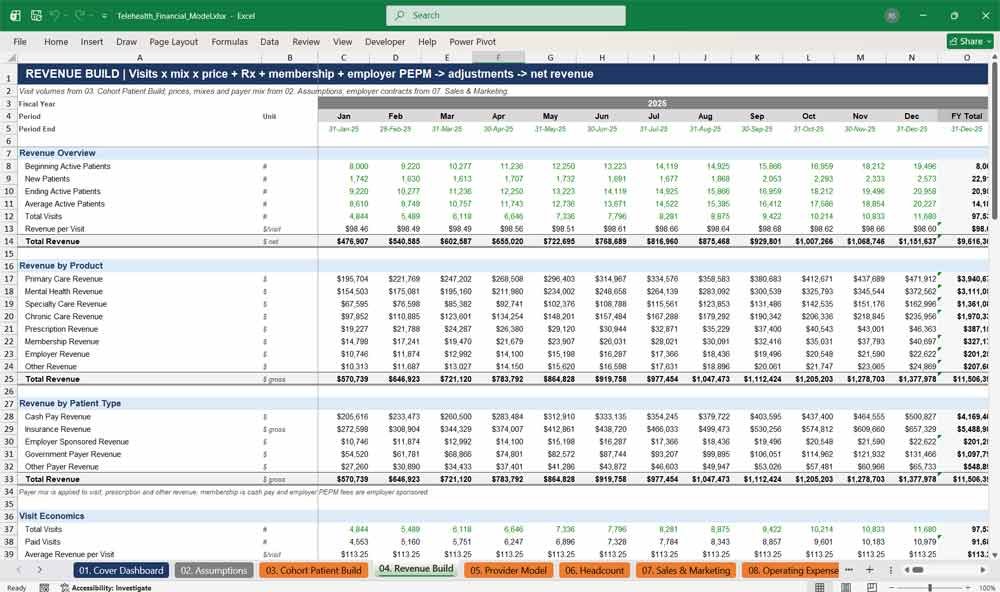
The Revenue Build turns patient visits into detailed telehealth revenue forecasts by product and payer. It models primary care, mental health, specialty and chronic care visits, plus prescriptions, membership subscriptions and employer contracts. It then reconciles gross revenue to net revenue after insurance contractual adjustments.
- Revenue by service line and by payer type
- Visit economics: paid visits, revenue and reimbursement per visit
- Subscription roll-forward with churn and monthly fees
- Insurance revenue with gross and net reimbursement
- Employer clients, covered lives, utilization and PEPM revenue
- Refunds, discounts, contractual allowances and bad debt
05. Provider Model
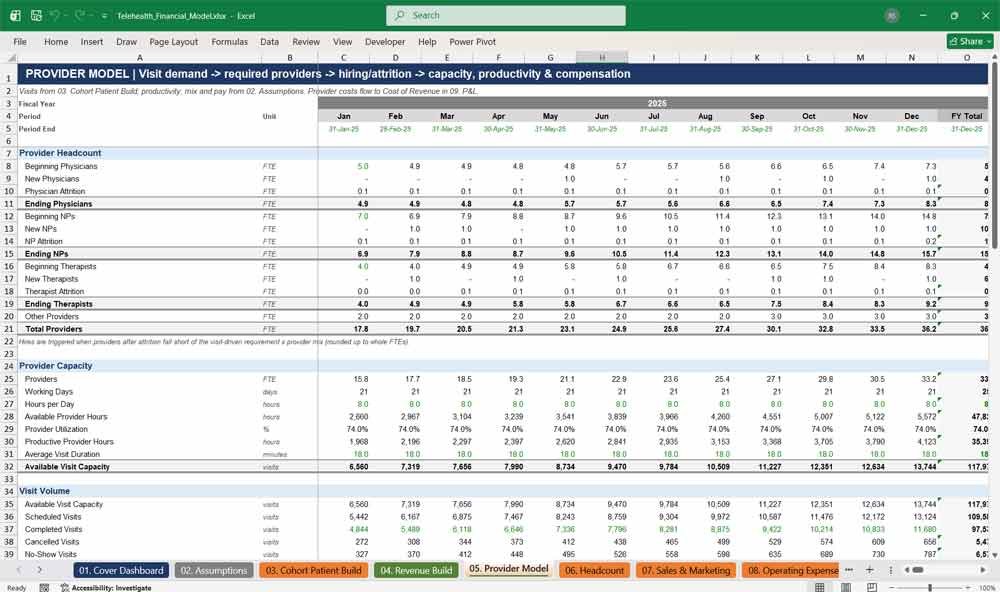
The Provider Model calculates exactly how many clinicians your virtual care business needs to meet patient demand. Visit volumes, visit duration and provider utilization drive hiring of physicians, nurse practitioners and therapists. The tab also models attrition, salaried and hourly compensation, benefits, malpractice and recruiting costs.
- Demand-driven hiring with attrition by provider type
- Capacity: working days, hours, utilization and visit capacity
- Scheduled, cancelled, no-show and completed visits
- Salaried and hourly (per-diem) compensation
- Recruiting, training, licensing and malpractice costs
- Revenue, gross profit and contribution margin per provider
06. Headcount
The Headcount tab plans corporate and clinical-support hiring across eleven departments plus care coordination and patient support. Variable roles scale automatically with visits and active patients. Salaries escalate annually, with bonuses, benefits, payroll taxes and stock-based compensation mapped to the right P&L lines.
- 13 departments from clinical operations to IT
- Variable staffing ratios linked to patient volumes
- Salary escalation, bonuses, benefits and payroll taxes
- Stock-based compensation tracked as a non-cash cost
- Fully loaded cost by department feeding the P&L
- Total company headcount including providers
07. Sales & Marketing
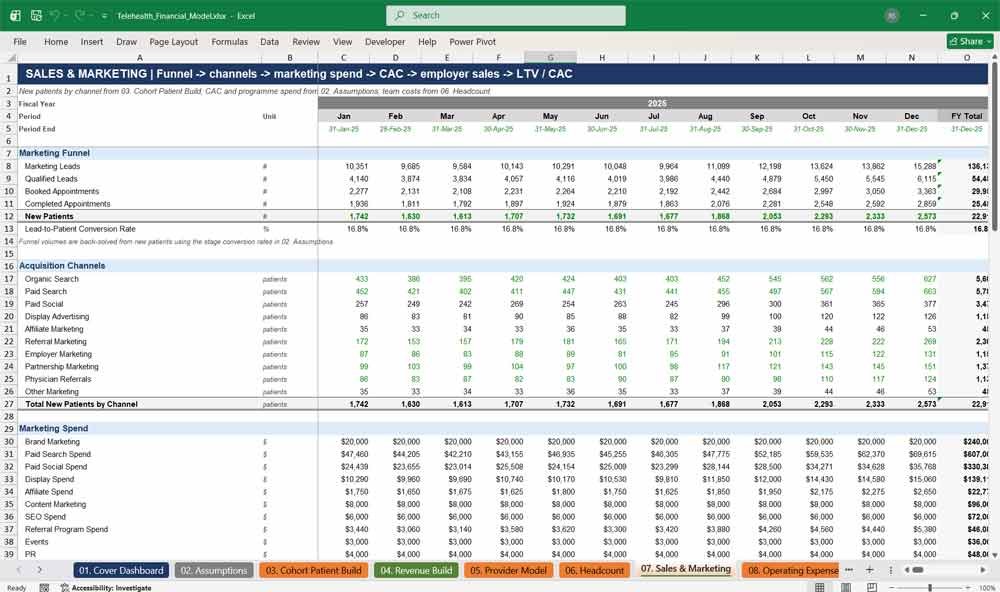
The Sales & Marketing tab models your telehealth patient acquisition funnel and employer sales engine. It back-solves leads, appointments and conversions from new patients, calculates paid-channel spend from CAC, and tracks employer pipeline, contracts and commissions. Blended CAC, LTV, LTV:CAC and payback show marketing efficiency.
- Full funnel from marketing leads to new patients
- 10 acquisition channels with channel-level CAC
- Brand, digital, content, SEO, events and PR spend
- B2B employer sales pipeline, win rates and contract values
- Cost per lead, per appointment and per new patient
- Patient LTV, LTV to CAC ratio and CAC payback period
08. Operating Expenses
The Operating Expenses tab captures every non-payroll cost of running a telehealth company. It covers clinical delivery costs such as supplies, labs, prescriptions, payment processing, telehealth platform and EHR fees, plus R&D programmes and G&A costs including insurance, rent, legal, IT and professional fees.
- Per-visit clinical delivery and technology costs
- EHR cost per provider and cloud hosting per patient
- Product and software development spend
- Legal, insurance, rent, software, travel and office costs
- Per-employee cost drivers that scale with headcount
- Summary of all non-payroll costs
Telehealth Financial Statements
09. P&L
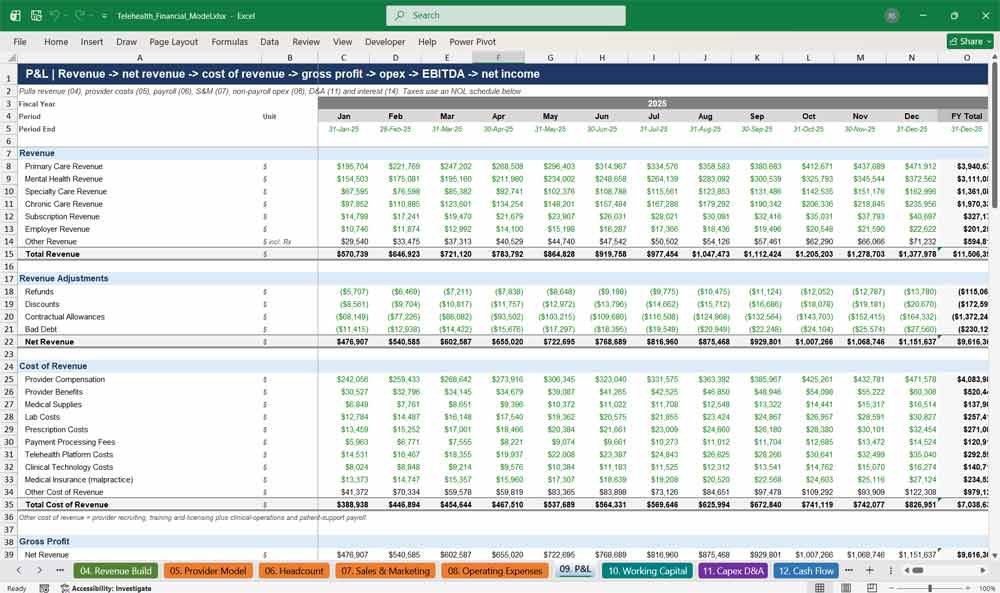
The P&L presents a complete telehealth income statement from total revenue to net income. Revenue by service line flows through revenue adjustments, cost of revenue, gross profit, sales and marketing, R&D and G&A to EBITDA, EBIT and net income. Taxes use a net operating loss schedule.
- Revenue by service line with adjustments to net revenue
- Detailed cost of revenue and gross margin per visit
- S&M, R&D and G&A broken into investor-standard lines
- EBITDA, EBIT, interest, taxes and net income with margins
- Net operating loss (NOL) carryforward schedule
- P&L totals for quick review
10. Working Capital
The Working Capital tab forecasts the cash tied up in your telehealth operations. Receivables, inventory, prepaid expenses, payables, accrued payroll and deferred membership revenue are calculated using days-based drivers. The tab then converts balance movements into cash flow impacts for accurate cash forecasting.
- Days-based AR, inventory, prepaids and other assets
- AP, accrued expenses, deferred revenue and other liabilities
- Net working capital and NWC as % of revenue
- Period-by-period cash flow impact of each balance
- Opening balances linked from Assumptions
- Consistent across monthly and annual periods
11. Capex D&A
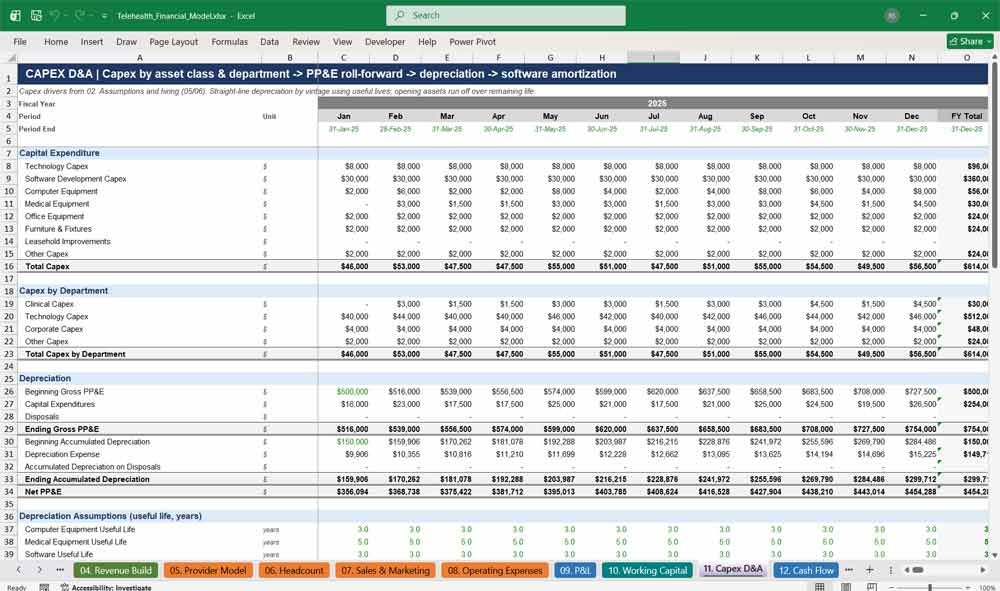
The Capex D&A tab plans technology, capitalized software, computer, medical, office, furniture and leasehold investment. Straight-line depreciation is calculated by asset class and vintage using useful lives. Capitalized software is amortized separately, producing accurate PP&E and intangible asset roll-forwards for the balance sheet.
- 8 capex categories plus capex by department
- Hiring-linked computer and medical equipment spend
- Vintage-based depreciation by asset class
- Existing asset run-off over remaining useful life
- Capitalized software amortization schedule
- Gross PP&E, accumulated depreciation and net PP&E
12. Cash Flow
The Cash Flow statement uses the indirect method to reconcile net income to cash. It captures non-cash adjustments, working capital changes, capex, equity and debt financing. It also calculates monthly, quarterly and annual cash burn plus cash runway, so you know exactly when your telehealth startup needs funding.
- Operating, investing and financing cash flows
- Stock-based compensation and D&A add-backs
- Detailed working capital changes
- Gross and net cash burn metrics
- Cash runway in months against minimum cash
- Full cash reconciliation every period
13. Balance Sheet
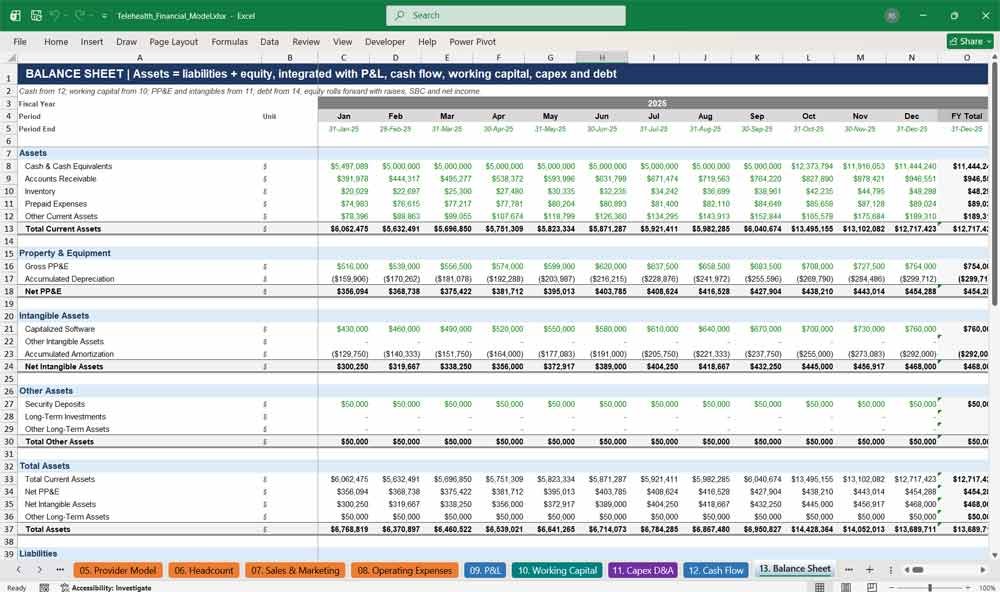
The fully integrated Balance Sheet links cash, working capital, PP&E, intangibles, debt and equity across every monthly and annual period. Equity rolls forward with funding rounds, stock-based compensation and retained earnings. A built-in balance check confirms that assets always equal liabilities plus equity.
- Current, fixed, intangible and other assets
- Current and long-term liabilities including debt
- Equity roll-forward: APIC, retained earnings, treasury stock
- Current portion of debt calculated automatically
- Balance sheet check every period
- Opening balance sheet from Assumptions
14. Debt Financing
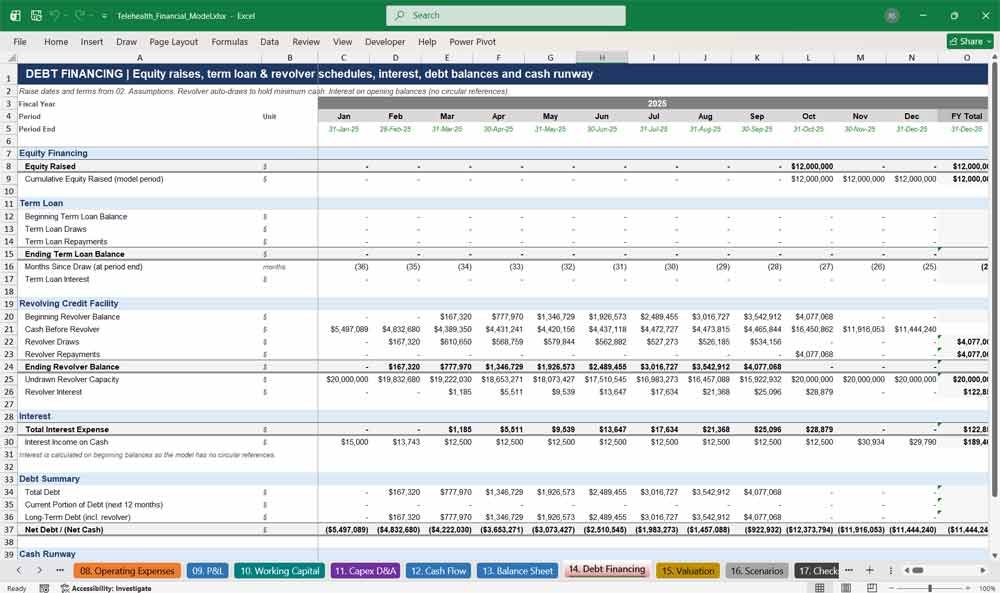
The Debt Financing tab models how your telehealth company funds growth. Dated equity rounds, an amortizing term loan with an interest-only period, and an automatic revolving credit facility keep cash above your chosen minimum. Interest is calculated on opening balances, so the model has no circular references.
- Equity raises by month with cumulative capital raised
- Term loan draw, interest-only period and amortization
- Revolver that auto-draws and repays to hold minimum cash
- Interest expense and interest income on cash
- Total debt, net debt and current portion of debt
- Liquidity and cash runway summary
Key Metrics and KPIs For A Telehealth (Telemedicine) Company
15. Valuation
The Valuation tab estimates what your telehealth business is worth using four investor-standard methods. These are a discounted cash flow with both perpetuity growth and exit multiple terminal values, EV/revenue and EV/EBITDA multiples, and the venture capital method, followed by a WACC and growth sensitivity table.
- Unlevered free cash flow build with mid-year discounting
- Gordon growth and exit multiple terminal values
- Revenue and forward EBITDA multiple valuations
- Venture capital method with target IRR
- Enterprise and equity value summary with low and high range
- 5×5 WACC vs. terminal growth sensitivity grid
16. Scenarios
The Scenarios tab lets you switch the whole model between Base, Upside and Downside cases with a single dropdown. Seven levers flex patient volume, churn, pricing, CAC, provider compensation, membership attach and employer win rates. Annual outputs update instantly for fast what-if analysis.
- One-click Base / Upside / Downside selector
- Seven editable scenario multipliers
- Applies to forecast periods only, preserving historicals
- Live annual outputs for the active case
- Revenue, EBITDA, cash, debt, CAC and LTV:CAC by year
- Ideal for investor sensitivity discussions
17. Checks
The Checks tab gives you and your investors confidence that the model is accurate. Sixteen automated tie-outs test the balance sheet, cash, revenue, visits, patients, sales and marketing, payroll, capex and EBITDA every period. Results roll up to a PASS or REVIEW flag on the dashboard.
- Balance sheet and cash reconciliation checks
- Revenue, visit and patient tie-outs across tabs
- Payroll, S&M and capex consistency checks
- EBITDA top-down vs. bottom-up check
- Negative cash, revolver limit and formula error flags
- PASS / REVIEW status by period and model-wide
Why Buy This Model?
Building a credible telehealth financial model from scratch can take weeks, and one broken link can undermine your credibility with investors. This template gives you an investor-grade, fully integrated three-statement model designed specifically for virtual care. It covers patient cohorts, provider capacity, payer mix, employer contracts and membership revenue in one workbook. Every forecast is formula-driven and traceable. Inputs are clearly colour-coded, the timeline updates from one start date, and automated checks confirm the model balances. Whether you are raising a seed or Series A round, applying for a bank loan, or building an annual budget, you can enter your own assumptions and actuals and produce professional financial projections, valuations and charts in hours rather than weeks.
Telehealth Frequently Asked Questions (Faq)
Is this model suitable for an early-stage telehealth startup with no revenue yet?
Yes. You can overwrite the historical months with zeros or your pre-launch figures and set the opening patient count to zero. The forecast is driven by assumptions, so it works equally well for pre-revenue startups and established virtual care providers.
Can I change the start date of the forecast?
Yes. Change the Model Start Date in the 02. Assumptions tab and every date, year header and month label across all 17 tabs updates automatically. Non-January start dates are supported, and the fiscal years follow your chosen start month.
What time periods does the model cover?
The model includes two years of monthly historicals and a seven-year forecast. Years 1–4 are monthly with an annual FY Total column, and Years 5–7 are annual. Monthly columns can be collapsed to show annual views only.
Does it include a balance sheet and cash flow statement?
Yes. It is a fully integrated three-statement model. The P&L, cash flow statement and balance sheet are linked, and the balance sheet balances in every period, verified by the Checks tab.
Can I model insurance reimbursement as well as cash-pay patients?
Yes. Revenue is split by payer: cash pay, commercial insurance, government and other payers, plus employer-sponsored revenue. Insurance revenue includes gross reimbursement, contractual adjustments and net reimbursement per visit, with copay and coinsurance shown as memo items.
Does it handle subscription or membership revenue?
Yes. The Revenue Build includes a full subscriber roll-forward covering new, churned, ending and average subscribers, with a monthly membership fee you set for each year.
Can I model B2B employer contracts?
Yes. Employer clients, covered lives, utilization rates and per-employee-per-month (PEPM) fees are included. New employer contracts are driven by your sales team’s leads, qualification and win rates.
How does the model decide how many doctors and nurse practitioners I need?
The Provider Model converts patient visits into required clinical hours, using visit duration, working days, hours per day and utilization. It then hires physicians, nurse practitioners and therapists to your chosen mix, after allowing for attrition.
Does it calculate CAC, LTV and LTV:CAC?
Yes. The Sales & Marketing tab calculates CAC per channel, blended CAC, patient lifetime, LTV, the LTV to CAC ratio and the CAC payback period. These are the key unit economics investors look for.
What valuation methods are included?
The Valuation tab includes a DCF with perpetuity growth and exit multiple terminal values, an EV/revenue multiple, a forward EV/EBITDA multiple, and the venture capital method. It also has a WACC and growth sensitivity table.
Can I run different scenarios?
Yes. Select Base, Upside or Downside from a dropdown on the Scenarios tab. Seven levers adjust volume, churn, pricing, CAC, provider pay, membership attach and employer win rate, and you can edit every multiplier.
Does the model include funding rounds and debt?
Yes. You can schedule equity rounds by month and model a term loan with an interest-only period and amortization. A revolving credit facility draws automatically to keep cash above your minimum balance.
Are there any circular references or macros?
No. The model contains no macros and no circular references, because interest is calculated on opening balances. It uses standard Excel formulas throughout.
How do I know which cells to edit?
Inputs are blue text on a yellow background, formulas are black, and links from other tabs are green. A colour legend and a clickable model map are on the Cover Dashboard.
Will this work for a mental health or specialty-only telehealth business?
Yes. Set the visit mix to the service lines you offer, for example 100% mental health, and adjust prices, provider mix and visit duration to match. Unused revenue lines simply show zero.
What software do I need?
Microsoft Excel 2010 or later on Windows or Mac. The model uses standard functions and also opens in other spreadsheet applications, although Excel is recommended for the best experience.
Is the model suitable for presenting to investors and banks?
Yes. It follows professional formatting standards, with a consistent layout, colour-coded inputs, subtotal styling and tab colours by section. It also includes automated integrity checks and a presentation-ready dashboard with charts.
Final Notes on the Financial Model
This 7 Year Telehealth Company Financial Model focuses on balancing capital expenditures with steady revenue growth from a diversified product line. By optimizing service costs, consultancy efficiency, and maximizing high-margin services, the model ensures sustainable profitability and cash flow stability.
Download Link On Next Page
Download Link On Next Page