
Shipping Vessel Charter Financial Model Template
This Shipping Vessel Charter Financial Model Template is a fully dynamic Excel template built for shipowners, ship finance analysts, investment bankers, and maritime private equity teams who need to underwrite vessel acquisitions with real precision. This ship finance model covers a 10-vessel mixed fleet — five time charter vessels and five bareboat charter vessels spanning Panamax, Kamsarmax, Supramax, Capesize, VLOC, and MR tanker asset classes — giving you a ready-made shipping investment model instead of a blank spreadsheet. Every charter rate, OPEX line, drydock cycle, and debt schedule is formula-driven, so this isn’t a static mockup; it’s a working vessel valuation model you can stress-test the same day you download it.
10 Year Financial Model for a Shipping Vessel Charter Company
Built across 15 fully linked tabs, this Excel shipping model runs a complete vessel-level and consolidated fleet financial model: charter revenue, operating costs, dry dock capex, financial statements, debt schedules, tax, DCF valuation, equity IRR, MOIC, NPV, sensitivity analysis, and scenario modeling. Years 1–5 are modeled monthly with automatic annual roll-ups, and Years 6–10 roll into a clean annual view — a structure lenders, charterers, and investment committees actually expect to see in a shipping finance model. Change one input — the model start date — and every charter start date, drydock cycle, and debt maturity across all 15 tabs recalculates instantly, so scenario testing takes minutes, not days.
Whether you’re pricing a single time charter vessel acquisition, structuring bareboat charter financing, preparing a vessel investment memo, or teaching maritime finance, this Excel financial model template gives you a credible, lender-ready starting point. It’s built for ship brokers evaluating asset play opportunities, private equity and infrastructure funds underwriting shipping deals, corporate development teams at shipping companies, graduate students studying maritime finance, and financial modelers who want a proven vessel charter model framework instead of building one from scratch. Download it, plug in your own charter rates and vessel specs, and get a bankable answer on IRR, NPV, and MOIC the same afternoon.
Shipping Charter Model Per-Tab Highlights
01. Cover Summary
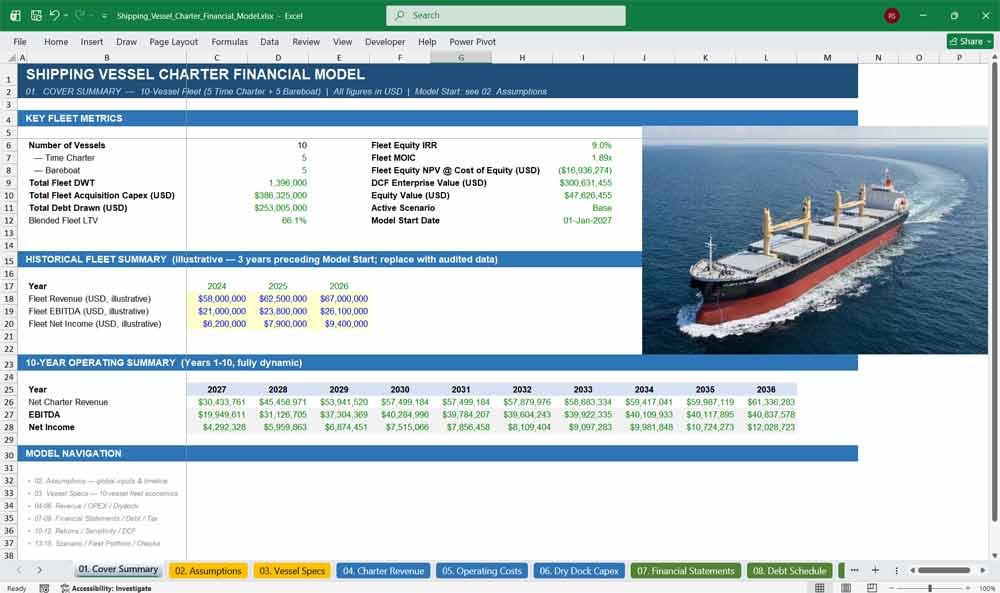
The Cover Summary tab delivers an executive dashboard of your shipping investment: fleet-wide IRR, MOIC, NPV, and DCF enterprise value at a glance. This one-page financial model summary is built for investment committees and lenders who need the headline vessel valuation numbers before diving into 15 tabs of detail.
Highlights:
- Live fleet Equity IRR, MOIC, NPV, and DCF Enterprise Value in one view
- Fleet composition snapshot — vessel count, total DWT, time charter vs. bareboat split
- Illustrative 3-year historical fleet summary for context
- 10-year revenue, EBITDA, and net income trend table
02. Assumptions
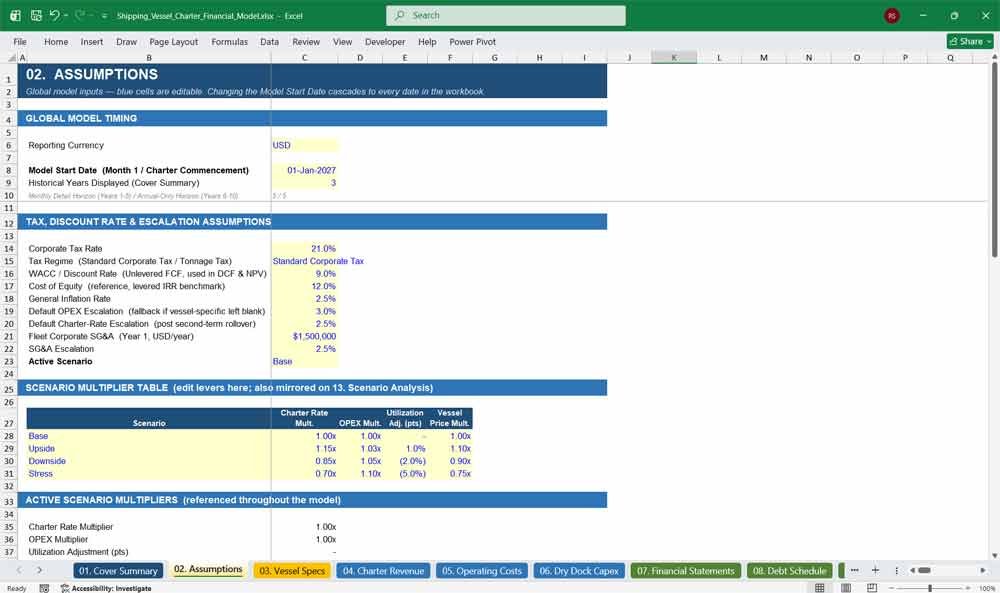
The Assumptions tab is the control panel of this shipping financial model — tax rate, WACC, cost of equity, inflation, escalation, and the scenario selector all live here. Change the model start date once and every charter, drydock, and debt date across the entire vessel financial model updates automatically.
Highlights:
- Single Model Start Date cell drives every date in the workbook
- Editable tax rate, WACC, cost of equity, and inflation assumptions
- Base / Upside / Downside / Stress scenario selector with multiplier table
- Standard Corporate Tax vs. illustrative Tonnage Tax regime toggle
Shipping Vessel Charter Revenues & Costs
03. Vessel Specs
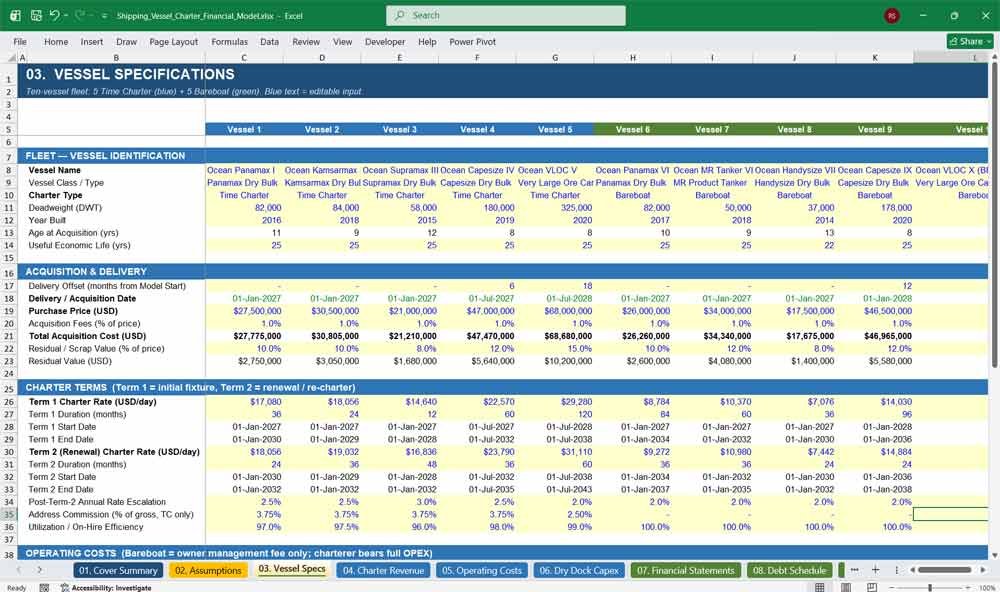
Vessel Specs is the fleet data hub of this ship finance template: purchase price, DWT, charter rate, useful life, drydock schedule, and debt terms for all 10 vessels side by side. It’s the fastest way to see how vessel economics compare across a mixed time charter and bareboat fleet.
Highlights:
- One column per vessel — 10 vessels, fully comparable side by side
- Purchase price, DWT, build year, and useful life for every asset
- Term 1 and Term 2 charter rates, with renewal/re-charter logic built in
- Debt LTV, interest rate, tenor, and balloon terms per vessel
04. Charter Revenue
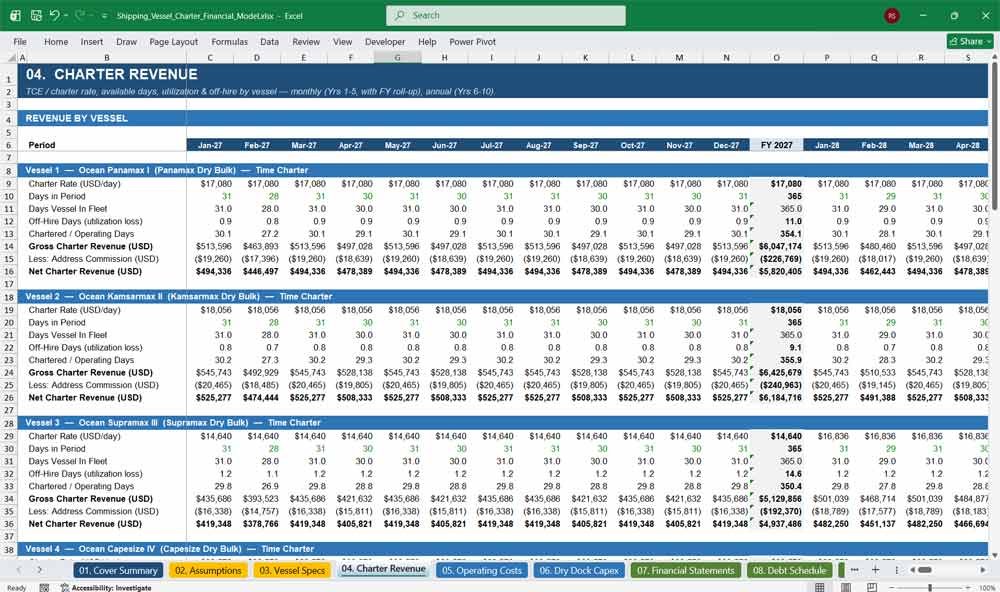
The Charter Revenue tab models TCE and charter rate income vessel by vessel, with available days, utilization, and off-hire fully dynamic. This revenue module handles time charter and bareboat structures differently, including a built-in charter renewal and re-fixing scenario for realistic shipping revenue modeling.
Highlights:
- Monthly charter revenue for Years 1–5 with automatic FY roll-up
- Utilization and off-hire days calculated per vessel, per period
- Address commission deducted automatically for time charter vessels
- Built-in renewal / re-charter example showing rate step-up at re-fixing
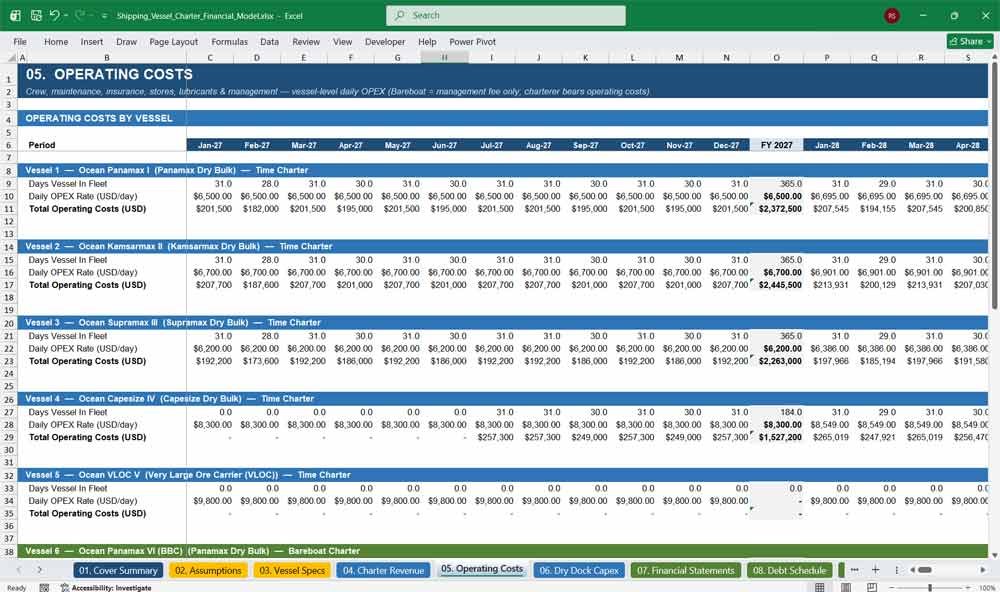
05. Operating Costs
Operating Costs breaks down daily OPEX by vessel — crew, maintenance, insurance, stores, and lubricants for time charter vessels, versus a lean management fee for bareboat vessels where the charterer bears operating costs. Escalation is fully modeled, making this a realistic shipping OPEX forecasting tool.
Highlights:
- Vessel-specific daily OPEX rates with annual escalation
- Automatic distinction between time charter OPEX and bareboat management fees
- Monthly detail for Years 1–5, annual for Years 6–10
- Fleet-level OPEX roll-up for consolidated cost analysis
06. Dry Dock Capex
The Dry Dock Capex tab automatically schedules special survey and drydock events based on each vessel’s delivery date and drydock interval — no manual date entry required. This maintenance capex module is essential for any credible ship finance model or vessel lifecycle cost analysis.
Highlights:
- Drydock events auto-scheduled off vessel delivery date and interval
- Off-hire days and capex cost calculated automatically per event
- Different drydock cycles modeled by vessel class (e.g., tanker vs. bulker)
- Fleet-level drydock capex roll-up feeding the DCF and cash flow
Shipping Vessel Charter Financial Statements
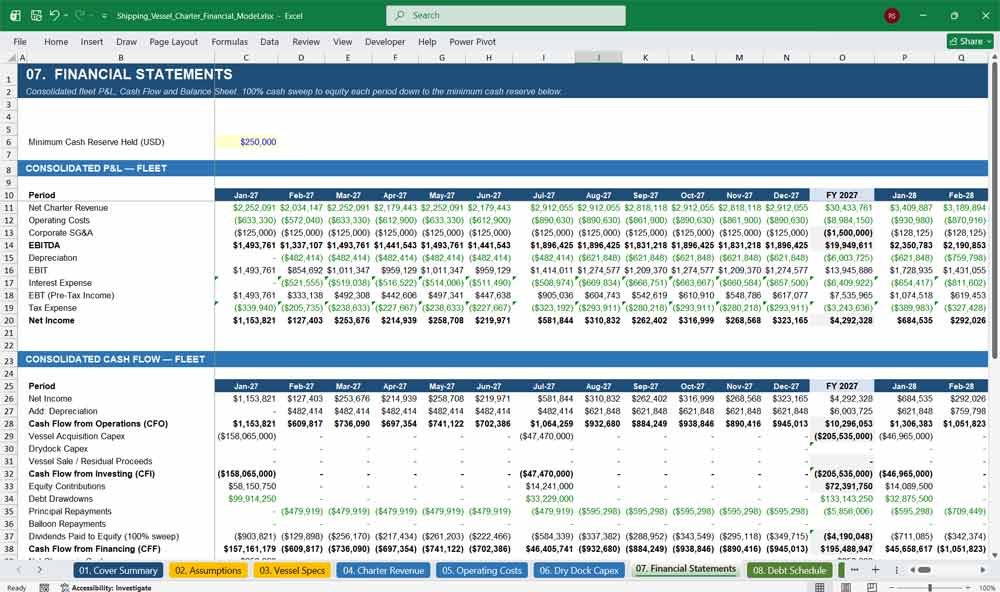
07. P&L & Cash Flow
Financial Statements consolidates the full fleet into a linked P&L, cash flow statement, and balance sheet — with a 100% cash-sweep dividend policy and a balance sheet that ties to the dollar every period. This is the financial engine every ship finance model needs.
Highlights:
- Fully linked, three-statement fleet financial model
- Balance sheet balances automatically in every period, every scenario
- 100% cash-sweep-to-equity policy with minimum reserve control
- EBITDA, EBIT, EBT, and Net Income built up transparently
08. Debt Schedule
The Debt Schedule models vessel-level mortgage financing with drawdown, straight-line amortization, interest, and balloon repayment at maturity — a core feature of any shipping debt model. Each vessel carries its own LTV, rate, and tenor, mirroring how ship finance is actually structured.
Highlights:
- Vessel-by-vessel debt drawdown, amortization, and interest schedules
- Balloon / bullet repayment modeled automatically at loan maturity
- Different LTV, rate, and tenor per vessel for realistic structuring
- Consolidated fleet debt roll-up for lender and covenant analysis
09. Tax
The Tax tab computes taxable income and straight-line depreciation under a Standard Corporate Tax basis, with a simplified illustrative Tonnage Tax comparison — a feature few public ship finance templates include. Toggle between regimes to see the after-tax impact instantly.
Highlights:
- Straight-line tax depreciation to residual value, per vessel
- Standard Corporate Tax vs. simplified Tonnage Tax regime toggle
- Vessel net book value tracked automatically period by period
- Consolidated fleet tax expense feeding directly into the P&L
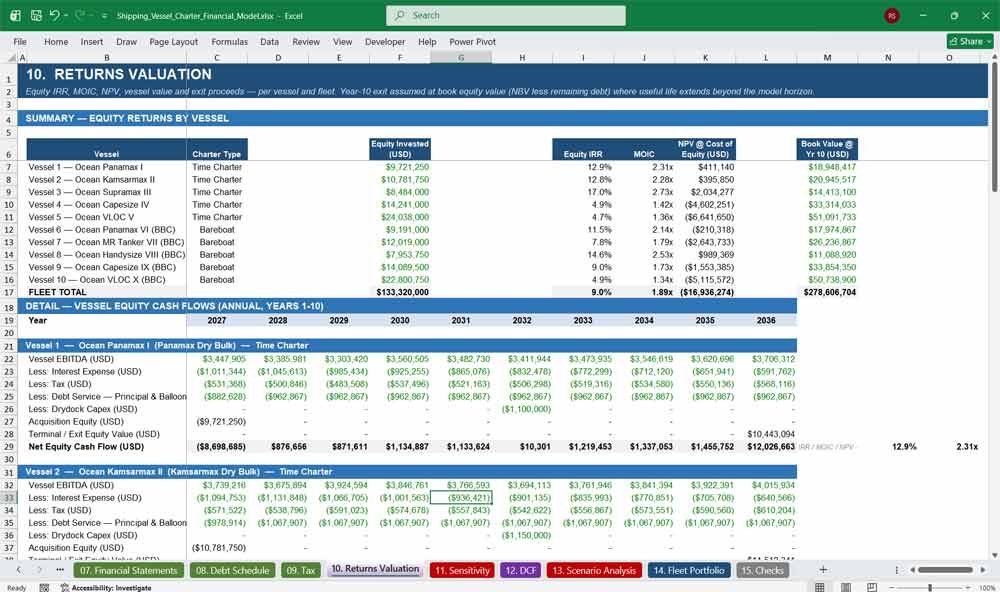
10. Returns Valuation
Returns Valuation is where this vessel investment model earns its keep: per-vessel and fleet-wide Equity IRR, MOIC, and NPV, with a realistic Year 10 exit at book equity value. It’s built for anyone who needs a defensible shipping investment return analysis fast.
Highlights:
- Equity IRR, MOIC, and NPV calculated per vessel and for the fleet
- Year 10 exit value modeled at book equity (NBV less remaining debt)
- Acquisition equity and terminal proceeds built into each vessel’s cash flow
- Quick-glance summary table ranks all 10 vessels by return
Vessel Charter Key Financial Metrics
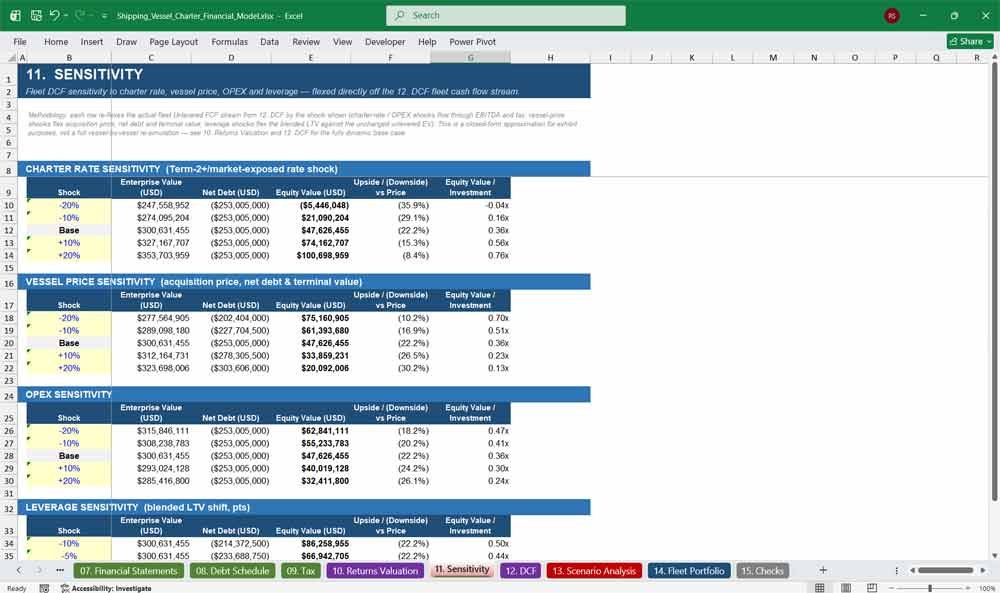
11. Sensitivity
The Sensitivity tab stress-tests charter rate, vessel price, OPEX, and leverage against the model’s actual DCF cash flows — not a generic guess. It’s the fast way to answer “what if rates fall 20%?” without rebuilding a single formula in this Excel ship valuation model.
Highlights:
- Four sensitized drivers: charter rate, vessel price, OPEX, leverage
- ±10% and ±20% shock steps built directly off live model outputs
- Enterprise Value, Net Debt, and Equity Value shown per shock
- Transparent methodology note so every number is auditable
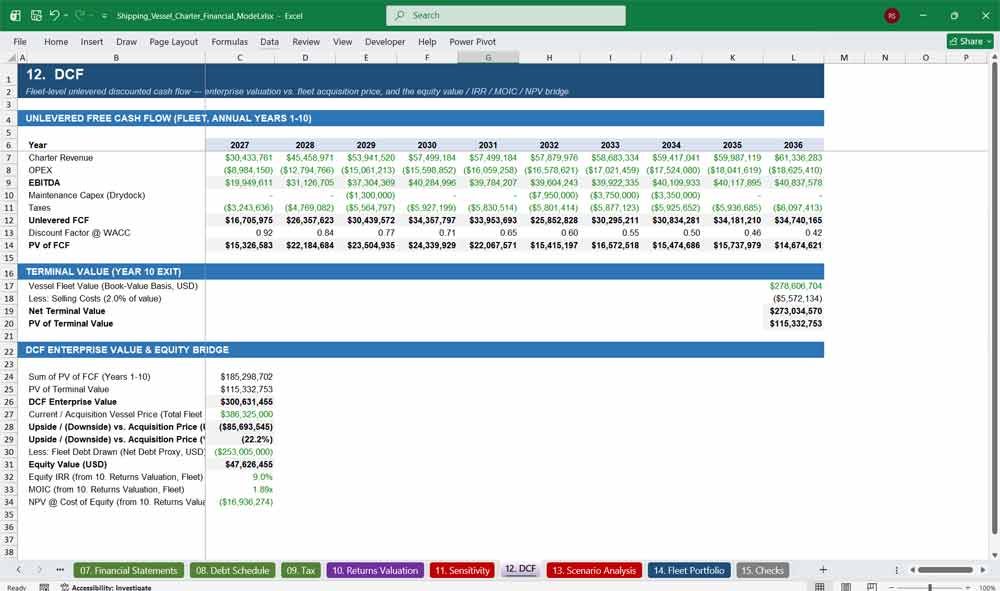
12. DCF
The DCF tab runs a full unlevered discounted cash flow: EBITDA, maintenance capex, taxes, and terminal value bridge to DCF Enterprise Value, Equity Value, and Upside/Downside versus acquisition price. This is the valuation core every serious ship finance or vessel acquisition model needs.
Highlights:
- 10-year unlevered free cash flow discounted at WACC
- Year 10 terminal value with selling costs and PV bridge
- DCF Enterprise Value compared directly to acquisition price
- Equity Value, Equity IRR, MOIC, and NPV bridge in one place
13. Scenario Analysis
Scenario Analysis compares Base, Upside, Downside, and Stress cases side by side without touching a single input cell. Built on the same live scenario engine driving the entire model, it’s the fastest way to pressure-test a shipping investment before presenting to an investment committee.
Highlights:
- Base / Upside / Downside / Stress scenarios compared in one table
- Live link to whichever scenario is currently selected model-wide
- Enterprise Value, Net Debt, Equity Value shown for all four cases
- Editable multiplier table so you can define your own scenarios
14. Fleet Portfolio
Fleet Portfolio rolls the entire 10-vessel fleet into one composition dashboard — DWT, capex, blended LTV, charter mix, and a 10-year revenue/EBITDA trend chart. It’s the portfolio-level view fleet owners and investors need for a shipping asset management overview.
Highlights:
- Full 10-vessel roster with class, DWT, price, and rate at a glance
- Blended fleet LTV and total capex calculated automatically
- Time charter vs. bareboat mix summarized instantly
- Built-in chart trending fleet revenue, EBITDA, and net income
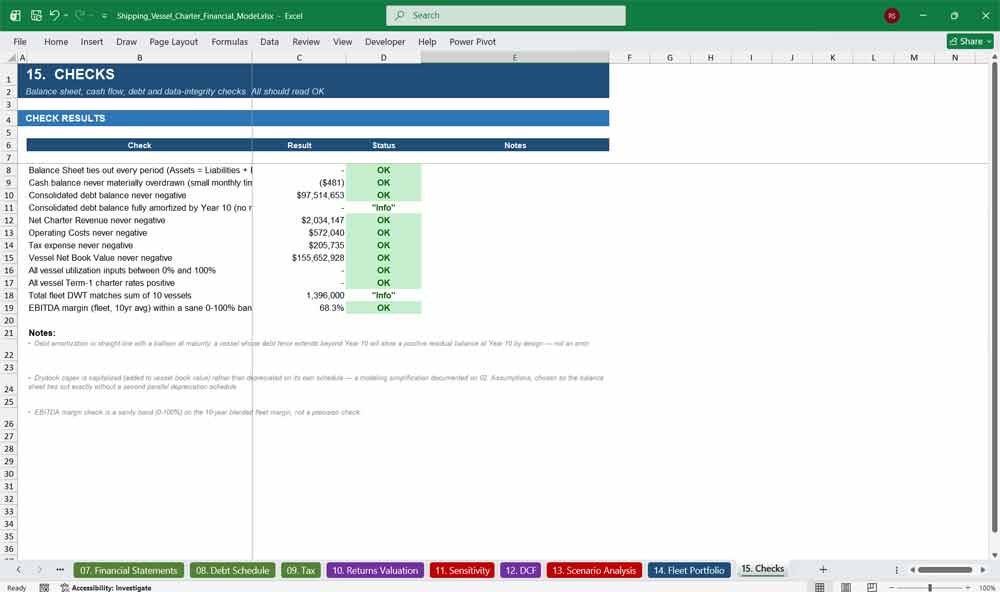
15. Checks
The Checks tab is your audit trail: balance sheet integrity, cash balance, debt balance, and data-validity checks all run automatically and flag OK or REVIEW. Few shipping finance templates include this level of built-in quality control — it’s what makes this model lender-presentation-ready.
Highlights:
- Balance sheet tie-out check across every period, automatically
- Cash and debt balance checks catch structural errors instantly
- Data validity checks (utilization %, charter rates) built in
- Color-coded OK/REVIEW status so errors can’t hide in a 15-tab model
Why Buy This Model
Building a shipping vessel charter financial model from scratch takes an experienced analyst days, not hours — sourcing the tab structure, wiring monthly-to-annual date logic, building a three-statement model that actually balances, and layering in DCF, IRR, and sensitivity analysis without breaking a formula chain somewhere along the way. This model gives you all of that, already built, tested, and error-checked, for a fraction of the time and cost of commissioning custom work or learning maritime finance modeling by trial and error. It’s not a static example dressed up to look sophisticated — every number is a live formula, the balance sheet ties out in every period, and changing a single date cascades correctly through all 15 tabs, because it’s been built and stress-tested to do exactly that. Whether you’re underwriting a real acquisition, preparing an investor-ready analysis, or need a credible teaching tool for maritime finance, you’re buying back the days it would otherwise take to get a working model — and a fleet structure (5 time charter, 5 bareboat, across six vessel classes) diverse enough to adapt to almost any shipping deal you’re actually working on.
Shipping Vessel Charter Frequently Asked Questions (Faq)
Q: I’m not a financial modeling expert — can I actually use this?
Yes. Every input cell is clearly marked in blue and grouped logically on the Assumptions and Vessel Specs tabs, so you don’t need to touch a single formula to run your own numbers. Just update the charter rates, purchase prices, or debt terms for your deal, and the rest of the model — revenue, cash flow, IRR, NPV — recalculates automatically.
Q: Does this work with real vessels, or is it just a generic template?
It ships with a fully worked 10-vessel example fleet (five time charter, five bareboat, across Panamax, Kamsarmax, Supramax, Capesize, VLOC, and MR tanker classes) so you can see exactly how the mechanics work. You then replace the vessel specs, charter rates, and debt terms with your own deal’s numbers — the structure and formulas stay intact.
Q: Can I add more than 10 vessels, or fewer?
The model is built around a 10-vessel fleet with consistent formula patterns across every tab, which makes it straightforward to extend by copying an existing vessel block and relinking it, or to simplify by leaving unused vessel columns at zero. Basic Excel comfort (copy, paste, adjust a cell reference) is all that’s needed.
Q: What happens when I change the charter start date?
Every date in the workbook — vessel delivery, charter terms, drydock cycles, debt draw and maturity dates, tax schedules — is driven off a single Model Start Date cell on the Assumptions tab. Change that one cell and all 15 tabs recalculate their dates automatically; nothing needs to be manually re-entered.
Q: Does it include both time charter and bareboat charter structures?
Yes. Five vessels are modeled as time charter (owner bears OPEX, earns a charter rate) and five as bareboat charter (charterer bears OPEX, owner earns a bareboat hire rate and retains capex responsibility), with the revenue and cost formulas automatically adjusting based on each vessel’s charter type.
Q: Will Excel formulas break if I change assumptions?
No. The model was built and stress-tested specifically so that changing inputs — rates, prices, dates, leverage, tax regime, scenario — never breaks a formula chain. The balance sheet is designed to tie out exactly in every period under any combination of inputs, and a dedicated Checks tab flags anything that doesn’t.
Q: What Excel version do I need, and does it work on Mac?
The model uses standard Excel formulas (IF, INDEX/MATCH, SUMPRODUCT, IRR, NPV, EDATE, and similar) that are compatible with Excel 2016 and later on both Windows and Mac, as well as Excel for Microsoft 365. No macros, add-ins, or Windows-only functions are required.
Q: Is this suitable for presenting to lenders or an investment committee?
Yes. The model includes a dedicated Cover Summary dashboard, a Checks tab that validates balance sheet and cash flow integrity, and a full DCF/Returns/Sensitivity package — the same structure lenders and investment committees expect to see in a professional vessel acquisition or ship finance analysis.
Q: What’s included in the download, and is there support?
You receive the full 15-tab Excel workbook (.xlsx) with the complete 10-vessel example fleet, all formulas intact and unlocked, plus documented assumptions and methodology notes built into the Assumptions and Checks tabs so you understand exactly how each number is calculated.
Q: Can I use this for a real acquisition, or is it for illustration only?
It’s built as a genuine underwriting tool, not just an illustration — the formula logic (charter revenue, debt amortization, tax depreciation, DCF, IRR) mirrors how real shipping deals are modeled. That said, always have your own numbers, tax treatment, and legal structure reviewed by qualified maritime finance and tax professionals before relying on any model for a live transaction.
Final Notes on the 10-Year Financial Model
Model Integration
- Interdependencies: Cash flow projections directly influence the income statement and balance sheet through interest income, reserves, and tranche payments.
- Scenario Analysis: Embedded functionality to test various market assumptions like property value depreciation, default rates, and interest rate spikes.
- Investor Reporting: Schedules for interest/principal payouts and performance updates tailored to tranche types.
Shipping Vessel Charter Financial Model
This structured model helps a BIMCO Charter Company service address a broad market spectrum, offering the right balance between cost, leasing, sales, support, and customization.
Download Link On Next Page