
Semiconductor Fab Financial Model Template
This semiconductor fab financial model template is a fully-built, fully-linked Excel template for anyone evaluating the economics of a leading-edge logic chip fabrication plant. Built around a 40,000 wafer-per-month, 3nm-7nm fab with a $20 billion construction budget, the model walks through a complete 23-year lifecycle: a 3-year monthly construction build-out followed by a 20-year operating period, with monthly, quarterly, and annual detail layered in exactly where it matters. Every formula is transparent, every assumption is editable, and every number traces back to a driver you can see and change.
20-year Financial Model for a Semiconductor Fab (semiconductor cost model)
Unlike a generic manufacturing template, this Excel financial model reflects how a real wafer fab actually makes money and spends cash. The operating engine models the full production chain — wafer starts, utilization ramp, defect-density yield curves, wafer sort, final test, and shipments — into a bottoms-up revenue build, while the cost engine tracks materials, chemicals and bulk gases, electricity and water, direct labor, equipment maintenance, and depreciation all the way into COGS. Layer in a construction S-curve with capitalized interest, vintage depreciation, working capital, project debt amortization, and a CHIPS Act investment tax credit and NOL model, and you have a financial model built to withstand real diligence, not just impress at first glance.
Whether you’re an investor sizing a fab investment, a corporate development team building an internal business case, looking for a semiconductor revenue build and dcf model, a consultant preparing an investment committee package, or a student or analyst learning how semiconductor economics actually work, this model gives you a credible, audit-ready starting point in minutes instead of months. A live Base/Upside/Downside scenario switch, a full 3-statement build that balances to the penny in every period, and a DCF and returns tab with NPV, IRR, equity IRR, and MOIC mean you can start stress-testing a fab investment the moment you open the file.
WHY BUY THIS MODEL
Building a semiconductor fab financial model from scratch takes weeks — sourcing yield curves, wiring a construction S-curve, getting a three-statement model to balance, building a defensible tax and incentives schedule, and stress-testing it all with scenarios most teams never get to. This model gives you all of that already built, already checked, and already linked, so you can spend your time on the assumptions and the story, not on formula plumbing. Every input cell is clearly marked and editable, every tab is color-coded and documented, and the entire model recalculates cleanly with zero formula errors — so you can drop in your own capacity, see how semi fab utilization rates impact profitability, pricing, cost, and financing assumptions and trust the output on day one.
Semiconductor fab Tab-By-TAB Descriptions
1. Cover Control
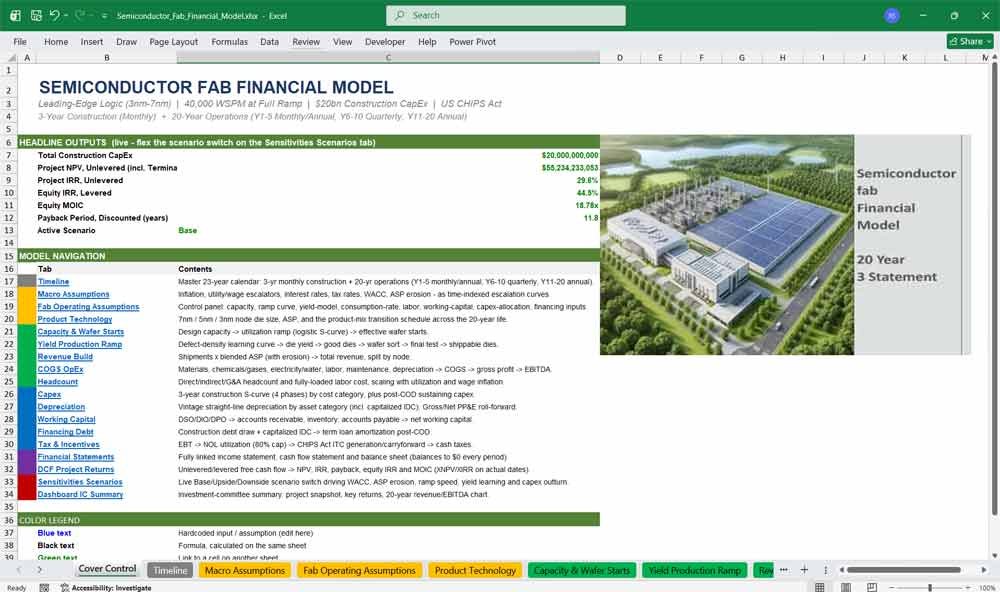
Your model’s home base: a live dashboard of headline outputs, a full color-coded legend, and one-click navigation to all 19 tabs. Built for reviewers, investment committees, and anyone opening the file for the first time who needs to get oriented fast.
Highlights:
- One-click hyperlinked navigation to every tab in the model
- Live headline metrics: CapEx, NPV, IRR, equity IRR, MOIC, payback
- Full color legend explaining inputs, formulas, and cross-sheet links
- Active scenario indicator pulled straight from the Sensitivities tab
2. Timeline
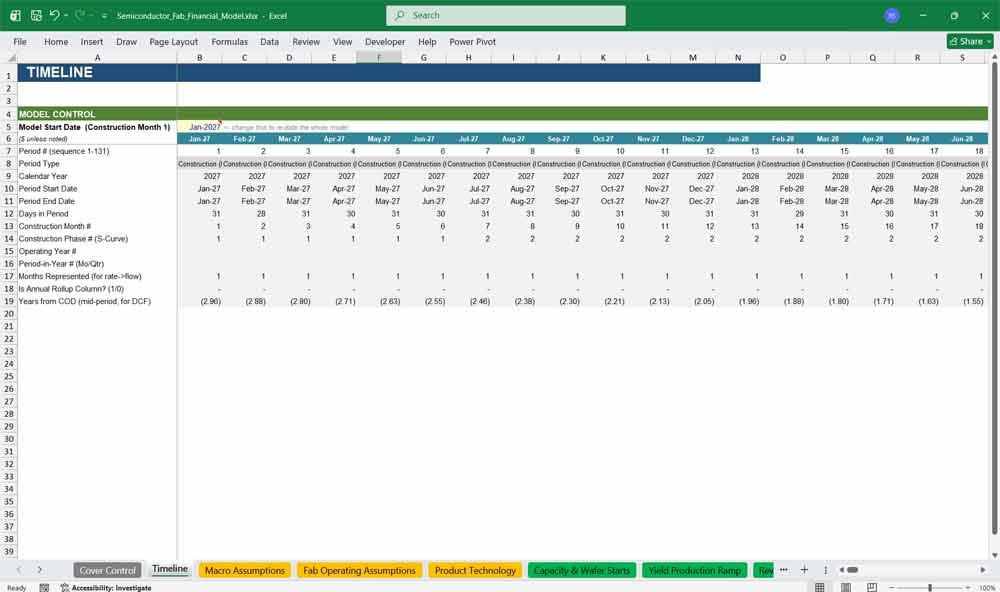
The master calendar driving every other tab: a 3-year monthly construction schedule followed by 20 years of operations, blending monthly, quarterly, and annual detail off a single adjustable start date. Change one cell and the entire 23-year model re-dates itself instantly.
Highlights:
- Single control cell re-dates the entire 23-year model instantly
- Monthly detail for construction and Years 1-5, quarterly for Years 6-10, annual for Years 11-20
- Automatic phase, fiscal-year, and days-in-period calculations
- Feeds every other tab’s column headers and date logic
3. Macro Assumptions
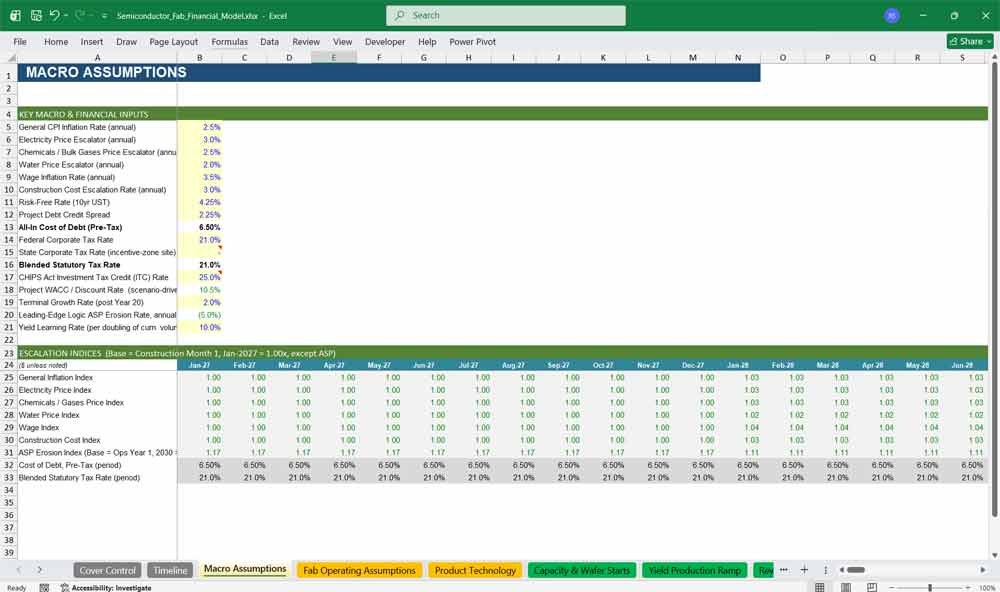
Every macroeconomic driver your fab depends on lives here: inflation, utility and wage escalators, interest rates, corporate tax rates, WACC, and ASP erosion, all expressed as adjustable time-indexed curves instead of static guesses baked into formulas.
Highlights:
- Inflation, electricity, gas, water, and wage escalation curves
- Risk-free rate, credit spread, and blended cost-of-debt build-up
- Federal and state tax rate inputs feeding the whole model
- ASP erosion and yield-learning-rate assumptions in one place
4. Fab Operating Assumptions
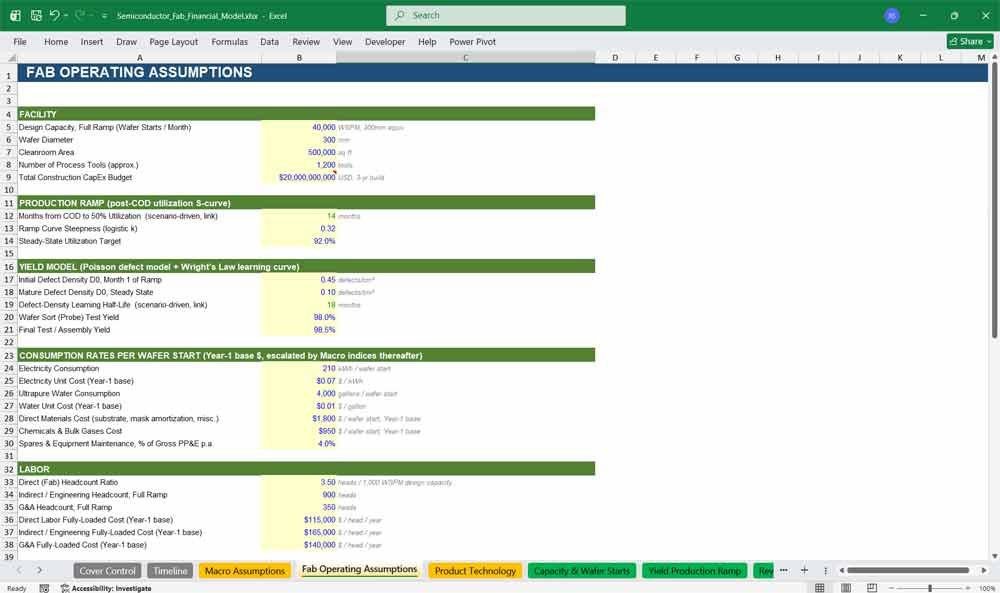
The control panel for the physical fab: capacity, utilization ramp, yield-model parameters, per-wafer consumption rates, labor ratios, working-capital days, capex allocation, and financing structure — nearly fifty editable inputs organized so you can retune the whole plant in minutes.
Highlights:
- Design capacity, cleanroom size, and tool count inputs
- Utilization ramp curve and yield-learning parameters
- Per-wafer electricity, water, materials, and chemicals consumption rates
- Working-capital days and debt/equity financing split
Semiconductor Fab Capacity Ramp
5. Product Technology
Models the node roadmap driving your revenue mix: die size, dies-per-wafer, and ASP for 7nm, 5nm, and 3nm nodes, with a full 20-year product-mix transition schedule showing how the fab migrates to newer, higher-value nodes over time.
Highlights:
- Die size and ASP by node (7nm / 5nm / 3nm)
- Automatic gross-dies-per-wafer calculation from wafer geometry
- 20-year node mix transition schedule, editable by year
- Blended die size, yield, and ASP calculated automatically
6. Capacity & Wafer Starts
The first link in the operating chain: design capacity ramps into effective wafer starts through a logistic utilization curve, giving you a realistic, gradual production ramp instead of an unrealistic day-one jump to full output.
Highlights:
- Logistic utilization ramp from COD to steady state
- Effective wafer-starts-per-month calculated automatically
- Cumulative wafer starts tracked for yield-learning curves
- Fully adjustable ramp speed and steady-state utilization target
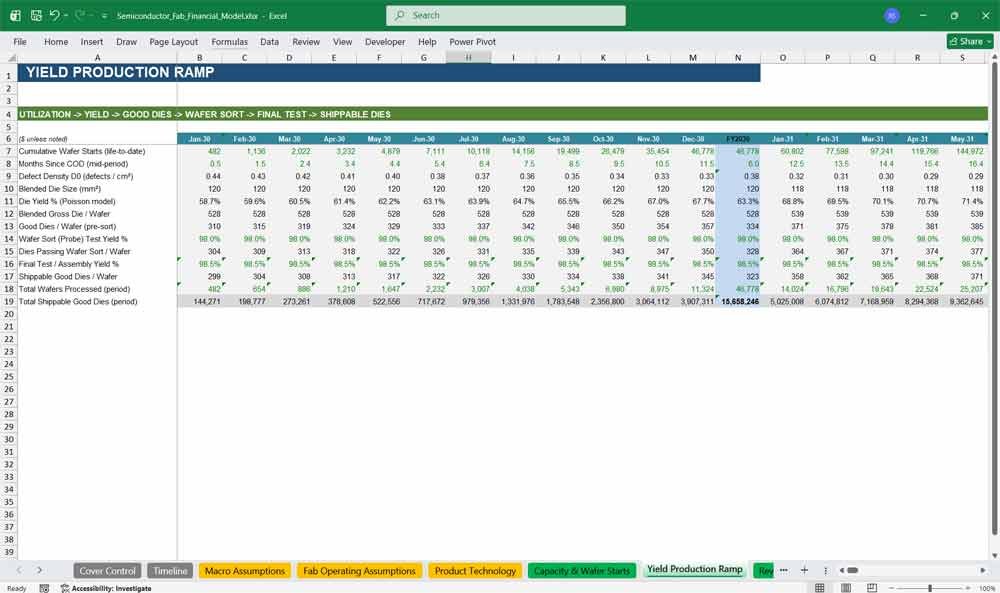
7. Yield Production Ramp
Converts wafer starts into shippable output through a real semiconductor yield model: a Poisson defect-density curve, wafer sort, and final test, so revenue is grounded in an actual production yield ramp instead of a flat assumption.
Highlights:
- Poisson defect-density yield model with learning-curve improvement
- Wafer sort and final test yield applied sequentially
- Good-dies and shippable-dies-per-wafer calculated automatically
- Fully linked to Product Technology’s die geometry
8. Revenue Build
Turns shippable dies into revenue: shipments times a blended, erosion-adjusted ASP, broken out by node so you can see exactly how much of your revenue comes from each generation of technology in any given year.
Highlights:
- Revenue built bottoms-up from shipments and blended ASP
- Automatic ASP erosion applied year over year
- Revenue broken out by node (7nm / 5nm / 3nm)
- Built-in check ties node-level revenue to the total
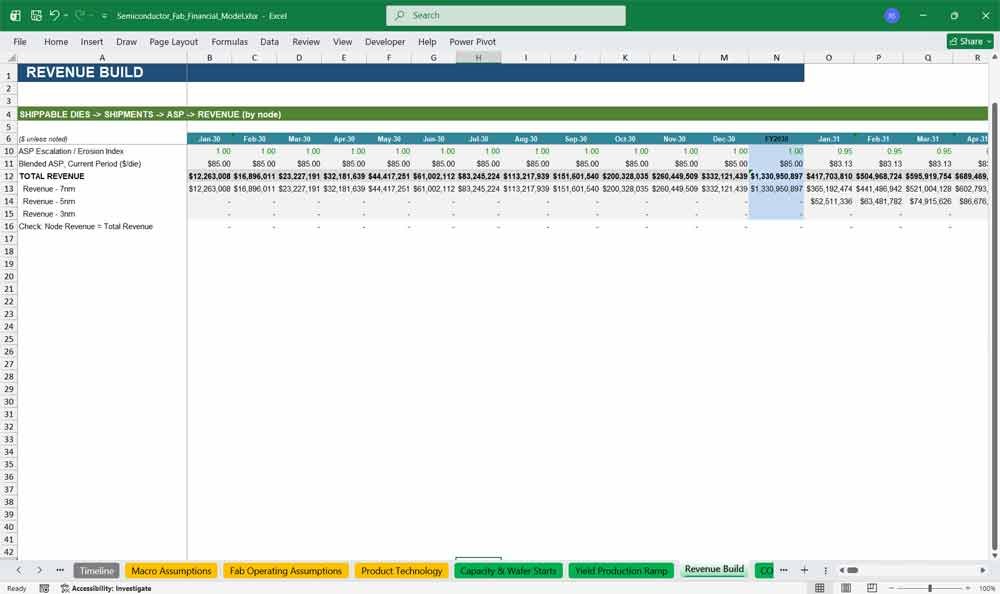
Semiconductor Fab Financing – Revenues
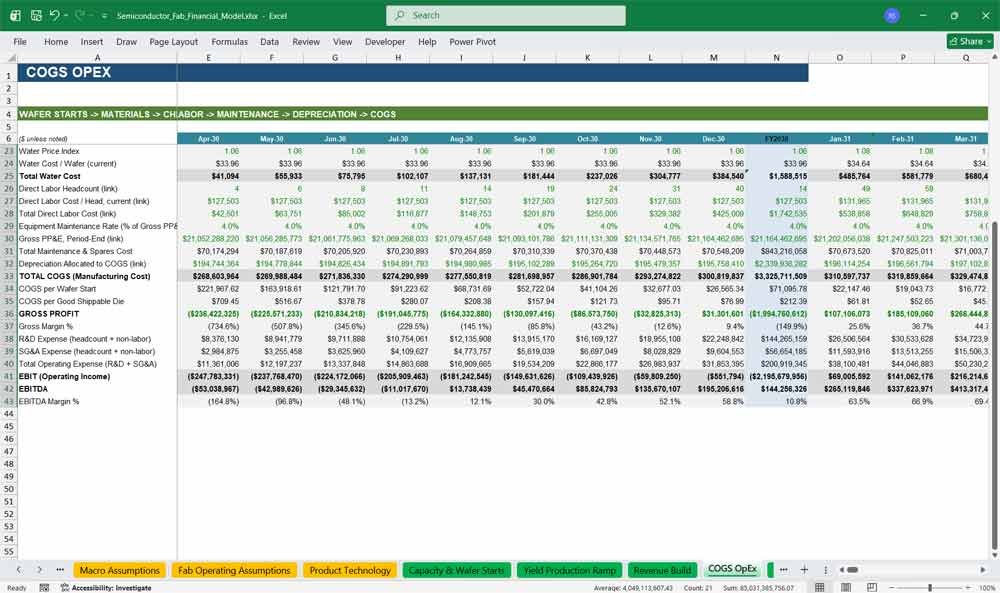
9. COGS OpEx
The cost engine of the model: materials, chemicals and bulk gases, electricity and water, direct labor, equipment maintenance, and depreciation build up into COGS, gross profit, and EBITDA — the most granular cost stack in this class of template.
Highlights:
- Six distinct manufacturing cost lines, each independently escalated
- COGS per wafer and per good die calculated automatically
- Gross margin, EBIT, and EBITDA margin flow through live
- R&D and SG&A tied to headcount plus non-labor spend
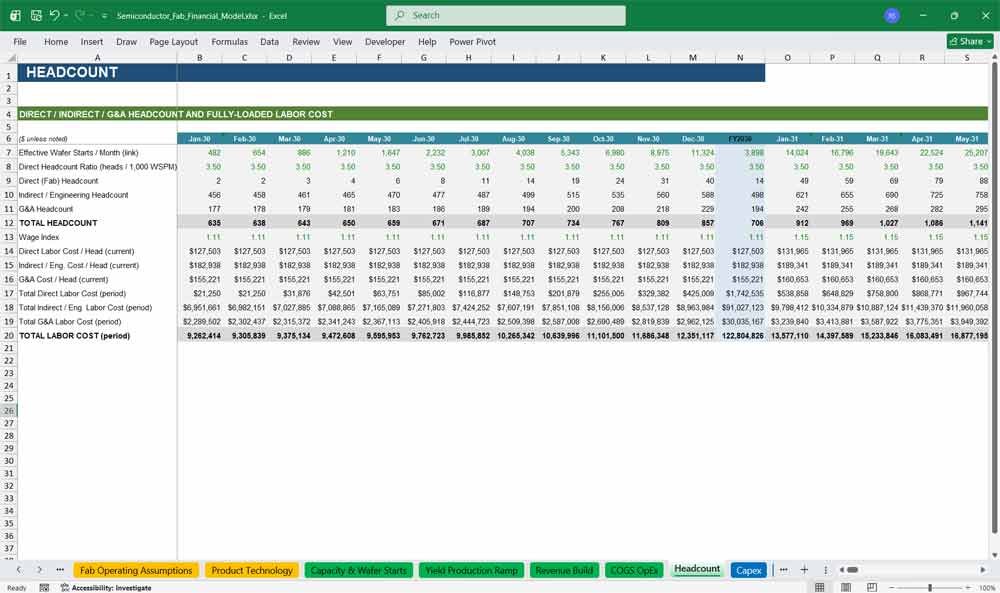
10. Headcount
Builds direct, indirect, and G&A headcount from the ground up, scaling with utilization and wage inflation, and feeds fully-loaded labor cost straight into both the manufacturing cost stack and operating expenses elsewhere in the model.
Highlights:
- Direct headcount scales with wafer-starts and a heads-per-1,000-WSPM ratio
- Indirect and G&A headcount scale with the utilization ramp
- Wage inflation applied automatically to every labor cost line
- Total labor cost feeds COGS, R&D, and SG&A
11. Capex
Models the construction spend curve exactly as real fabs spend it: a four-phase S-curve from slow-start through peak burn to tapering, split into tool, shell, cleanroom, and utility categories, plus ongoing sustaining capex once the fab is operating.
Highlights:
- Four-phase construction S-curve, fully adjustable within your own ranges
- Automatic split into tools, shell, cleanroom, utilities, and contingency
- Post-COD sustaining capex modeled as a percent of revenue
- Cumulative capex tracked across the full 23-year model
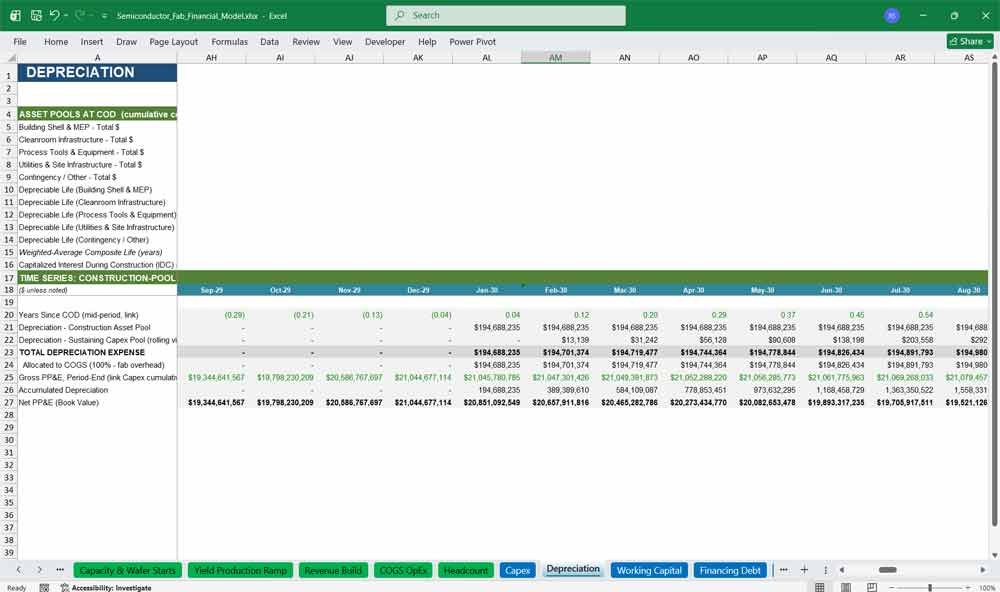
12. Depreciation
Runs true vintage straight-line depreciation by asset category, including capitalized interest during construction added to the asset base, with a full gross and net PP&E roll-forward that ties directly into the balance sheet.
Highlights:
- Category-specific depreciable lives (tools, shell, cleanroom, utilities)
- Capitalized construction-period interest correctly added to the asset base
- Rolling vintage depreciation for ongoing sustaining capex
- Gross PP&E, accumulated depreciation, and net book value roll-forward
13. Working Capital
Converts DSO, DIO, and DPO assumptions into accounts receivable, inventory, and accounts payable, then calculates the change in net working capital that flows straight into the cash flow statement and DCF.
Highlights:
- Editable DSO, DIO, and DPO day-count assumptions
- Accounts receivable, inventory, and payables calculated automatically
- Net working capital and period-over-period change both tracked
- Correctly handles mixed monthly, quarterly, and annual periods
14. Financing Debt
Models construction debt draws matched to the capex S-curve, capitalized interest during construction, and a full term-loan amortization schedule post-COD, so your financing structure is as detailed as your operating model.
Highlights:
- Construction debt draws tied directly to the capex spend curve
- Interest during construction capitalized rather than expensed
- Term loan amortization schedule with interest and principal by period
- Editable debt/equity split and loan tenor assumptions
15. Tax & Incentives
A real cash-tax model: EBT flows through net operating loss carryforwards (with the 80% TCJA limitation), a CHIPS Act 25% investment tax credit with its own carryforward, and a blended statutory tax rate to arrive at cash taxes payable.
Highlights:
- Full NOL carryforward mechanics with the 80% TCJA cap
- CHIPS Act Section 48D investment tax credit modeled explicitly
- ITC and NOL carryforwards tracked separately, period by period
- Cash tax payable calculated after both credits and losses
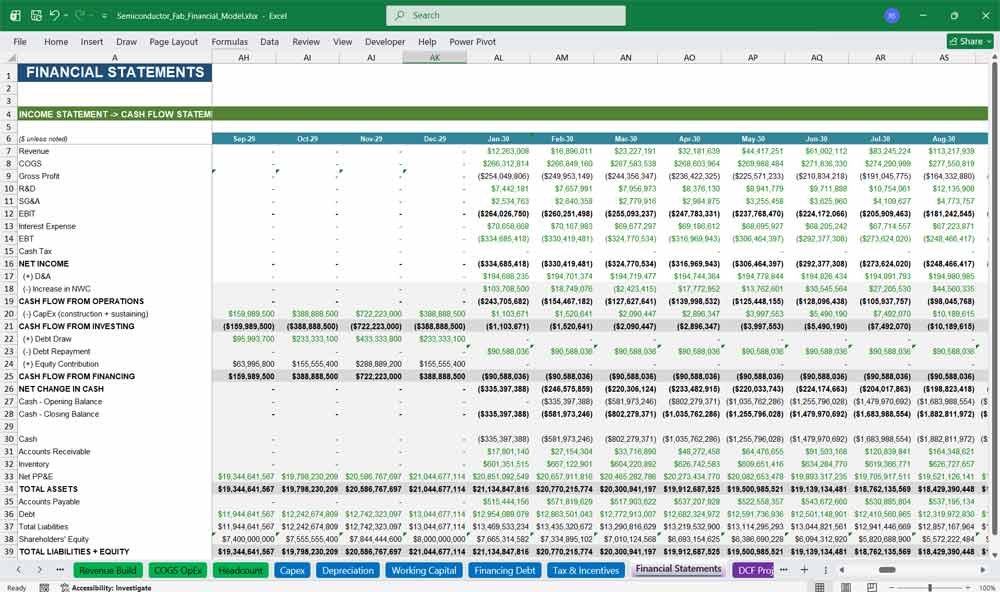
16. Financial Statements
A fully linked three-statement model — income statement, cash flow statement, and balance sheet — spanning construction and all 20 operating years, with a balance check that ties to zero in every single period.
Highlights:
- Income statement, cash flow statement, and balance sheet fully linked
- Balance check row confirms the model balances every period
- Correctly separates non-cash items (like capitalized interest) from cash flow
- Spans construction and operations on one consistent structure
Value Your Semiconductor Fab Model With A DCF
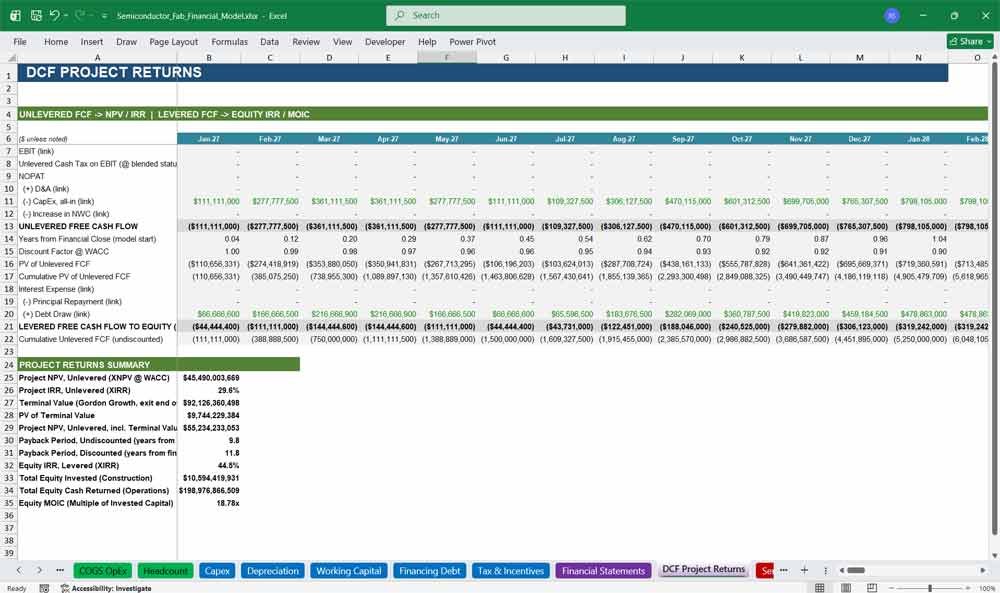
17. DCF Project Returns
Calculates unlevered and levered free cash flow across the full 23-year model and returns project NPV, IRR, payback, terminal value, equity IRR, and MOIC using date-accurate XNPV and XIRR rather than approximated periods.
Highlights:
- Unlevered FCF for project-level NPV and IRR
- Levered FCF to equity for equity IRR and MOIC
- Date-accurate XNPV/XIRR calculations, not simplified annual approximations
- Gordon Growth terminal value with discounted and undiscounted payback
18. Sensitivities Scenarios
A genuinely live Base/Upside/Downside scenario switch: change one cell and WACC, ASP erosion, ramp speed, yield-learning speed, and CapEx outturn all update together, flowing through every tab down to the DCF and dashboard.
Highlights:
- One switch cell drives five key value drivers simultaneously
- Base, Upside, and Downside cases pre-built and fully editable
- Live-linked returns summary updates the instant you recalculate
- No copy-pasting values between tabs required
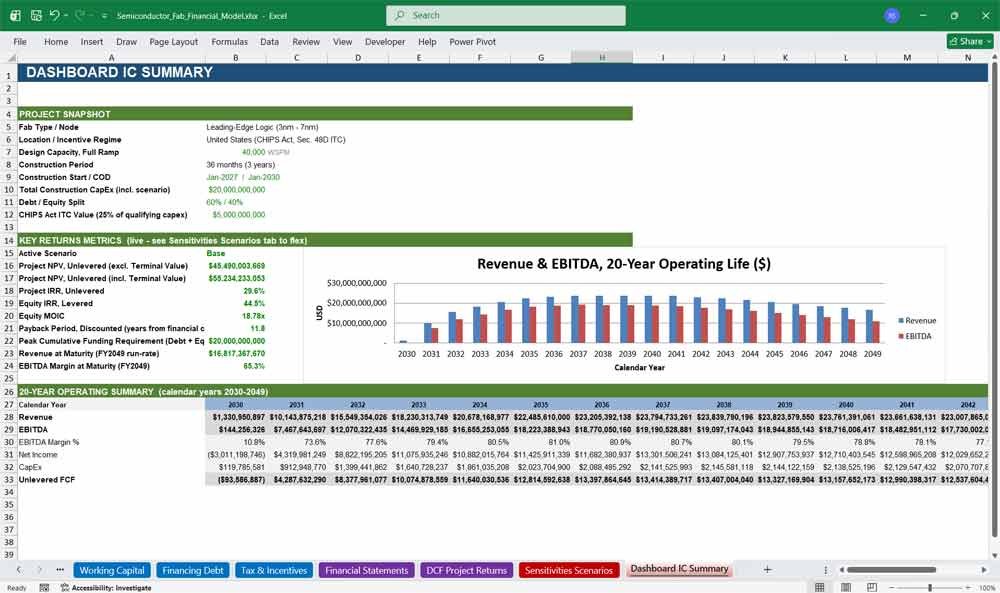
19. Dashboard IC Summary
An investment-committee-ready summary page: project snapshot, headline returns metrics, and a full 20-year revenue and EBITDA table and chart, pulling together every tab into the page a decision-maker actually reads.
Highlights:
- One-page project snapshot: capacity, capex, location, incentives
- Key returns metrics pulled live from the DCF tab
- 20-year annual revenue, EBITDA, and net income summary table
- Built-in Revenue vs. EBITDA chart across the full operating life
Semiconductor Fab Frequently Asked Questions
Is this model built in Excel, and will it work with my version?
Yes — this is a native Excel (.xlsx) workbook built with standard, widely-supported formulas (SUMIFS, INDEX/MATCH, SUMPRODUCT, XNPV, XIRR, and similar). It opens cleanly in any modern version of Excel and in Excel for Microsoft 365.
Can I change the assumptions, or is this a locked template?
Every assumption is a clearly marked, editable input cell — capacity, node mix, pricing, costs, financing terms, tax rates, and more. Nothing is hardcoded or locked. Change any input and the model recalculates automatically through every linked tab.
Do I need to know how to build financial models to use this?
No. The Cover Control tab explains the color coding and links to every section, and each tab is clearly labeled and organized in a logical build order. Basic Excel familiarity is enough to navigate and adjust it; building it from scratch is what would require deep modeling expertise.
Is the model actually error-checked, or just formatted to look finished?
The workbook recalculates with zero formula errors, and the three-statement model includes a built-in balance check that ties to zero in every one of the 131 time periods across the full 23-year model, including under stressed scenarios.
What if my fab is a different size, node, or location than the base case?
The base case is a 40,000 wafer-per-month, 3nm-7nm fab with a $20 billion construction budget in a U.S. CHIPS Act location, but capacity, node mix, capex, location-driven tax rates, and every other driver are input cells you can change directly.
Does the model include scenario or sensitivity analysis?
Yes. The Sensitivities Scenarios tab has a live Base/Upside/Downside switch that flows through WACC, ASP erosion, ramp speed, yield-learning speed, and CapEx outturn simultaneously, with returns updating automatically once you recalculate.
What outputs does the model actually produce?
Project NPV and IRR (unlevered), equity IRR and MOIC (levered), discounted and undiscounted payback period, a full 20-year revenue and EBITDA summary, and a complete three-statement financial model, all summarized on the Dashboard IC Summary and Cover Control tabs.
Does this model account for taxes and government incentives?
Yes. It includes a full net operating loss carryforward schedule with the 80% TCJA limitation and models the CHIPS Act’s 25% Section 48D investment tax credit, including its own carryforward against future tax liability.
Is this suitable for an actual investment decision, or just for learning?
This model is built to institutional standards — a fully linked three-statement model, date-accurate DCF, and a balance sheet that ties every period — but any real investment decision should be reviewed by your own finance, tax, and legal advisors using your own diligenced assumptions.
Further Reading
Fabless Company Model: Download a comprehensive template is specifically designed to handle complex fabless company variables, inventory turn calculations, and capital-efficient gross margin forecasting.
Final Notes on the Financial Model
This 20 Year Semiconductor Fab Financial Model focuses on balancing capital expenditures with steady revenue growth from the vast array of wafer sales. By optimizing operational costs, power efficiency, and maximizing high-margin services like Microprocessor, Memory Chip, and GPU sales, the model ensures sustainable profitability and cash flow stability.