
Fabless Company Financial Model Template
Building a financial model for a fabless semiconductor company is unlike modeling any other business, and this Fabless Semiconductor Financial Model was built specifically to solve that problem. Unlike generic startup spreadsheets that reduce cost of goods sold to a single percentage-of-revenue assumption, this Excel financial model template constructs a true bottom-up wafer-cost build for every product — wafer size, wafer price, gross die per wafer, yield, good die per wafer, packaging, test, freight and scrap all roll up into a fully loaded unit COGS. Whether you’re a founder preparing a fundraising data room, a CFO building a five-year operating plan, or an analyst modeling the semiconductor sector, this template gives you the industry-specific detail that off-the-shelf financial model templates simply don’t have.
5-Year Financial Model for a Fabless Semiconductor Company
This fully linked, formula-driven Excel model spans two years of historical monthly data and five years of forecast — monthly detail for years one through three with annual roll-up columns, and annual detail for years four and five — across 20 professionally structured, color-coded tabs covering revenue, COGS, fabless foundry supply, R&D and NRE, headcount, operating expenses, capex and depreciation, working capital, and a complete three-statement model (P&L, cash flow and balance sheet) that balances automatically every single period. A dynamic date engine means changing one start-date cell instantly re-dates every tab in the workbook, so the model stays usable for years, not just for one forecast cycle.
Beyond the operating model, this semiconductor financial model template includes a standalone DCF valuation tab with both perpetuity growth and exit multiple terminal value methods, a Base/Upside/Downside scenario switch that re-flexes the entire model with one click, an annual KPI dashboard, and a built-in Checks tab that independently verifies the balance sheet, cash roll-forward and retained earnings every period. If you need a credible, investor-ready, fully editable semiconductor company financial model — for fundraising, board reporting, budgeting or valuation — this template is built to deliver.
Semi Fab Tab-by-Tab Highlights
01. Cover Control
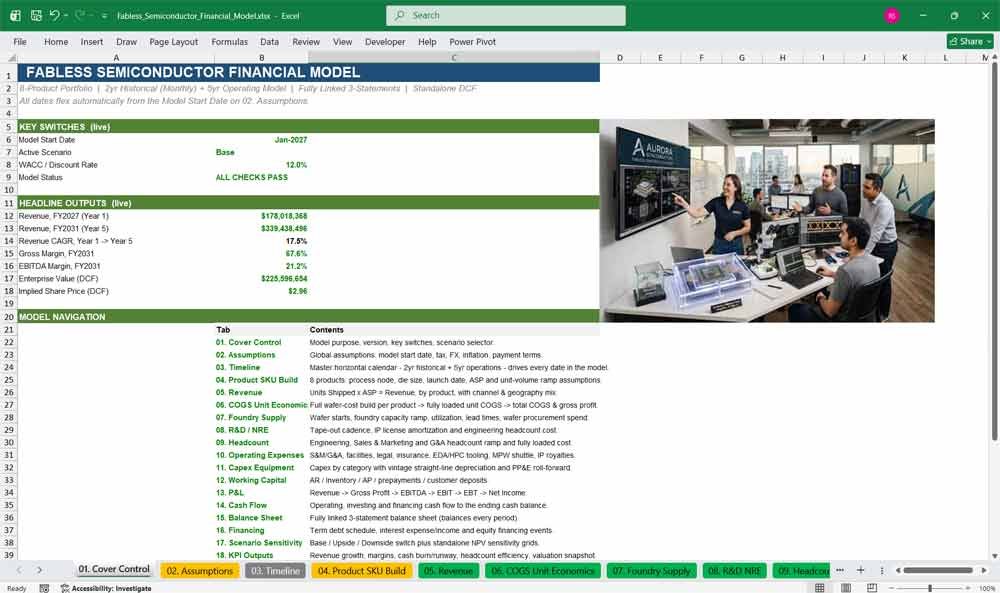
The Cover Control tab is the command center of this fabless semiconductor financial model, giving investors and operators a live dashboard of headline revenue, margin, valuation and model-health metrics, plus one-click navigation to all twenty tabs — ideal for board decks, investor updates and quick model orientation.
- Live headline KPIs: revenue, gross margin, EBITDA margin, enterprise value and share price
- One-click navigation table linking to all 20 tabs with plain-English descriptions
- “Model Status” indicator confirming the entire balance sheet ties out
- Color-coded legend explaining inputs vs. formulas vs. cross-tab links
02. Assumptions
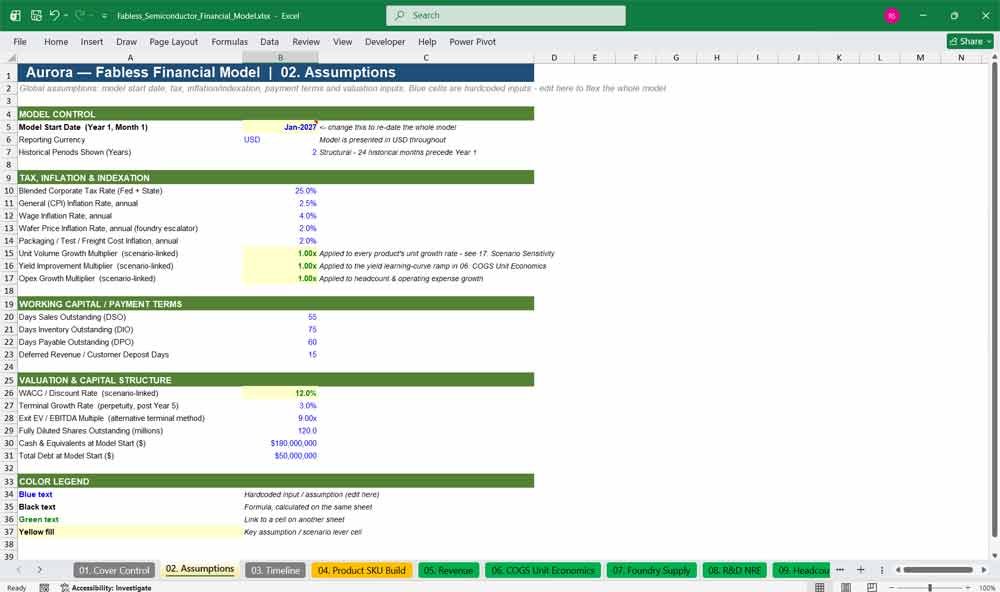
Every driver in this semiconductor Excel model — tax rate, inflation, wage growth, wafer price escalation, payment terms and WACC — lives in one editable Assumptions tab, so founders and analysts can stress-test their fabless chip company’s financial projections without hunting through formulas across twenty interconnected tabs.
- Single Model Start Date cell that reflows every date in the workbook
- Tax, inflation, wage and wafer-price escalation assumptions in one place
- DSO, DIO, DPO and deferred-revenue-day inputs driving working capital
- WACC, terminal growth and diluted share count feeding the DCF tab
Fabless Company Financial Economics
03. Timeline
The Timeline tab is the dynamic date engine behind this semiconductor financial model template, generating two years of historical months plus five years of forecast — monthly for years one through three, annual after — entirely from a single start-date input, keeping every tab perfectly synchronized automatically.
- 65-column horizontal calendar spanning historical and forecast periods
- Automatic “Actual” vs. “Forecast” flagging for every single period
- Annual roll-up columns generated alongside monthly detail for years 1-3
- Change one date and the entire 20-tab model instantly re-dates itself
04. Product SKU Build
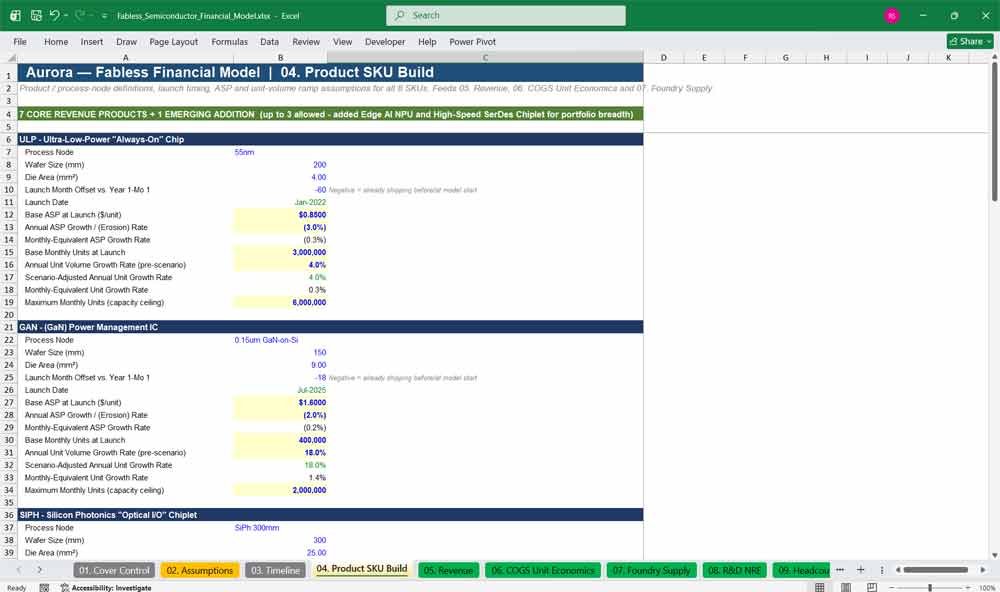
This tab defines the eight-product portfolio inside the fabless semiconductor model — from ultra-low-power always-on chips to co-packaged optics engines — capturing process node, die size, launch date, ASP and unit-volume ramp assumptions that drive every downstream revenue and cost calculation in the workbook.
- 8 fully modeled SKUs spanning mature nodes to emerging chip categories
- Process node, wafer size and die area assumptions captured per product
- Launch-date gating so unlaunched products correctly show zero revenue
- Scenario-linked unit growth rates feeding directly into the Revenue tab
05. Revenue
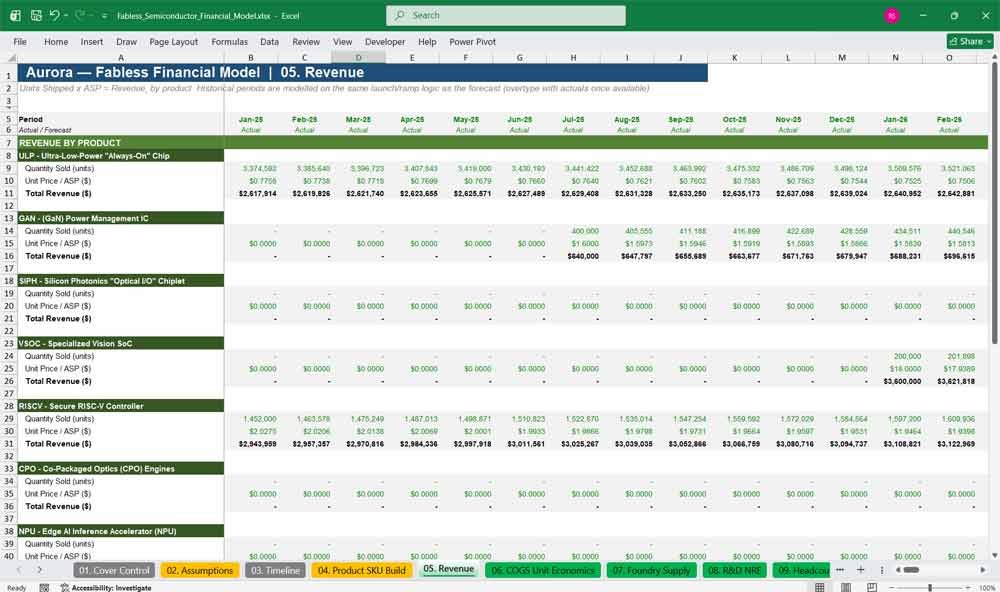
The Revenue tab converts unit shipments and ASP into top-line revenue for each of the eight semiconductor products, complete with channel mix (direct vs. distribution) and geography mix (Americas, EMEA, APAC) reporting splits — giving fundraising decks and investor models a fully auditable revenue build.
- Units Shipped × ASP = Revenue, calculated for all 8 products, every period
- Automatic launch-date gating and capacity-ceiling caps on unit growth
- Blended ASP and total units tracked across the full 7-year horizon
- Built-in channel-mix and geography-mix revenue reporting splits
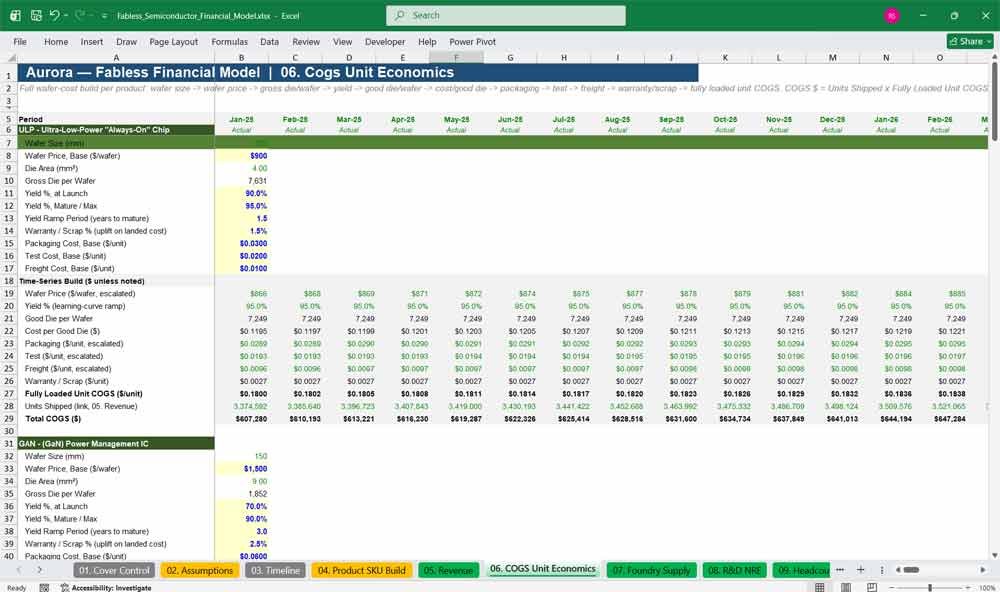
06. COGS Unit Economics
A true bottom-up wafer-cost build sets this model apart from generic percentage-of-revenue templates: wafer size, wafer price, gross die per wafer, yield, good die per wafer, packaging, test, freight and scrap combine into a fully loaded unit COGS for every semiconductor product, every single period.
- Full wafer-to-unit COGS waterfall — never a flat COGS percentage
- Real die-per-wafer geometry formula plus a yield learning-curve ramp
- Packaging, test, freight and warranty/scrap costs modeled per unit
- Gross profit and gross margin calculated automatically from the build
07. Foundry Supply
Because this is a fabless foundry model, the Foundry Supply tab tracks outsourced wafer demand against foundry capacity, utilization and lead times — giving operators and investors visibility into supply-chain risk, capacity headroom and blended wafer pricing across the company’s entire product portfolio.
- Wafer starts required, calculated from unit demand and die yield
- Foundry capacity ramp with utilization percentage tracked every period
- Lead-time sensitivity that automatically lengthens at high utilization
- Indicative wafer procurement spend and blended wafer price reporting
08. R&D / NRE
Tape-out cadence, mask and characterization NRE, IP license amortization and engineering headcount cost all roll up into Total R&D Expense on this tab — a critical, often-overlooked cost driver for any semiconductor startup financial model or chip design company budget template.
- Tape-out frequency and NRE cost per tape-out, by process node
- IP license amortization schedule over a fully configurable period
- Engineering headcount cost linked directly from the Headcount tab
- Total R&D expense flows straight into the P&L, fully automated
09. Headcount
This headcount planning tab models Engineering, Sales & Marketing and G&A staffing ramps with fully loaded compensation costs that escalate with wage inflation — an essential building block for any startup financial model or semiconductor company forecasting personnel spend across a five-year operating plan.
- Three departments, each with independent headcount growth and cost drivers
- Wage-inflation-escalated, fully loaded salary assumptions by department
- Scenario-linked growth multiplier for instant upside/downside planning
- Headcount ceilings keep long-range hiring projections realistic
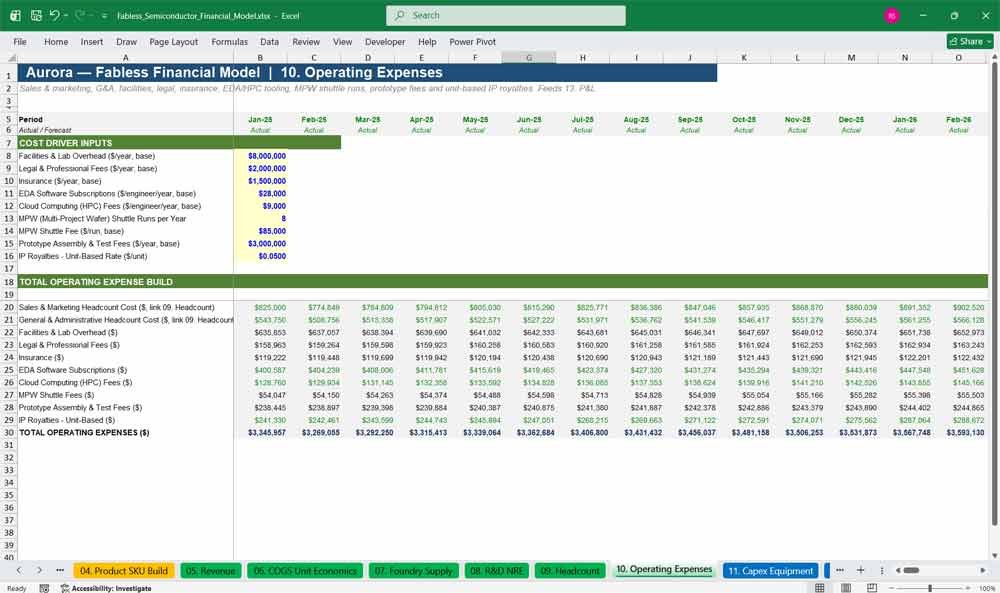
10. Operating Expenses
Beyond salaries, this tab captures the operating costs unique to a fabless chip company — EDA software subscriptions, cloud HPC fees, MPW shuttle runs, prototype assembly and unit-based IP royalties — giving this semiconductor financial model far more granularity than a generic SaaS opex template.
- EDA software, cloud/HPC and MPW shuttle costs modeled explicitly
- Facilities, legal, insurance and prototype assembly & test cost lines
- Unit-based IP royalty expense linked to total shipment volume
- Every cost line escalates automatically with inflation and headcount growth
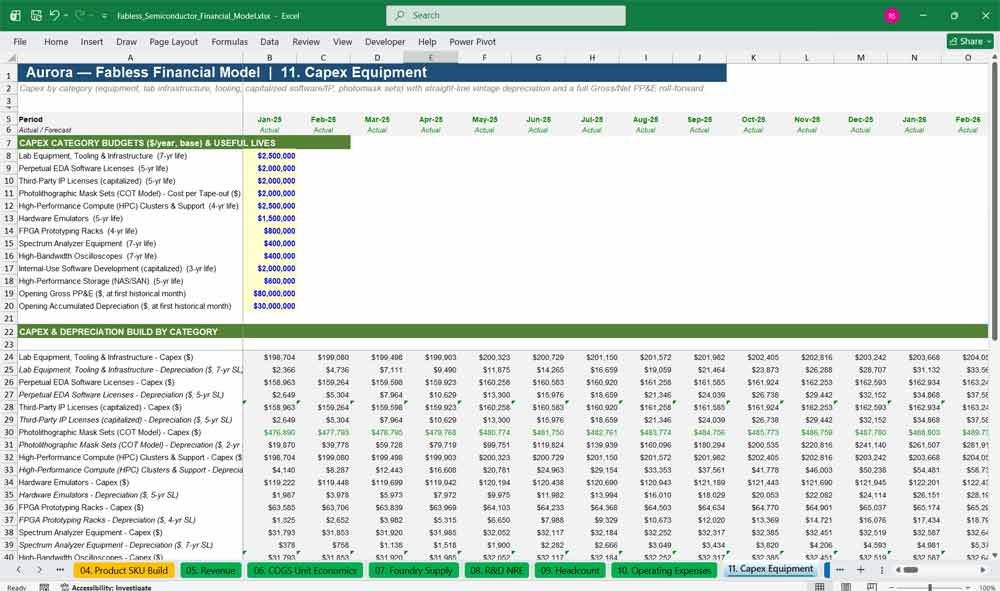
11. Capex Equipment
Lab equipment, EDA licenses, mask sets, HPC clusters, emulators and test equipment are all capitalized and depreciated here, with a full vintage straight-line depreciation schedule and Gross/Net PP&E roll-forward — exactly the capex detail investors expect from a credible semiconductor financial model template.
- 11 distinct capex categories specific to chip design companies
- Photomask set cost tied directly to the tape-out schedule
- Vintage straight-line depreciation by asset category and useful life
- Full Gross PP&E, Accumulated Depreciation and Net PP&E roll-forward
Fabless Company Financial Statements
12. Working Capital
Accounts receivable, inventory, accounts payable, prepayments and customer deposits are all driven by editable DSO, DIO and DPO assumptions on this tab, automatically calculating the change in net working capital that flows straight into the cash flow statement and DCF valuation.
- DSO/DIO/DPO-driven accounts receivable, inventory and payable balances
- Customer deposit and deferred revenue modeling built in
- Net working capital calculated every period, monthly and annual
- Change in NWC feeds directly into Cash Flow and DCF tabs
13. P&L
A clean, fully linked income statement carries revenue through gross profit, EBITDA, EBIT and net income, pulling every line item directly from the operating tabs beneath it — nothing is hardcoded, making this semiconductor P&L template fully auditable for lenders, investors and auditors alike.
- Revenue through Net Income, fully linked with zero hardcoded values
- Gross margin and EBITDA margin calculated automatically each period
- Interest expense and interest income linked from the Financing tab
- Historical and forecast periods shown on one continuous timeline
14. Cash Flow
Operating, investing and financing cash flows roll forward to an ending cash balance that ties directly to the balance sheet, giving founders and CFOs a reliable cash runway and burn-rate view — a must-have for any semiconductor startup managing capital-intensive R&D and capex spend.
- Full indirect-method operating cash flow build, start to finish
- Capex, debt repayment and equity financing activity all captured
- Ending cash balance reconciles exactly to the balance sheet
- Supports accurate cash runway and monthly/annual burn-rate analysis
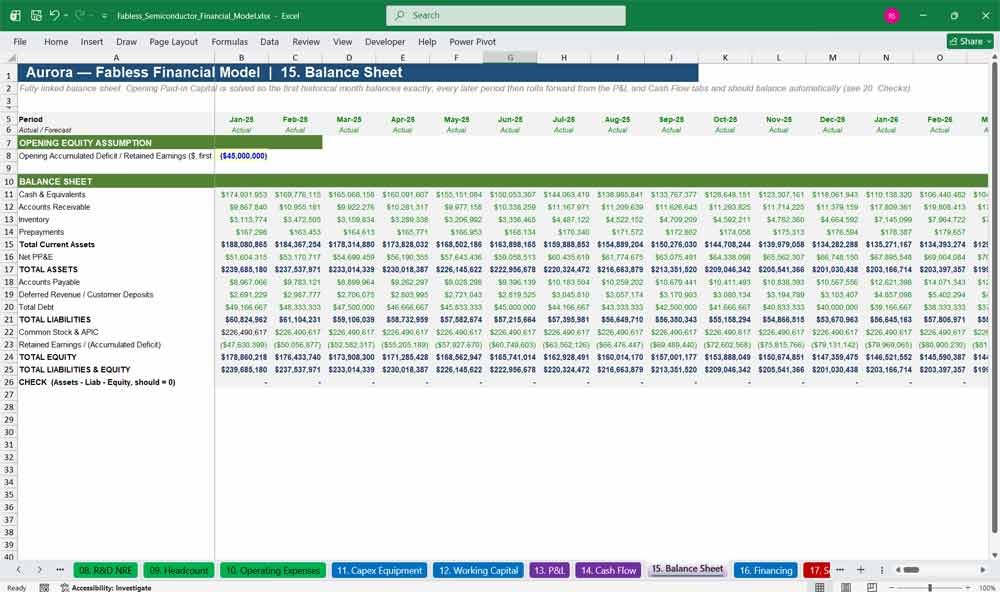
15. Balance Sheet
This fully linked three-statement balance sheet balances automatically every single period, from the first historical month through the final forecast year, thanks to a solved opening equity plug — giving investors immediate confidence in the structural integrity of this semiconductor financial model.
- Fully linked balance sheet that balances every period, guaranteed
- Cash, AR, inventory, PP&E, debt and equity all cross-linked
- Opening capital structure solved so historical periods balance exactly
- Feeds directly into the automated Checks tab for instant validation
16. Financing
A term-debt amortization schedule, interest income and expense calculations, and a modeled equity financing event give this semiconductor financial model the capital-structure realism venture-backed chip companies need when planning runway extensions, debt covenants and future funding rounds.
- Straight-line term debt amortization with a configurable interest rate
- Interest income on cash balances, linked to the cash flow tab
- Modeled growth-equity raise event with adjustable timing and size
- All financing activity flows automatically into cash flow and the balance sheet
Fabless Foundry Model Key Drivers & Metrics
17. Scenario Sensitivity
A Base / Upside / Downside scenario switch instantly re-flexes unit growth, yield improvement, opex growth and the discount rate across the entire model, alongside standalone NPV sensitivity grids on WACC, terminal growth and exit multiple — powerful stress-testing for any semiconductor valuation model.
- One dropdown switch drives Base, Upside and Downside cases instantly
- Scenario multipliers flow into unit growth, yield and opex tabs
- WACC vs. terminal growth NPV sensitivity grid, fully formula-driven
- WACC vs. exit multiple NPV sensitivity grid for cross-checking valuation
18. KPI Outputs
Revenue growth, gross and EBITDA margin, cash burn, headcount efficiency, Rule of 40 and headline DCF valuation metrics are summarized in one annual dashboard — everything a semiconductor startup needs for an investor update, board meeting or fundraising data room, at a glance.
- Seven-year annual KPI summary, spanning historical through forecast
- Revenue per employee and Rule of 40 tracked automatically every year
- Cash generation/burn and ending cash balance shown by fiscal year
- Enterprise value, equity value and implied share price snapshot included
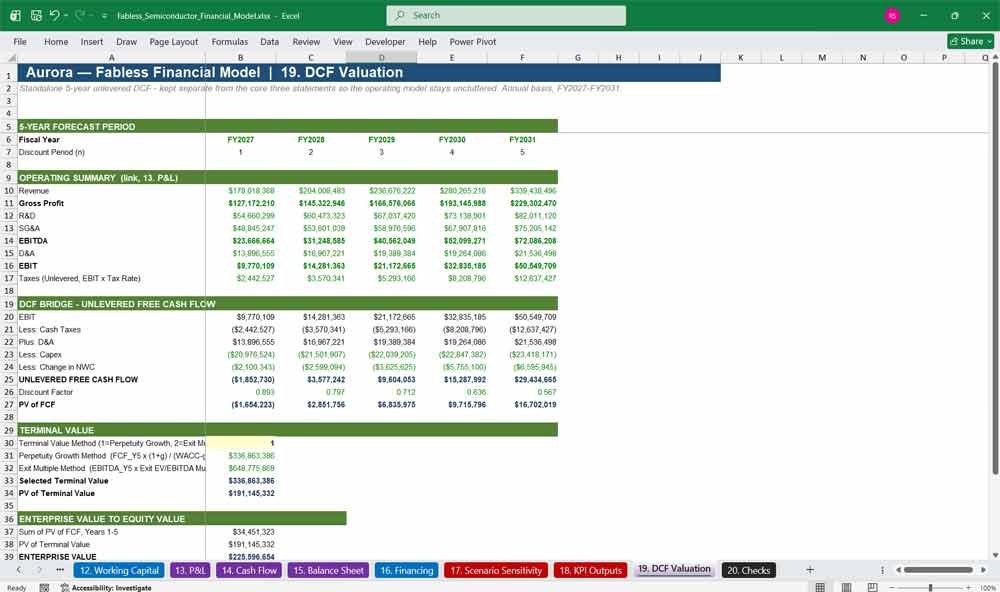
19. DCF Valuation
Kept intentionally separate from the core three statements, this standalone discounted cash flow tab bridges EBIT to unlevered free cash flow, applies both perpetuity growth and exit multiple terminal value methods, and solves for enterprise value, equity value and implied share price.
- Clean 5-year unlevered FCF bridge, uncluttered by operating-model detail
- Perpetuity growth and exit multiple terminal value shown side by side
- Toggle switch lets you select your preferred terminal value method
- Enterprise value to equity value to implied share price, fully linked
Why Value Your Chip Design House With A DCF?
Discounted Cash Flow (DCF) for a Fabless Company
For your Fabless Company a Discounted Cash Flow (DCF) analysis is less about valuing “dirt and diesel” and more about valuing “silicon and software.” Revenue forecasts are driven by product innovation, design wins, market share growth, average selling prices, and end-market demand, while costs include research and development, tape-out expenses, third-party foundry manufacturing, and sales and marketing. The projected free cash flows over a defined high-growth period, along with a terminal value reflecting long-term scalability and intellectual property strength, are discounted to present value to determine the company’s intrinsic value.
WACC for a Fabless Company
Weighted Average Cost of Capital (WACC) is used as the discount rate in valuing a fabless company and reflects the blended cost of equity and debt financing. Fabless firms typically have lower capital expenditure requirements than integrated manufacturers but face significant technology risk, product cycle volatility, customer concentration, and competitive pressures. The WACC captures investors’ required returns, the company’s capital structure, and any tax benefits of debt, representing the minimum return necessary to justify investment in the business.
Sensitivity Analysis for a Fabless Semiconductor Company
Sensitivity analysis is especially important in valuing a fabless company due to uncertainties in product adoption rates, pricing, gross margins, design cycle success, and reliance on external foundries. Analysts commonly test changes in key assumptions such as revenue growth, operating margins, R&D intensity, working capital needs, and WACC. By evaluating how variations in these inputs affect the DCF valuation, sensitivity analysis highlights the most influential value drivers and provides a range of potential outcomes to support strategic and investment decisions.
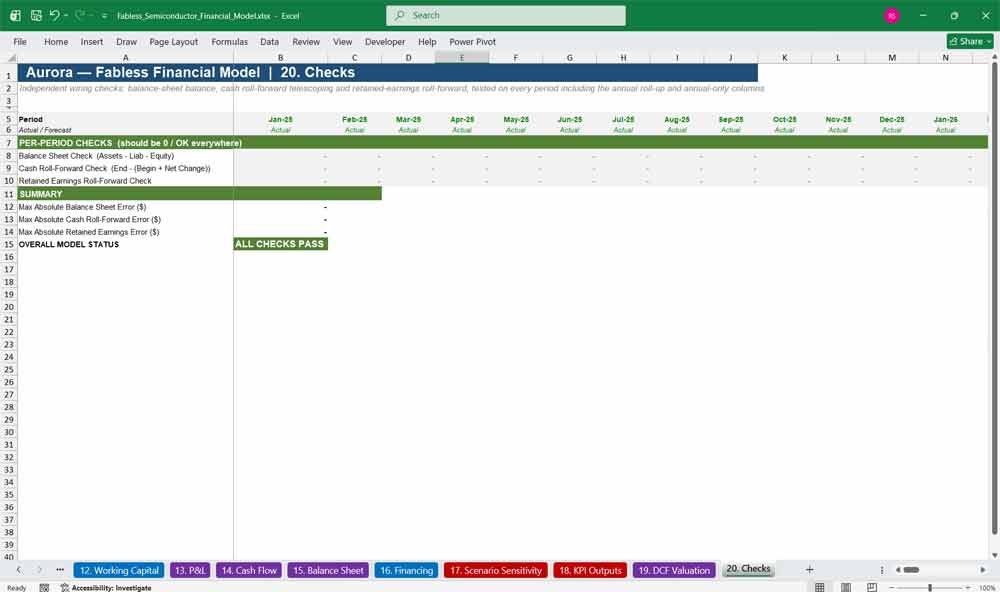
20. Checks
Every serious financial model needs an audit trail, and this Checks tab delivers one: independent balance sheet, cash roll-forward and retained earnings reconciliation tests run on every single period, instantly flagging any wiring error so buyers can trust the model the moment they open it.
- Balance sheet check confirms Assets = Liabilities + Equity, every period
- Cash roll-forward check independently validates the cash flow statement
- Retained earnings roll-forward independently verified against net income
- Single “ALL CHECKS PASS” status flag for instant buyer confidence
Why Buy This Fabless Model
Building a semiconductor financial model from scratch takes weeks — sourcing wafer-cost assumptions, structuring a three-statement model that actually balances, wiring a defensible DCF, and formatting it all to look investor-ready. This template does that work for you: a fully linked, formula-driven, 20-tab Excel model purpose-built for a fabless chip company, with a genuine bottom-up wafer-to-unit COGS build instead of a lazy percentage-of-revenue shortcut, a dynamic date engine that keeps the model useful year after year, a scenario switch for instant upside/downside stress-testing, and an automated Checks tab that proves the model balances before you ever present it to an investor, lender or board member. Whether you’re raising a seed or Series A round, building an annual operating plan, or need a credible valuation model for a semiconductor business, this template saves you days of build time and gives you a level of industry-specific detail — die yield, wafer pricing, mask NRE, MPW shuttle runs — that generic financial model templates simply cannot offer.
Fabless Frequently Asked Questions (Faq)
Q: Is this an actual working Excel model, or just a static template with sample numbers?
A: It’s a fully functional, formula-driven Excel workbook. Every number you see is calculated live from the assumptions — there are no hardcoded results anywhere in the operating model. Change an input and the entire model, all 20 tabs, recalculates automatically.
Q: I run a semiconductor company with a different fiscal year or start date — will this still work for me?
A: Yes. The entire model is built around a single “Model Start Date” cell on the Assumptions tab. Change that one date and every tab — historical months, forecast years, fiscal-year labels — automatically re-dates itself.
Q: Does this model handle actual wafer and yield economics, or is COGS just a percentage of revenue?
A: This model was specifically built to avoid that shortcut. COGS is built bottom-up for each product: wafer size, wafer price, die-per-wafer geometry, yield ramp, packaging, test, freight and scrap all combine into a fully loaded unit cost, which is then multiplied by units shipped.
Q: Can I add, remove or rename the products in the model?
A: Yes. The model ships with 8 fully built product SKUs (die size, node, ASP, unit ramp and full wafer-cost build for each), and the structure is designed so you can copy a product block to add another SKU or repurpose an existing one for your own product line.
Q: Does the model include historical financials, or does it start from a forecast?
A: Both. The model includes 2 years of historical monthly data alongside a 5-year forecast, so you can show trailing performance and a full operating plan in one continuous view.
Q: Is there a valuation tab, or do I need to build my own DCF?
A: A complete standalone DCF valuation is included, kept separate from the three statements so it doesn’t clutter your operating model. It includes both perpetuity growth and exit multiple terminal value methods and solves through to an implied share price.
Q: How do I know the balance sheet actually balances?
A: The model includes a dedicated Checks tab that independently recalculates the balance sheet check, the cash roll-forward, and the retained earnings roll-forward for every single period and displays a clear “ALL CHECKS PASS” status.
Q: Can I run best-case and worst-case scenarios?
A: Yes. A Base / Upside / Downside scenario switch on the Scenario Sensitivity tab instantly re-flexes unit growth, yield improvement, opex growth and the discount rate across the entire model with a single dropdown selection.
Q: What version of Excel do I need, and does it work on Mac?
A: The model uses standard Excel functions (SUM, IF, INDEX/MATCH, SUMPRODUCT and similar) with no macros or add-ins required, so it opens and calculates correctly in modern Excel on both Windows and Mac, as well as in Google Sheets with minor formatting differences.
Q: I’m not a financial modeling expert — will I be able to use this?
A: Yes. Every tab is color-coded (blue for inputs, black for formulas, green for links to other tabs, yellow for key assumptions) and includes a navigation guide on the Cover Control tab, so you always know exactly which cells are safe to edit.
Q: Is this suitable for fundraising, or is it more of an internal planning tool?
A: Both. The structure, formatting and level of financial and operational detail are built to the standard investors expect in a data room, while the assumptions layer is flexible enough for internal budgeting, board reporting and scenario planning.
Q: Can I customize this model for my own semiconductor company’s actual numbers?
A: Absolutely — that’s exactly what it’s designed for. Every assumption (product mix, ASPs, yields, headcount, capex, financing) is a clearly marked, editable input cell, so you can replace the illustrative starting assumptions with your own company’s real figures throughout.
Further Reading
Semiconductorfab Model: Building a modern microchip facility requires immense capital and precise planning. To accurately project your long-term cleanroom costs, minimize investment risks, and secure institutional funding, you can leverage this specialized semiconductor fab financial model..
Final Notes on the Financial Model
This 5 Year Fabless Company Financial Model focuses on balancing capital expenditures with steady revenue growth from your product line. By optimizing operational costs, and power efficiency, and maximizing high-margin services, the models ensure sustainable profitability and cash flow stability.
Download Link On Next Page