
5-Year SaaS CRM Financial Model for Startup Founders
The SaaS CRM Financial Model is a professional, fully linked Excel template for subscription software businesses selling customer relationship management platforms. It forecasts five years of monthly performance, with an annual roll-up for each fiscal year, starting from your own launch or forecast date. Whether you are a founder preparing for a seed or Series A raise, a CFO building an operating plan, or an advisor valuing a SaaS business, this model gives you an investor-ready SaaS financial projection in a format lenders, VCs and boards already know.
Financial Model for a SaaS CRM Startup
Revenue is built bottom-up, not guessed top-down. Website visitors and leads flow through a full SaaS sales funnel (MQL, SQL, demo, trial and paid conversion) to create new customers across Starter, Professional and Enterprise plans. Those customers drive a detailed ARR and MRR build with new, expansion, reactivation, contraction and churned revenue. That build then feeds cohort retention, LTV to CAC, cost of revenue, headcount, operating expenses, CAPEX, working capital and debt and equity schedules. The result is a fully integrated income statement, cash flow statement and balance sheet.
Every number is formula-driven and traceable. Change the start date and the whole model re-dates itself. Switch between Base, Upside and Downside scenarios, or flex churn, pricing, hiring and cost assumptions, and watch SaaS metrics such as net revenue retention, CAC payback, burn, cash runway and valuation update instantly. With colour-coded inputs, built-in integrity checks and a ready-made dashboard, this SaaS financial model template saves weeks of spreadsheet work.
What’s Inside: Tab-by-Tab Guide
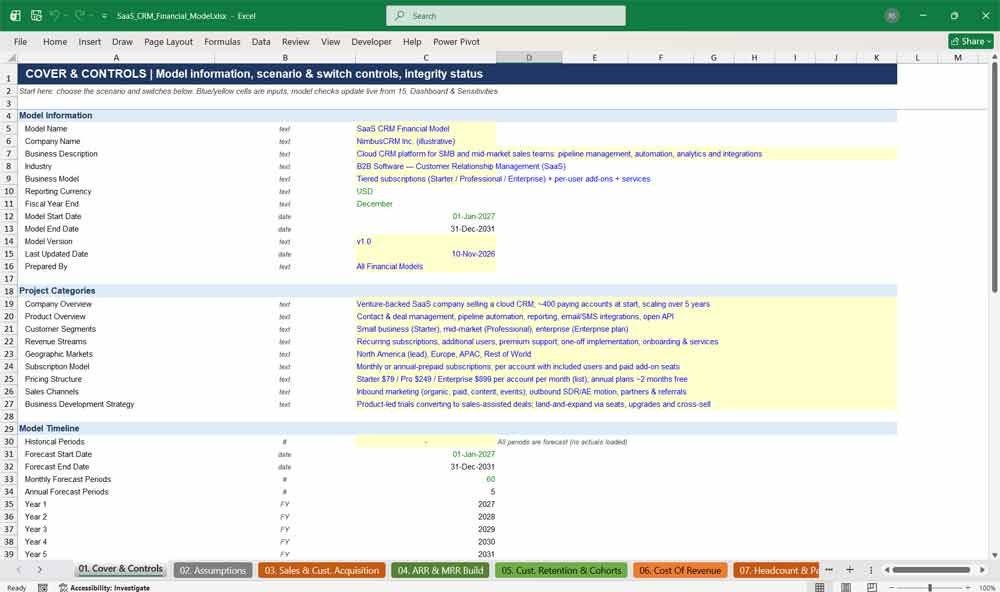
01. Cover & Controls
The Cover & Controls tab is the command centre of this SaaS financial model. You set the company details, choose Base, Upside or Downside scenarios, toggle inflation, tax, debt and equity switches, and see live balance sheet, ARR, MRR and cash check results at a glance.
Highlights:
- Model information, business description and project categories in one place
- Scenario selector with six adjustable levers (revenue, customers, churn, pricing, hiring, costs)
- Eight model switches, including inflation, tax, debt, equity and a cash flow revolver
- Nine live integrity checks, plus an Overall Model Status flag (PASS / REVIEW)
- Colour legend for inputs, formulas and cross-tab links
02. Assumptions
Every input lives on one clearly organised Assumptions tab. Edit pricing tiers, sales funnel conversion rates, churn, expansion, unit costs, salaries, CAPEX, working capital and funding rounds. A single forecast start date drives every date, label and escalation across the SaaS financial forecast.
Highlights:
- Master timeline: change one date and all 60 months re-date automatically
- Starter, Professional and Enterprise pricing with monthly and annual billing, add-on users and services fees
- Full funnel, lead channel mix and geographic mix assumptions
- 48-role headcount roster with salaries and year-end hiring targets
- Funding rounds with amounts, timing and pre-money valuations, plus debt terms
SaaS CRM Revenue & Expenses
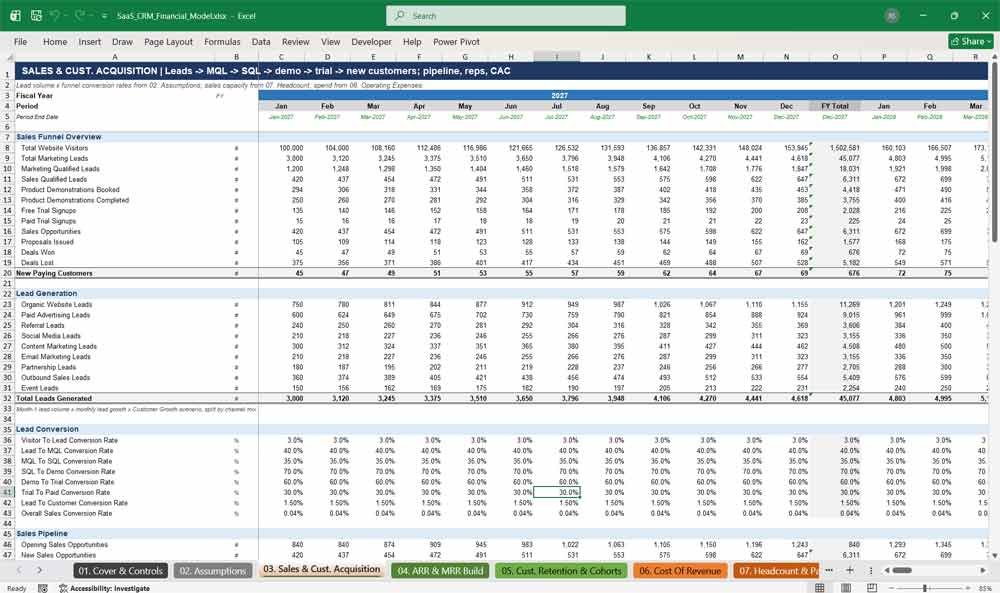
03. Sales & Customer Acquisition
This tab models the complete SaaS sales funnel, from website visitors to new paying customers. It tracks leads by channel, MQL to SQL conversion, demos, trials, pipeline, sales rep productivity and quota attainment, and calculates fully loaded customer acquisition cost (CAC) every month.
Highlights:
- Funnel from visitors to leads, MQL, SQL, demo, trial and paid customers
- Lead generation across nine channels, including organic, paid, referral, outbound and events
- Sales pipeline with weighted pipeline value and coverage
- Rep productivity, deals per rep and quota attainment
- CAC, bookings, magic number and sales efficiency
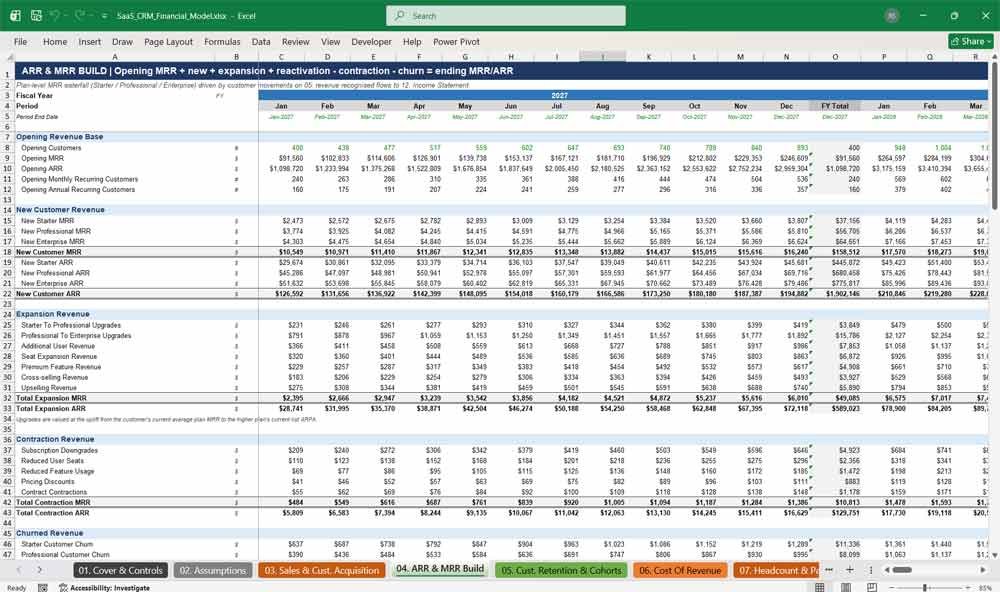
04. ARR & MRR Build
The ARR & MRR Build is the revenue engine. It reconciles opening MRR through new, expansion, reactivation, contraction and churned revenue to ending MRR and ARR by plan tier. Revenue recognition then flows straight into the income statement, so your recurring revenue forecast stays consistent throughout.
Highlights:
- Full MRR and ARR waterfall with monthly reconciliation
- New MRR by Starter, Professional and Enterprise plan
- Expansion from upgrades, additional users, seats, upsell and cross-sell
- Contraction and churn broken down by cause and plan
- Revenue recognition for subscriptions, implementation, onboarding and services
05. Customer Retention & Cohorts
Understand how long customers stay and how much they are worth. This tab tracks customer movements, logo retention, gross and net revenue retention, and monthly acquisition cohorts. It also calculates customer lifetime value, LTV to CAC ratio and CAC payback period for investor-grade SaaS unit economics.
Highlights:
- Customer roll-forward: new, reactivated, upgraded, downgraded and churned
- Monthly, quarterly and annual retention and churn rates
- Gross Revenue Retention (GRR) and Net Revenue Retention (NRR)
- Twelve acquisition cohorts, with survival at months 1, 3, 6, 12, 24 and 36
- LTV, LTV:CAC and CAC payback, plus customer segmentation
06. Cost of Revenue
Calculate true SaaS gross margin with a detailed cost of revenue build. Cloud hosting, infrastructure, third-party APIs, support teams, payment processing and direct delivery costs are driven by customer numbers, billings and headcount, then escalated by inflation and your selected cost scenario.
Highlights:
- Cloud infrastructure costs across ten line items
- Software infrastructure, including APIs, email/SMS delivery, security and licences
- Customer support and success payroll linked from the headcount tab
- Payment processing fees driven by billings
- Gross profit, gross margin and per-customer unit economics
07. Headcount & Payroll
Plan your team role by role. The headcount tab ramps 48 positions across six departments from current staff to each year-end target. It then calculates salaries, payroll taxes, benefits, bonuses, recruitment fees and severance, and maps payroll to cost of revenue, operating expenses and capitalised development.
Highlights:
- Monthly headcount by role across Management, Sales, Marketing, Product & Engineering, Customer Success and G&A
- Opening, hires, departures (with turnover) and closing headcount
- Fully loaded payroll, including taxes, benefits and bonus accrual
- Department payroll totals and payroll cost mapping
- Revenue, ARR, payroll and customers per employee
08. Operating Expenses
Forecast every operating cost a growing SaaS company faces. Sales and marketing, research and development, general and administrative, technology, professional fees and other expenses are driven by budgets, headcount and fixed amounts, each escalated by its own category growth rate.
Highlights:
- 16 sales and marketing lines, including paid ads, SEO, events and commissions
- 12 R&D lines, including expensed product development payroll
- G&A, office, insurance, software and professional fees
- Category-specific growth rates and inflation linkage
- Opex as a percentage of revenue and opex per employee
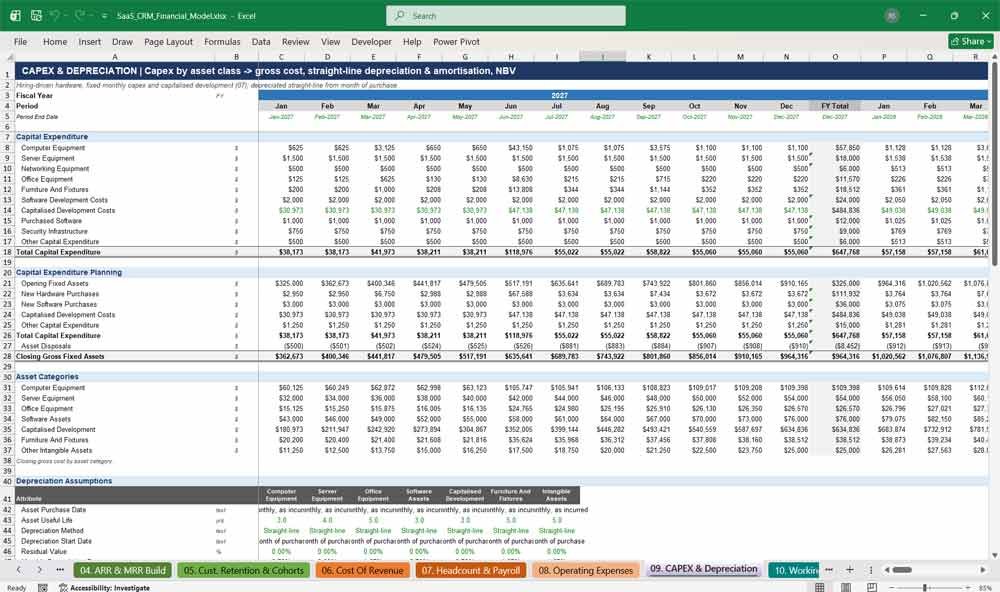
09. CAPEX & Depreciation
Track capital investment with a clear fixed asset schedule. Hardware is driven by new hires, software and infrastructure by monthly budgets, and development by capitalised engineering payroll. Straight-line depreciation and amortisation run by asset class from the month of purchase.
Highlights:
- Capital expenditure across ten asset types
- Capitalised software development linked to engineering payroll
- Useful life and depreciation rate by asset category
- Accumulated depreciation, amortisation and net fixed assets
- CAPEX as a percentage of revenue, per employee and per customer
SaaS CRM Startup Financial Statements
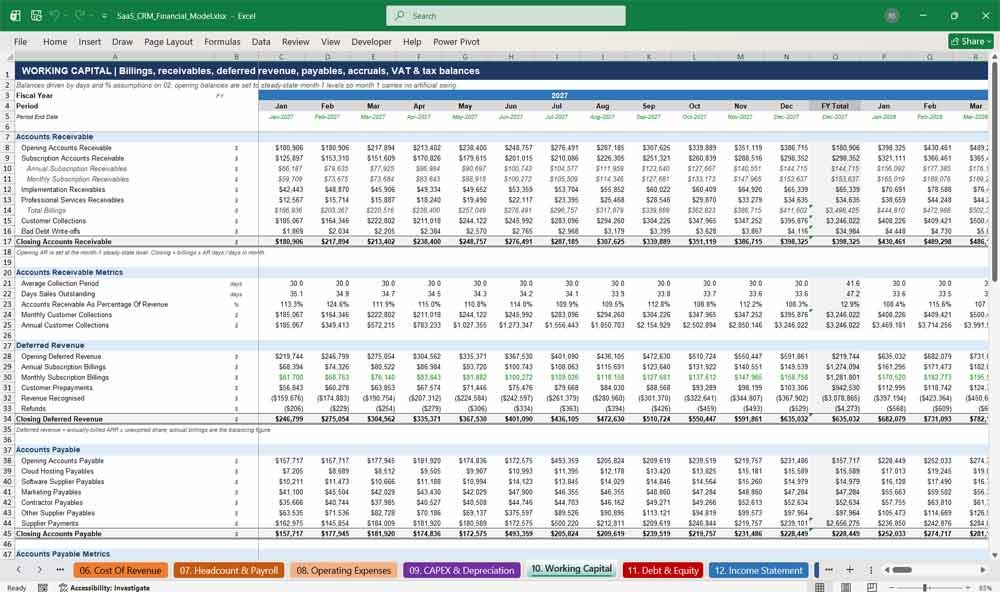
10. Working Capital
SaaS cash flow depends on billing terms. This tab models accounts receivable, deferred revenue from annual prepayments, accounts payable, accruals, VAT and corporation tax. That lets you see how annual billing and collection days change your cash position and net working capital each month.
Highlights:
- Accounts receivable by revenue stream, collections and bad debt
- Deferred revenue roll-forward from annual subscription billings
- Accounts payable by supplier type, plus supplier payments
- VAT, accrued payroll, corporation tax and other balances
- DSO, DPO, cash conversion cycle and change in working capital
11. Debt & Equity
Model your entire funding journey. Founder, seed, Series A, B and C rounds come with pre-money valuations and dilution, alongside term debt, venture debt, convertible notes and a revolving credit facility. Interest, repayments, financing fees and shareholders’ equity all reconcile automatically.
Highlights:
- Equity funding rounds with timing, share price and post-money valuation
- Cap table: founder shares, investor shares, option pool and ownership
- Debt drawdowns, scheduled and early repayments, and note conversions
- Revolver that keeps cash at your minimum balance
- Net debt, debt to equity, enterprise value and equity value
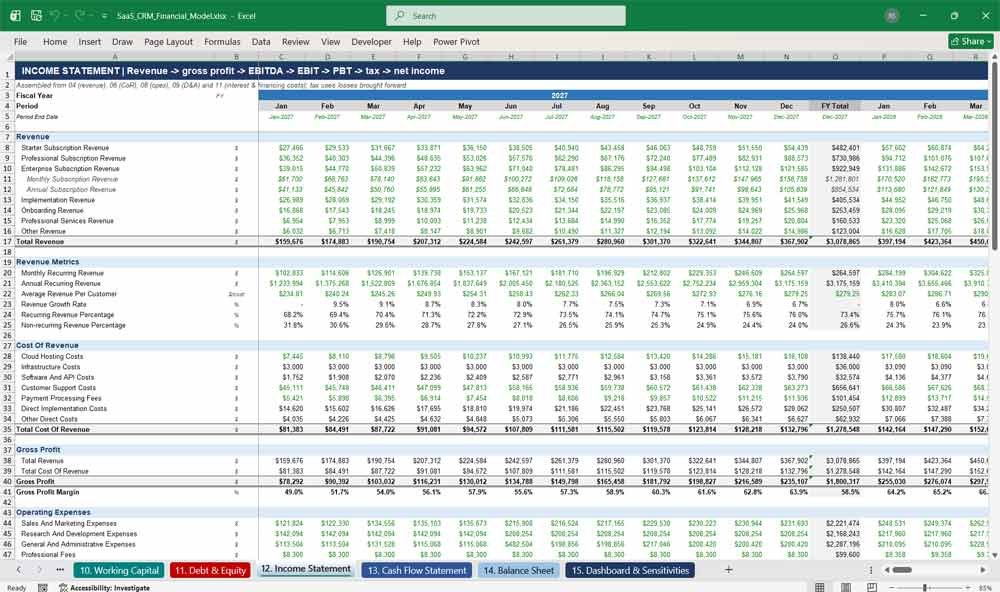
12. Income Statement
A clean monthly and annual SaaS profit and loss statement. Revenue by plan and stream flows through cost of revenue, gross profit, operating expenses, EBITDA, depreciation, operating profit, interest and tax to net income. Tax losses are carried forward automatically.
Highlights:
- Revenue by subscription tier, plus implementation, onboarding and services
- Gross profit, EBITDA, EBIT and net income with margins
- Interest income, interest expense and financing costs
- Corporation tax with tax losses brought forward
- Growth rates and operating leverage
13. Cash Flow Statement
The indirect cash flow statement shows exactly where cash goes. Operating, investing and financing activities reconcile to closing cash every month. Burn rate, cash runway, free cash flow and external funding requirements tell you when to raise and how much.
Highlights:
- Net income adjusted for non-cash items and working capital
- Investing cash flows by asset type
- Equity, debt, repayments, dividends and financing fees
- Monthly net burn, gross burn and cash runway in months
- Free cash flow and funding requirement analysis
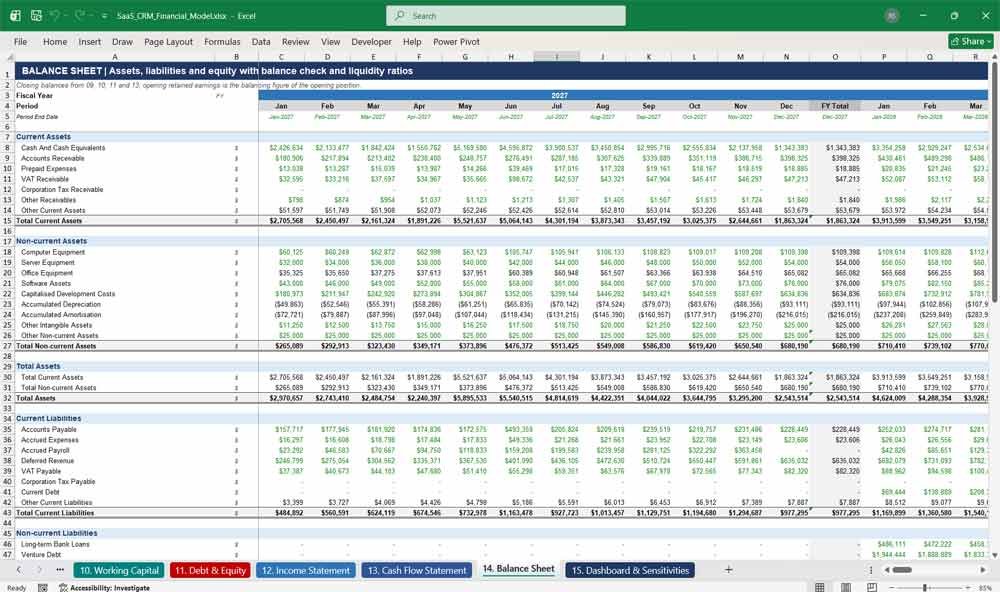
14. Balance Sheet
A fully integrated balance sheet that balances in every month. Assets, liabilities and shareholders’ equity are built from the supporting schedules, with a visible balance check and liquidity ratios. This gives investors, lenders and auditors confidence in the integrity of your three-statement SaaS financial model.
Highlights:
- Cash, receivables, prepaid expenses and other current assets
- Fixed assets with accumulated depreciation and amortisation
- Current and long-term debt split by instrument
- Share capital, premium, retained earnings and SBC reserve
- Balance check, current ratio, quick ratio and net debt
Key Assumptions and Drivers for a SaaS CRM
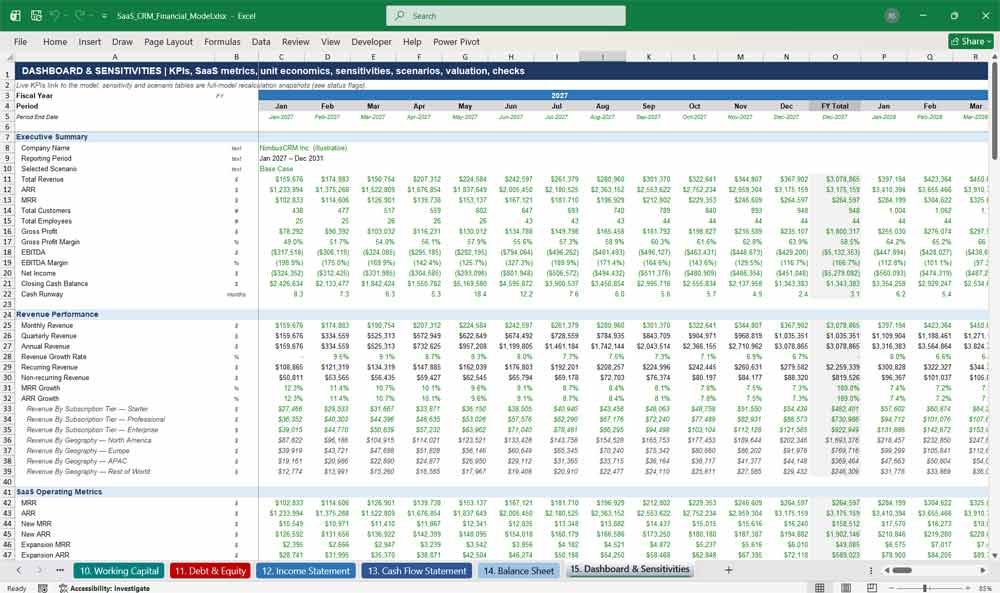
15. Dashboard & Sensitivities
The Dashboard summarises everything investors want to see: ARR, MRR, customers, retention, unit economics, profitability, cash runway and headcount. Sensitivity tables, a scenario comparison and valuation metrics, including a DCF and ARR multiple, help you stress-test your SaaS business plan with confidence.
Highlights:
- Executive summary with all key SaaS KPIs
- Revenue, customer and cost sensitivity tables (±10% and ±20%)
- Base, Upside and Downside comparison for revenue, EBITDA, cash and ARR
- Valuation: ARR multiple, enterprise value, DCF and exit value
- Model integrity checks with PASS / REVIEW flags for every period
Why Buy This Model?
Building a credible SaaS financial model from scratch can take weeks, and one broken link can undermine an entire investor pitch. This SaaS CRM Financial Model gives you a complete, fully integrated forecast that is ready to use. It is built the way experienced analysts build models: inputs in one place, clear colour coding, one consistent formula across every month, and checks that confirm the balance sheet, cash flow, ARR, MRR and customer numbers all reconcile. It covers every metric SaaS investors ask about, including CAC, LTV, NRR, GRR, burn, runway and magic number. You also get scenario analysis, sensitivity tables and a valuation summary. Enter your own pricing, funnel, team and funding plans, and within hours you will have a professional, defensible financial plan you can present to investors, lenders or your board.
SaaS CRM Startup Frequently Asked Questions (Faq)
Is this model suitable for my SaaS business if I don’t sell a CRM?
Yes. The model is set up for a CRM platform, but its structure (tiered subscriptions, funnel-driven customer acquisition, ARR/MRR build, churn and expansion) applies to most B2B SaaS businesses. You can rename the plans, change the pricing and adjust the cost lines to fit your product.
Can I change the start date and forecast period?
You can change the start date. Enter a new forecast start date on the Assumptions tab and every month, year label, cohort name, fiscal year end and dated event (such as funding rounds and debt repayments) updates automatically. The forecast covers 60 months (five years), with an annual total for each year.
Do I need advanced Excel skills to use it?
No. All inputs are in blue text on yellow cells, so you always know what to edit, and calculations are in black. Most users only need to work on the Assumptions tab and the Cover & Controls tab. The rest of the model updates automatically.
Does it include all three financial statements?
Yes. It includes a fully linked Income Statement, Cash Flow Statement and Balance Sheet, all monthly with annual roll-ups. The balance sheet balances in every period, and a built-in check confirms it.
Which SaaS metrics does the model calculate?
It calculates ARR, MRR, new/expansion/contraction/churned revenue, customer churn, revenue churn, Gross Revenue Retention, Net Revenue Retention, ARPA, CAC, LTV, LTV:CAC, CAC payback, magic number, sales efficiency, burn rate, cash runway, revenue per employee and more.
Can I model different scenarios?
Yes. Choose Base, Upside or Downside from a dropdown on the Cover tab. Each scenario adjusts six levers: revenue expansion, customer growth, churn, pricing, hiring and costs. You can edit the multipliers for each scenario too.
Can I model my fundraising rounds and debt?
Yes. You can enter founder investment, seed, Series A, B and C rounds with amounts, timing and pre-money valuations. The model calculates share issuance and dilution. You can also add term debt, venture debt, convertible notes and an optional revolving facility that keeps cash above a minimum balance.
How does the model handle annual versus monthly billing?
You set the share of customers billed annually upfront. The model then calculates deferred revenue, receivables and cash collections, so you can see how annual prepayments improve cash flow while revenue is still recognised monthly.
Can I plan hiring by role?
Yes. The headcount roster lists 48 roles across six departments. For each role you enter current headcount, a year-end target for each of the five years and an annual salary. The model ramps hiring monthly and calculates fully loaded payroll, including taxes, benefits, bonuses and recruitment fees.
Does the model include a valuation?
Yes. The Dashboard includes an ARR multiple valuation, enterprise value, equity value, implied revenue and EBITDA multiples, a discounted cash flow valuation and an exit valuation.
What happens if I make a mistake in the inputs?
The Cover tab shows live integrity checks for the balance sheet, cash flow, ARR, MRR, customers, revenue, cash balance and formula errors. If anything goes wrong, the Overall Model Status changes from PASS to REVIEW, so you can spot it immediately.
Are the sensitivity tables live?
The sensitivity and scenario comparison tables are pre-calculated snapshots of full-model recalculations, so you can compare outcomes at a glance without macros. A status flag tells you when inputs have changed and the tables need refreshing. All other dashboard figures update live.
Does the model contain macros?
No. The model uses standard Excel formulas only, with no macros or VBA, so it opens safely without security warnings.
Which version of Excel do I need?
Microsoft Excel 2010 or later on Windows or Mac is recommended. The model uses widely supported functions, but it was designed and tested for Excel. Some formatting and column grouping may look different in Google Sheets or other spreadsheet apps.
Can I use this model to raise investment or get a bank loan?
Yes. The model is structured and formatted to the standard investors and lenders expect: clear assumptions, integrated statements, SaaS KPIs, cash runway and funding requirements. You should always review the assumptions so they reflect your own business and evidence.
Is the data in the model real?
No. The model comes with illustrative example assumptions for a fictional CRM company, so you can see how everything works. Replace them with your own figures to create your forecast.
Final Notes on the Financial Model
- Scenario Analysis: Create best-case, base-case, and worst-case projections.
- Break-even Analysis: Determine sales volume required to cover fixed & variable costs.
- Sensitivity Analysis: Assess how changes in raw material costs, pricing, or demand impact profitability.
This structured model helps a SaaS CRM business address a broad market spectrum, offering the right balance between cost, production capacity, support, and customization at each subscription and project based level.
Download Link On Next Page