
Real-World Asset (RWA) Tokenization Financial Model
Build a professional financial forecast for an RWA tokenization infrastructure business with this fully linked, driver-based 10-year financial model in Excel. Purpose-built for businesses focused on real-world asset tokenization and Treasury Bill tokenization, the model connects market sizing, customer growth, tokenized AUM, transaction volumes, monetization, operating costs, funding, and three-statement financials into one integrated model.
Build your RWA forecast & Stress-Test Your Real-World Asset Tokenization
Whether you are a founder preparing to raise capital, a CFO developing an operating plan, or an investor evaluating the RWA tokenization market, this Excel financial model provides an editable foundation for building detailed financial projections without starting from a blank spreadsheet. The model contains 20 interconnected tabs and 49 forecast periods, with every major operating and financial driver linked throughout the workbook.
Model the complete economics of an RWA infrastructure platform, from TAM and market share through customers, tokenized AUM, active AUM, transaction volume and revenue. Nine individual monetization streams are modeled, including tokenization and issuance fees, secondary-market transaction fees, AUM and servicing fees, SaaS, custody, compliance/KYC, data/API fees and other infrastructure revenue.
RWA Model Tab-by-Tab Breakdown
1. Cover & Control
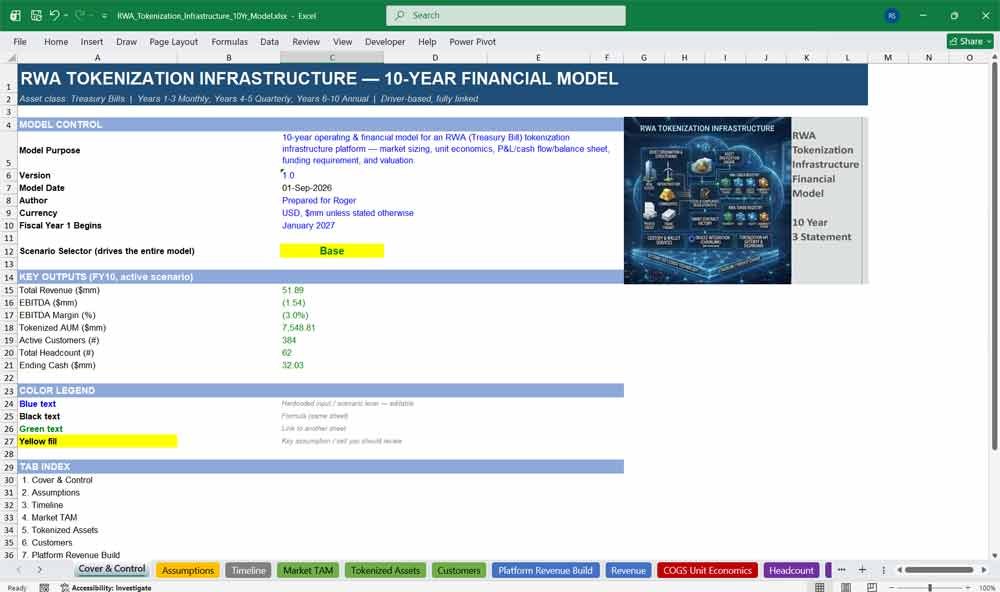
Every serious financial model template starts with a clear control tab, and this one is built for fast orientation. The Cover & Control tab is the front door to the entire RWA tokenization financial model — it states the model’s purpose, version, and last-updated date, houses the master Base/Upside/Downside scenario selector that drives every other tab, and surfaces the headline Year 10 outputs (revenue, EBITDA, tokenized AUM, headcount, and cash) so a reviewer can see where the business lands before ever opening a formula. A built-in color-coded legend and full tab index make the model approachable for first-time users, analysts, and investors alike.
- One-click scenario selector (Base / Upside / Downside) controlling the full model
- Live-linked Year 10 snapshot: revenue, EBITDA, tokenized AUM, headcount, cash
- Model version, purpose statement, and fiscal year start date
- Color legend (inputs vs. formulas vs. cross-sheet links) and a 20-tab navigation index
2. Assumptions
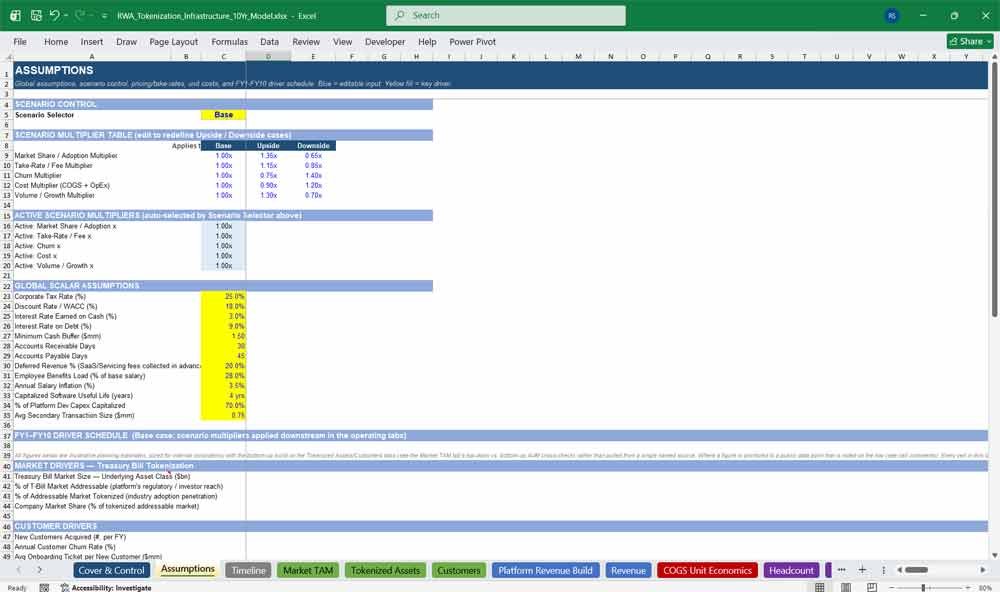
The Assumptions tab is the single source of truth behind every projection in this driver-based financial model. It centralizes over 40 global and FY-by-FY assumptions — market growth, take rates, unit costs, headcount costs, funding parameters — into one editable, color-coded input sheet, so nothing is hardcoded deep inside a formula where it can’t be found or trusted. This is where the scenario multiplier engine lives too: five multiplier categories (market share, take rate, churn, cost, growth) are applied automatically the moment you flip the scenario switch, making the entire tokenization revenue model instantly re-forecastable under different market conditions.
- 40+ FY1–FY10 driver rows covering market, customer, asset, monetization, infrastructure, cost, and capex assumptions
- Built-in Base / Upside / Downside scenario multiplier table (editable)
- Global scalar inputs: tax rate, WACC, AR/AP days, benefits load, salary inflation, capitalized software life
- Every input cell color-coded blue and flagged yellow where it materially matters
- Fully sourced/commented assumptions for transparency and auditability
RWA Tokenization Revenue Economics
3. Timeline
Getting forecast granularity right is one of the hardest parts of building a 10-year startup financial model, and the Timeline tab solves it once so every other tab doesn’t have to. It defines all 49 detail periods — monthly for Years 1–3, quarterly for Years 4–5, annual for Years 6–10 — plus a clean 10-column fiscal-year roll-up block used across the entire workbook. This single, reusable period structure is what lets the model shift seamlessly from early-stage monthly cash-runway precision to boardroom-ready annual reporting without duplicating logic anywhere else.
- 49 detail periods: 36 months (Y1–Y3), 8 quarters (Y4–Y5), 5 annual periods (Y6–Y10)
- Fiscal-year reference block (FY1–FY10) used by every other tab for annual roll-ups
- Explicit start/end dates and period-length flags that automatically scale annual assumptions to any granularity
- One shared column layout across all 20 tabs — no re-mapping between sheets
4. Market TAM
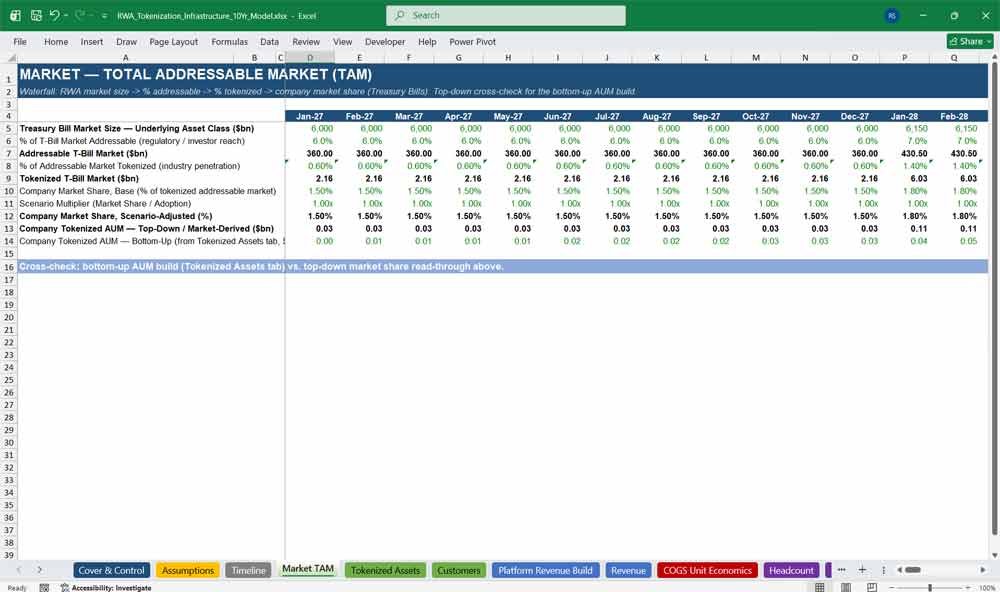
Investors evaluating any RWA tokenization business want to see the top-down market logic before they trust the bottom-up numbers, and the Market TAM tab delivers exactly that. It builds the full total addressable market waterfall for Treasury Bill tokenization — from the underlying multi-trillion-dollar T-Bill market, down through the addressable regulatory/investor-eligible segment, industry tokenization penetration, and finally the company’s own market share — and then cross-checks that top-down read-through against the model’s bottom-up AUM build for consistency. It’s the section of the model most likely to be scrutinized in diligence, and it’s built to hold up.
- Full TAM waterfall: T-Bill market size → % addressable → % tokenized → company market share
- Realistic, industry-informed penetration curve for tokenized Treasury adoption
- Automatic cross-check between top-down market-share AUM and bottom-up AUM build
- Every driver scenario-adjustable via the Base/Upside/Downside multiplier
5. Tokenized Assets
At the operational core of any tokenized Treasury Bill platform is the distinction between assets under management and transaction activity — and this tab keeps them structurally separate the way sophisticated RWA infrastructure models should. It builds the full AUM waterfall (assets onboarded from new and existing customers, redemptions, ending tokenized AUM, active AUM) and then layers a secondary-market transaction volume engine on top, complete with turnover ratios and implied transaction counts that feed directly into the cost and revenue engines elsewhere in the model.
- Full AUM roll-forward: beginning balance, onboarding, top-ups, redemptions, ending balance
- Tokenized AUM vs. Active AUM tracked as distinct, independently driven metrics
- Secondary-market transaction volume engine with configurable turnover ratio
- Implied transaction counts that flow directly into COGS and revenue
6. Customers
Customer economics drive everything downstream in a B2B tokenization infrastructure model, and this tab isolates them cleanly. It tracks new customer acquisition, churn, and the resulting active customer base period by period, giving you a clean, auditable trail from sales pipeline assumptions to the AUM and revenue numbers that depend on them. Because customer count and AUM per customer are modeled independently, you can stress-test acquisition velocity separately from wallet-size assumptions — a level of flexibility most simplified fintech financial models don’t offer.
- Full customer roll-forward: beginning base, new adds, churn, ending active customers
- Scenario-adjustable churn rate feeding directly into LTV calculations
- Cumulative lifetime customers acquired tracked for CAC/LTV analysis
- Clean separation between customer count growth and AUM-per-customer growth
7. Platform Revenue Build
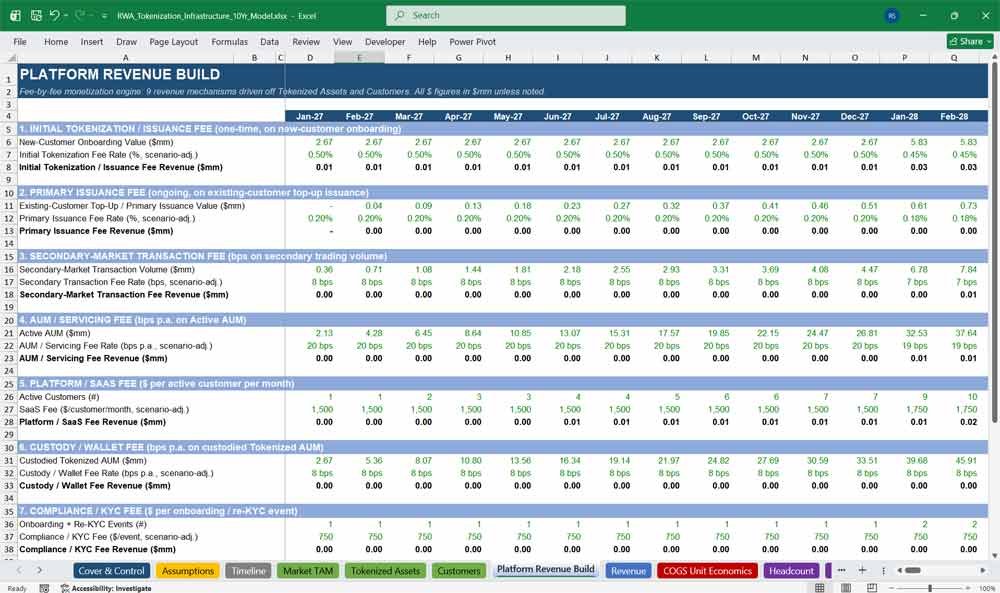
This is the monetization engine at the heart of the model, and it’s built to answer the question every RWA tokenization revenue model needs to answer: exactly how does this business make money? Nine distinct fee mechanisms — initial tokenization/issuance fees, primary issuance fees, secondary-market transaction fees, AUM/servicing fees, platform/SaaS fees, custody/wallet fees, compliance/KYC fees, data/API fees, and other infrastructure revenue — are each modeled against their own operational driver and their own take rate, then rolled up into total platform revenue. It’s the level of monetization detail that lets you test pricing changes on any single fee line without disturbing the rest of the model.
- 9 independently modeled monetization mechanisms, each tied to its own operational driver
- Initial tokenization, primary issuance, and secondary transaction fees modeled separately
- AUM/servicing, custody, SaaS, KYC, and API fees each with their own configurable take rate
- Full transparency into which revenue streams scale with AUM vs. transaction volume vs. customer count
8. Revenue
The Revenue tab consolidates all nine monetization streams from the Platform Revenue Build into one clean, presentation-ready summary — exactly what a board deck or investor data room needs. Alongside total revenue by period, it calculates each stream’s percentage of the mix and year-over-year growth, making it easy to see how the revenue mix shifts over a 10-year forecast as a tokenization platform matures from transaction-fee-heavy early revenue toward more durable, recurring AUM and SaaS-based income.
- Revenue by stream, consolidated across all 49 detail periods and 10 fiscal years
- Automatic % of total revenue by stream, for mix analysis
- Year-over-year growth tracking at the fiscal-year level
- Clean, presentation-ready format for investor decks and board reporting
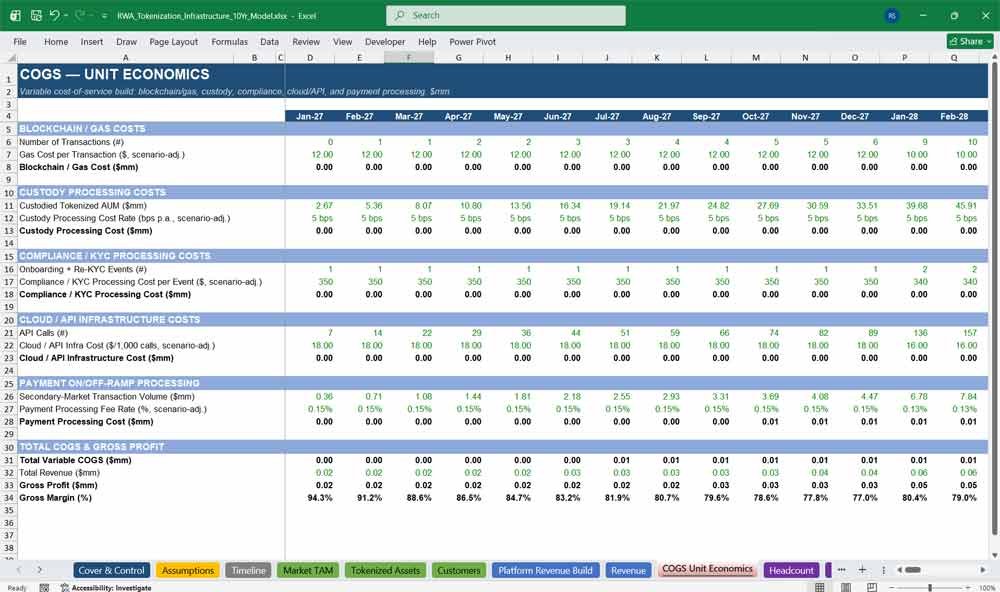
9. COGS Unit Economics
Understanding true unit economics is what separates a credible blockchain infrastructure financial model from a top-line growth story, and this tab builds cost-of-service from the ground up. Blockchain/gas costs, custody processing, compliance/KYC processing, cloud/API infrastructure, and payment on/off-ramp costs are each modeled against their own operational volume driver — transaction count, AUM, KYC events, API calls — so gross margin isn’t a guessed percentage but a genuine output of the business’s cost structure at scale.
- Five distinct variable cost lines, each tied to its own unit driver
- Blockchain/gas cost modeled per transaction, custody cost modeled per dollar of AUM
- Compliance/KYC and cloud/API costs scaled to actual event and call volumes
- Automatic gross profit and gross margin calculation feeding directly into the P&L
Real-World Asset (RWA) Financial Statements
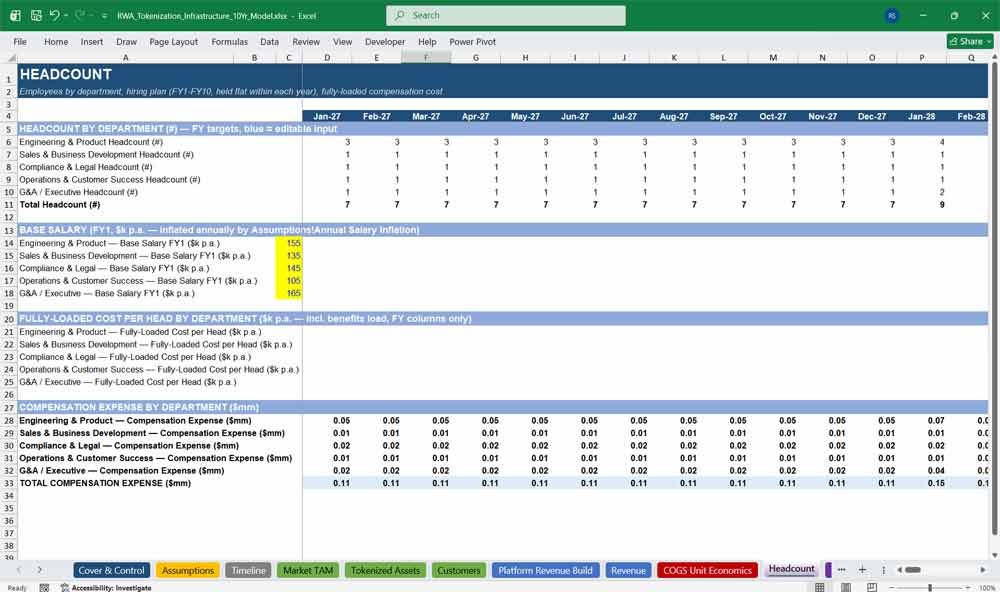
10. Headcount
People costs are usually the largest expense line in any infrastructure startup financial model, and this tab models them with real operating discipline. Headcount is broken out across five departments — Engineering & Product, Sales & Business Development, Compliance & Legal, Operations & Customer Success, and G&A/Executive — each with its own hiring plan, base salary, and fully-loaded cost per head that compounds with configurable salary inflation and benefits load, giving you a realistic, department-level view of how the org scales alongside revenue.
- Department-level hiring plan across all 10 fiscal years
- Fully-loaded cost per head, inflated annually and grossed up for benefits
- Total compensation expense calculated bottom-up from actual headcount, not a flat assumption
- Editable base salaries and headcount targets per department
11. Operating Expenses
The Operating Expenses tab pulls the full non-COGS cost base of the business into one place, combining the compensation build from the Headcount tab with Sales & Marketing, G&A, R&D/Technology, and Legal & Regulatory Compliance costs. Sales & Marketing scales as a percentage of revenue while the other lines follow their own inflation-adjusted growth paths, giving this operating expense model the flexibility to reflect how cost discipline typically tightens as an infrastructure platform scales toward profitability.
- Compensation, Sales & Marketing, G&A, R&D, and Legal/Compliance modeled as distinct lines
- Sales & Marketing spend scales dynamically with revenue
- Non-compensation costs inflate annually via a configurable assumption
- Feeds directly into EBITDA on the P&L tab
12. Capex & Technology
Platform development and infrastructure investment get their own dedicated tab, reflecting how capital-intensive building tokenization infrastructure actually is. Capex is split between capitalized and immediately expensed technology spend based on a configurable capitalization policy, with a full gross balance, accumulated depreciation, and net book value roll-forward that straight-line amortizes capitalized software over its useful life — giving the P&L and balance sheet a realistic, auditable depreciation and amortization schedule.
- Platform development and infrastructure capex modeled separately
- Configurable capitalization policy (% capitalized vs. immediately expensed)
- Full gross balance / accumulated D&A / net book value roll-forward
- Straight-line amortization over a configurable useful life
13. Working Capital
Working capital swings are an easy place for a financial model to quietly go wrong, and this tab handles them properly by sizing accounts receivable, accounts payable, and deferred revenue off annualized run-rate revenue and cost, rather than static balances. That means the model correctly reflects how AR, AP, and deferred SaaS/servicing revenue behave whether a given period is a single month, a quarter, or a full fiscal year — critical for a model that changes granularity partway through its forecast horizon.
- AR and AP sized dynamically off annualized run-rate revenue and COGS
- Deferred revenue modeled on prepaid SaaS and AUM/servicing fee streams
- Net working capital and period-over-period change feed directly into the Cash Flow tab
- Correctly handles the transition between monthly, quarterly, and annual granularity
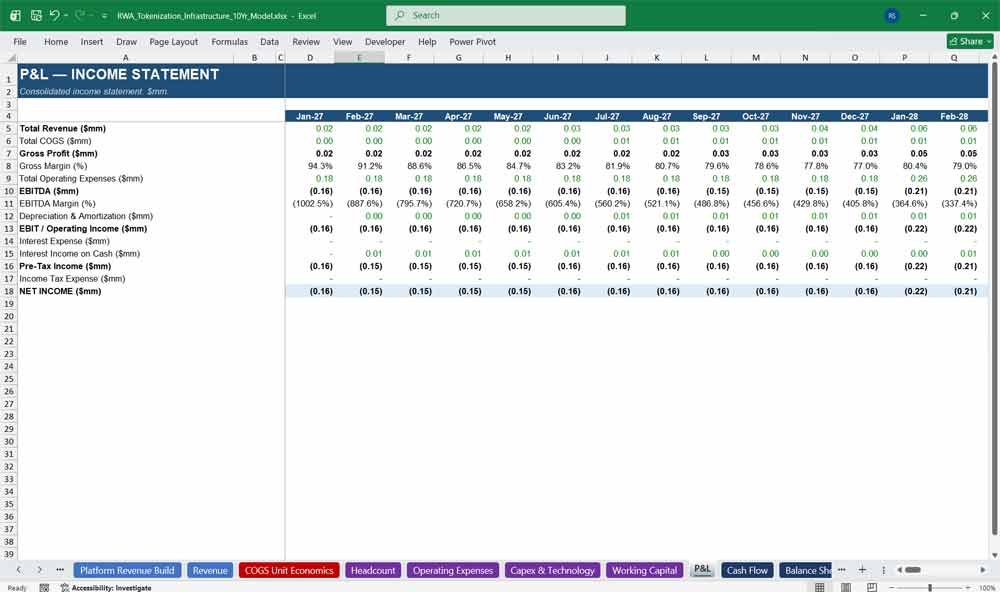
14. P&L
The P&L tab is the consolidated income statement every investor and lender will look at first, built entirely from links to the Revenue, COGS, Operating Expenses, and Capex & Technology tabs — nothing is re-entered or hardcoded. It walks cleanly from total revenue down through gross profit, EBITDA, D&A, EBIT, interest expense and income, taxes, and net income, giving you a fully auditable income statement that updates instantly whenever an assumption or scenario changes upstream.
- Full walk from revenue to net income: gross profit, EBITDA, EBIT, pre-tax income, tax, net income
- Gross margin and EBITDA margin calculated automatically at every period
- Interest expense and income linked to the Funding and Cash Flow tabs (non-circular)
- Every line is a live formula — change one assumption and the whole statement updates
15. Cash Flow
Cash is what actually keeps a tokenization infrastructure startup alive, and this tab makes runway visible at a glance. It builds a full three-part cash flow statement — operating, investing, and financing activities — with a clean cash roll-forward and a built-in funding-gap indicator that flags exactly when the business dips below its minimum cash buffer, so a founder or CFO can see precisely when the next raise needs to close.
- Full operating / investing / financing cash flow build, linked to every upstream tab
- Cash roll-forward (beginning balance, net change, ending balance) at every period
- Built-in minimum cash buffer check that flags funding shortfalls automatically
- Correctly excludes non-cash D&A and expensed capex double-counting
16. Balance Sheet
A balance sheet that doesn’t balance undermines trust in an entire financial model — this one ties to zero in every single one of its 49 detail periods and 10 fiscal years, every time. Cash, receivables, and net capitalized technology sit on the asset side; payables, deferred revenue, and debt sit on the liability side; and paid-in capital plus cumulative retained earnings complete equity — all fully linked to the Cash Flow, Working Capital, Capex, and Funding tabs, with a built-in balance check row for instant verification.
- Full balance sheet: assets, liabilities, and equity, fully linked to every other tab
- Built-in balance check row (Assets − Liabilities − Equity) for instant audit
- Cumulative retained earnings/accumulated deficit tracked period over period
- Net capitalized software and debt balances flow directly from Capex and Funding tabs
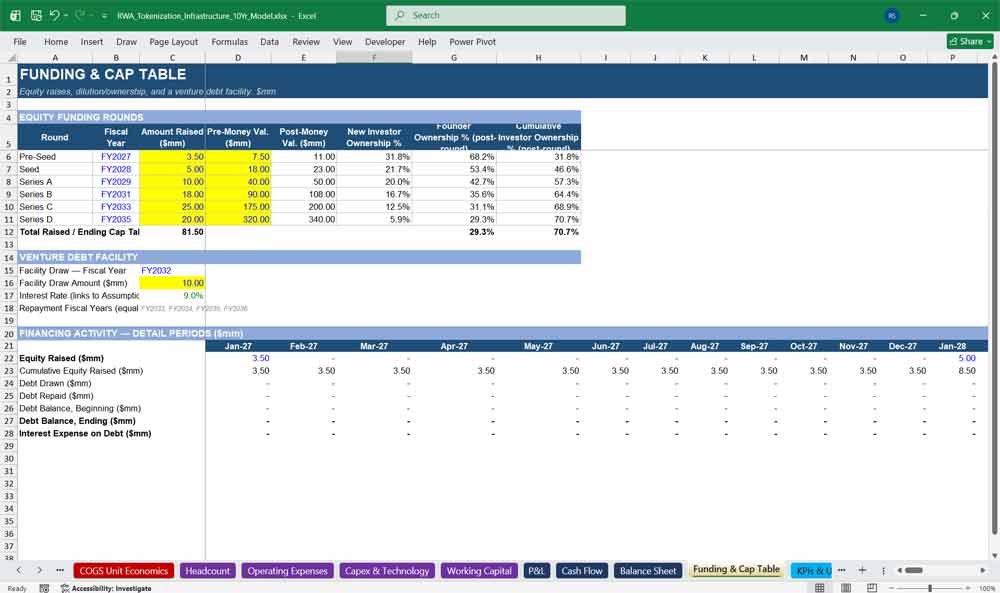
17. Funding & Cap Table
Fundraising strategy gets its own dedicated home in this startup cap table model, with a full multi-round equity schedule — Pre-Seed through Series D — tracking amount raised, pre- and post-money valuation, and resulting founder/investor dilution round by round. A venture debt facility with a defined draw and repayment schedule rounds out the financing side, giving investors a complete, realistic view of how the company plans to fund its way to profitability.
- Six-round equity funding schedule with automatic dilution and ownership tracking
- Pre-money, post-money, and new-investor-ownership calculated per round
- Venture debt facility with configurable draw amount, timing, and repayment schedule
- Cumulative equity raised and debt balance feed directly into the Balance Sheet
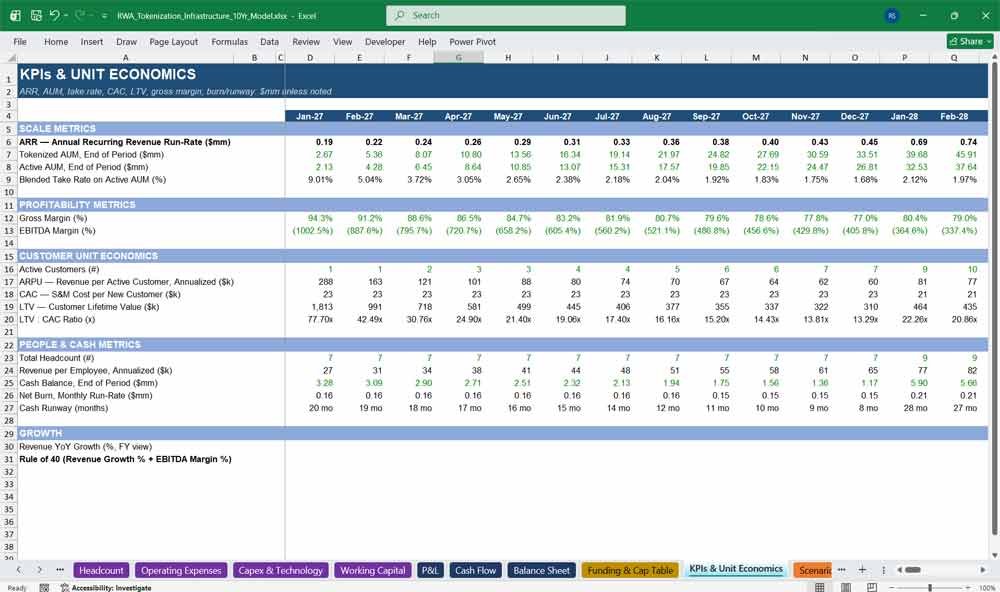
18. KPIs & Unit Economics
Every SaaS and fintech investor wants to see the same handful of unit economics, and this tab puts them all in one place: ARR, tokenized and active AUM, blended take rate, gross and EBITDA margin, CAC, LTV, LTV:CAC ratio, revenue per employee, cash runway, and the Rule of 40. Because every metric is calculated from the underlying operating tabs rather than entered separately, this unit economics dashboard always stays consistent with the rest of the model — no matter which scenario is active.
- ARR, blended take rate, gross margin, and EBITDA margin tracked at every period
- CAC, LTV, and LTV:CAC ratio calculated bottom-up from actual S&M spend and churn
- Cash runway and monthly burn rate calculated dynamically from EBITDA and cash balance
- Rule of 40 and revenue-per-employee for fast benchmarking against SaaS/fintech peers
19. Scenario & Sensitivity
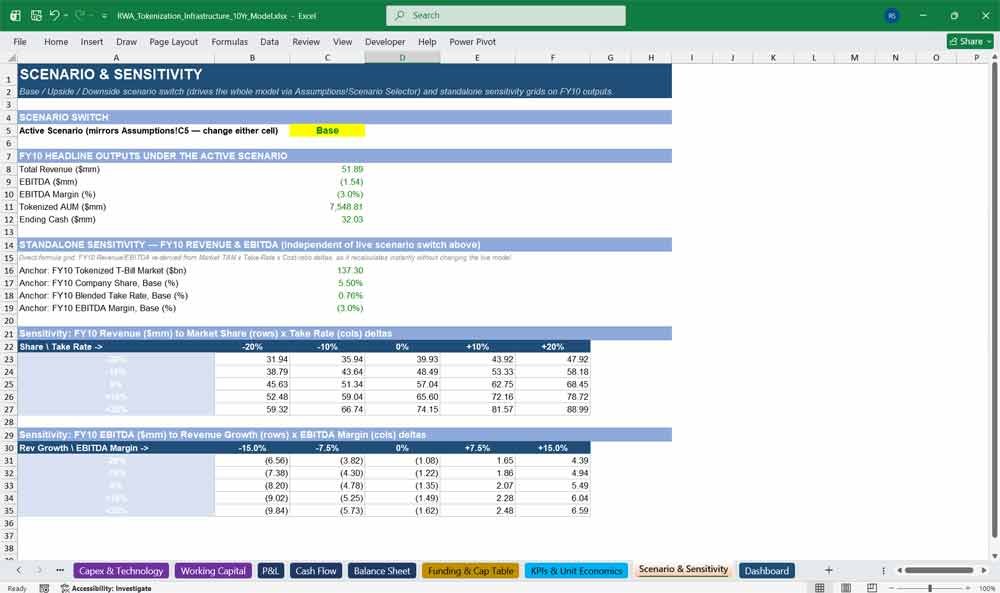
Stress-testing the model is built in, not bolted on. The Scenario & Sensitivity tab houses the master Base/Upside/Downside switch that instantly re-prices market share, take rates, churn, costs, and growth across the entire workbook, plus standalone sensitivity grids showing how Year 10 revenue and EBITDA respond to independent shifts in market share, take rate, revenue growth, and margin — giving investors and operators a fast, visual way to understand the model’s key swing factors.
- Single scenario switch (Base/Upside/Downside) that re-prices the entire model instantly
- Live FY10 headline outputs (revenue, EBITDA, AUM, cash) under the active scenario
- Two independent sensitivity grids: revenue to market share × take rate, EBITDA to growth × margin
- Fully editable scenario multiplier definitions for custom stress-testing
20. Dashboard
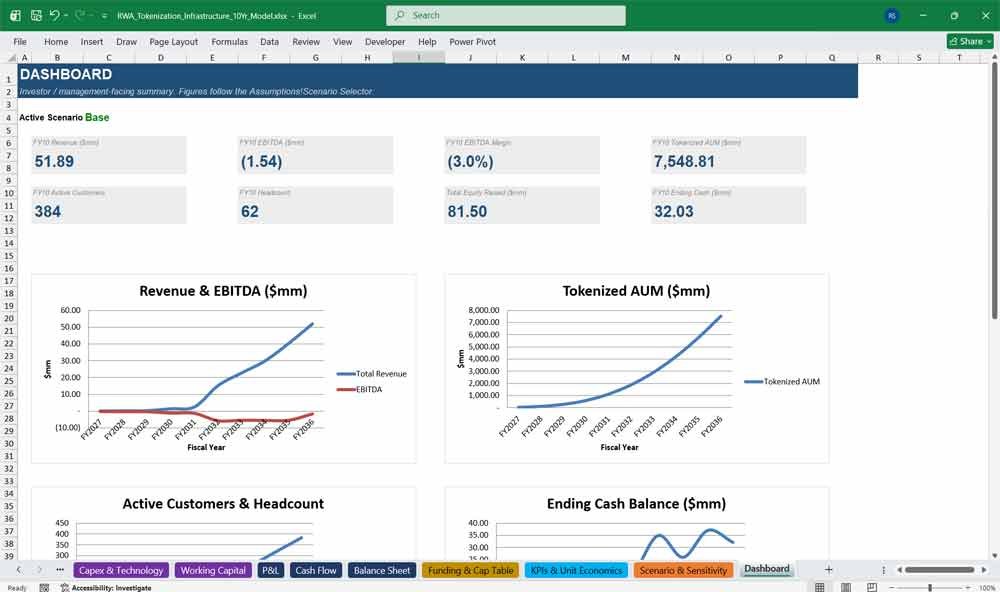
The Dashboard tab is the investor- and board-facing summary view of the entire model — KPI cards for Year 10 revenue, EBITDA, EBITDA margin, tokenized AUM, active customers, headcount, total equity raised, and ending cash, backed by charts tracking revenue and EBITDA, AUM growth, customer and headcount growth, cash balance, and the Year 10 revenue mix by stream. It’s built to be the one tab you screen-share in a fundraising meeting or send to your board without opening anything else.
- At-a-glance KPI cards for the eight most important Year 10 outputs
- Charts for revenue/EBITDA trend, AUM growth, customer/headcount growth, and cash balance
- Revenue mix visualization by monetization stream
- Automatically follows the active Base/Upside/Downside scenario
Why Buy This RWA Tokenization Financial Model?
Building a detailed RWA tokenization financial model from scratch can require weeks of work across market sizing, customer assumptions, AUM forecasting, revenue modeling, unit economics, headcount, funding and three-statement financials. This Excel template gives you a structured, fully linked starting point designed specifically for RWA and Treasury Bill tokenization infrastructure businesses. Instead of building formulas from scratch, you can focus on your own assumptions, strategy and investment case. With editable inputs, detailed operating drivers, nine revenue streams, 20 interconnected tabs, Base/Upside/Downside scenarios and a 10-year forecast, the model is designed to help founders, CFOs, analysts and investors build a more credible and transparent financial plan quickly.
RWA Tokenization Frequently Asked Questions (Faq)
Is this model built for a real company, or is it a generic template I need to heavily rework?
It’s a fully built, purpose-specific RWA tokenization financial model for a Treasury Bill tokenization infrastructure business — not a generic multi-industry template with placeholder logic bolted on. Every tab already reflects the actual mechanics of this business model: tokenized AUM waterfalls, nine tokenization-specific monetization streams, blockchain/custody/compliance unit costs, and a funding structure suited to an early-stage infrastructure startup. You’re not starting from a blank shell; you’re starting from a working, internally consistent model and swapping in your own numbers.
Do I need advanced Excel or financial modeling experience to use it?
No. Every hardcoded input is color-coded blue and, where it matters most, highlighted yellow, so you always know exactly which cells to edit and which to leave alone. Formulas, cross-sheet links, and totals are styled separately in black and green so the model is self-documenting even if you’ve never opened a driver-based model before. If you can type a number into a cell, you can operate this model — you don’t need to touch a single formula unless you want to.
Can I change the assumptions to match my own company’s numbers?
Yes — that’s the entire point of a driver-based build. Every market, customer, take-rate, cost, headcount, and funding assumption lives in the Assumptions tab (or its own dedicated tab, for things like headcount and funding rounds) as an editable input cell. Change a growth rate, a fee percentage, a hiring plan, or a fundraise size and every downstream tab — revenue, COGS, the three statements, the KPIs, the dashboard — recalculates automatically. Nothing is hardcoded into the middle of a formula where you’d have to go hunting for it.
What if my business isn’t focused on Treasury Bills, or covers a different RWA asset class?
The model ships calibrated to Treasury Bill tokenization, but the underlying architecture — market TAM waterfall, AUM build, nine-stream monetization engine, unit-economics-driven COGS — is asset-class-agnostic. Relabeling and re-driving it for another RWA category (private credit, money market funds, real estate, commodities) is primarily a matter of updating the Market TAM and Assumptions tabs; the revenue, cost, and financial-statement logic underneath doesn’t need to be rebuilt.
Does the balance sheet actually balance, or is this a rough approximation?
It balances exactly — Assets minus Liabilities minus Equity equals zero in every one of the 49 forecast periods and all 10 fiscal years, with a built-in balance-check row so you can verify it yourself the moment you open the file. The model was stress-tested under Base, Upside, and Downside scenarios during development specifically to confirm it stays fully tied out no matter which assumptions are active.
Is this useful for actually raising money, or is it just an internal planning tool?
Both. The Cover & Control and Dashboard tabs are built to be investor- and board-facing on their own — headline KPIs, charts, and a live scenario switch, ready to screen-share in a fundraising meeting. The Funding & Cap Table tab already models a full seed-through-Series-D raise with dilution tracking, so you can either use it as a starting point for your own round structure or replace it entirely with your actual term sheet numbers once you have them.
How does the monthly/quarterly/annual period structure work — won’t that make the model harder to follow?
It’s the opposite: it’s what makes the model realistic without being unmanageable. Years 1–3 run monthly (where early-stage cash runway actually needs to be tracked precisely), Years 4–5 step down to quarterly, and Years 6–10 roll up to annual — all on one shared column layout used consistently across every tab, plus a clean 10-column fiscal-year summary block for reporting. You never have to re-map or reconcile between differently structured sheets.
Can I model best-case and worst-case outcomes, or only one fixed forecast?
Yes — a single Base/Upside/Downside scenario switch on the Cover, Assumptions, and Scenario & Sensitivity tabs instantly re-prices market share, take rates, churn, costs, and growth across the entire model. There’s also a standalone sensitivity grid showing how Year 10 revenue and EBITDA move independently against market share, take rate, growth, and margin assumptions, so you can see your key swing factors without having to flip the whole model back and forth.
What software do I need to open and edit this model?
It’s a standard .xlsx file, so it opens natively in Microsoft Excel (desktop or Microsoft 365) and imports cleanly into Google Sheets. All formulas use widely supported functions, so nothing breaks or shows as an error when you move between Excel and Sheets.
Further Reading
Tokenomics & Web3 Token Launch Template: Fully linked 10-year, 120-month tokenomics model, helping founders, token designers, Web3 finance teams, and DAO operators model token supply.
- Stablecoin Infrastructure Model: Download this professional B2B cross-border stablecoin payments financial model in Excel designed specifically for companies using stablecoins as a settlement and payment rail.