
Stablecoin Payments Infrastructure Financial Model
Download this professional B2B cross-border stablecoin payments financial model in Excel designed specifically for companies using stablecoins as a settlement and payment rail. This 7-year financial model helps founders, CFOs, investors, and finance teams forecast transaction volume, TPV, stablecoin flows, revenue, COGS, operating expenses, cash flow, funding requirements, and profitability from first principles.
7-Year financial model for Stablecoin Payments Infrastructure
Unlike a generic startup, SaaS, or payments financial model template, this stablecoin payments infrastructure model is built around the economics of a modern cross-border payments platform. Customer growth drives transaction volumes, transactions generate total payment volume (TPV), and TPV flows through stablecoin settlement, on/off-ramp activity, FX conversion, and local payouts before revenue and costs are calculated.
With 18 fully linked Excel tabs, monthly detail for the first three years, and annual forecasts through Year 7, this model is designed for fundraising, financial planning, board reporting, investor due diligence, valuation, and benchmarking. Every key assumption is formula-driven and clearly identified, allowing you to change operating assumptions without breaking downstream calculations.
Tab-by-Tab Breakdown
1. Cover Index
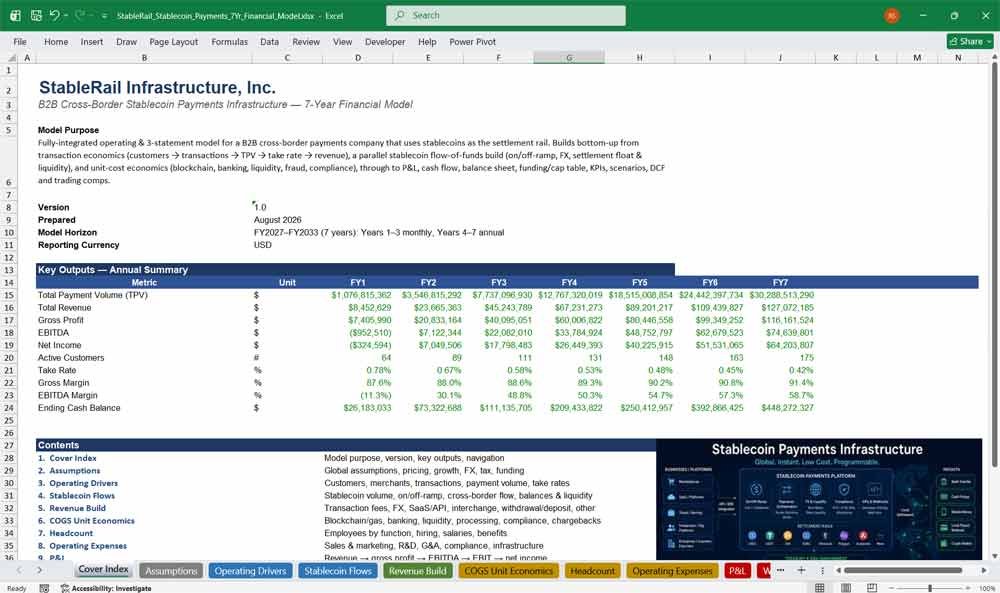
The Cover Index tab is the navigation hub of the stablecoin payments financial model, giving investors, operators, and finance teams an at-a-glance summary of model purpose, version control, and headline 7-year outputs before diving into the underlying detail. It’s the page most reviewers see first, so it’s built to answer the core questions — what does this business do, how big does it get, and where is the detail — in under thirty seconds, with one-click hyperlinked navigation to every other tab in the workbook.
- One-click hyperlinked index to all 18 tabs for fast navigation in due diligence or board review
- Summary table of TPV, revenue, gross profit, EBITDA, net income, active customers, take rate, and cash by fiscal year
- Model version, prepared date, and 7-year horizon (FY2027–FY2033) clearly stated for audit trail purposes
- Plain-language model purpose statement summarizing the stablecoin settlement, revenue, and cost architecture
2. Assumptions
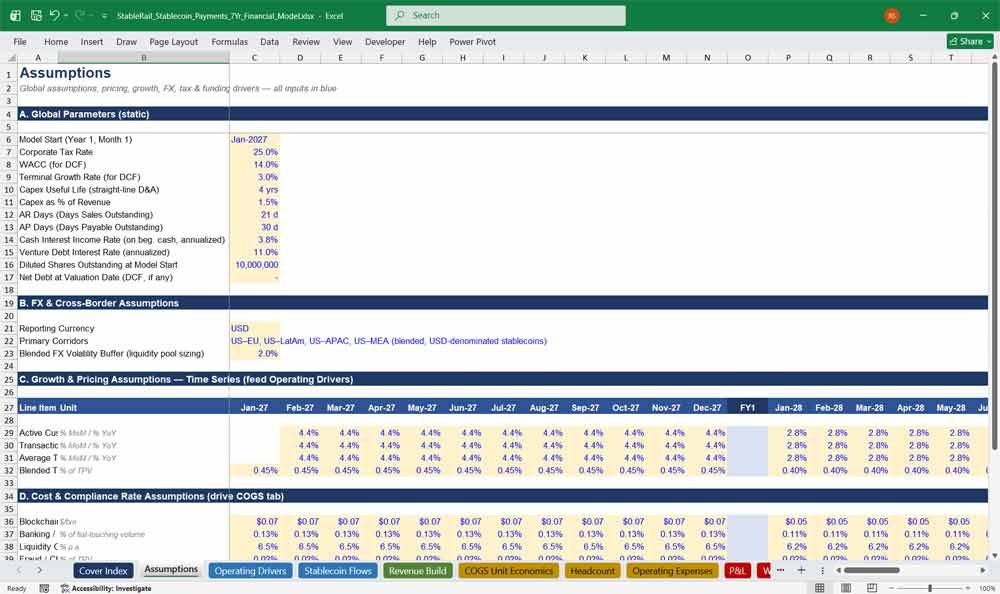
The Assumptions tab centralizes every global driver behind the financial model — pricing, growth, FX, tax, and funding — so that a single edit flows through the entire cross-border stablecoin payments model without hunting across eighteen tabs. This is the control panel for scenario testing take rate compression, growth deceleration, capital costs, and unit-cost improvement over a 7-year horizon, and it’s where anyone stress-testing the model’s blended take rate, tax rate, WACC, or terminal growth assumptions should start.
- Global parameters: tax rate, WACC, terminal growth rate, AR/AP days, interest rates, and starting share count
- Monthly and annual growth-rate assumptions for customers, transactions per customer, and average transaction size
- Blended transaction take-rate schedule showing pricing compression as the payments platform scales
- Blockchain/gas, banking, liquidity, fraud, and compliance cost assumptions that feed the COGS build directly
- Every input color-coded in blue for instant identification of editable assumption cells
Stablecoin Payments Financial Model for Cross-Border B2B Payments
3. Operating Drivers
The Operating Drivers tab is the transaction-economics engine of the model, translating a stablecoin payments company’s customer base into payment volume and revenue the way a real cross-border payments platform actually scales: customers become active customers, active customers generate transactions, transactions carry an average size, and average size times volume produces total payment volume (TPV) before take rate converts TPV into transaction revenue.
- Full driver chain: customers → active customers → transactions per customer → transaction count → average transaction size → TPV
- Blended transaction take-rate application showing core transaction revenue generation
- Net new customer tracking and month-over-month / year-over-year TPV growth rate memos
- Fully formula-linked so any change to Assumptions-tab growth rates recalculates volume and revenue instantly
4. Stablecoin Flows
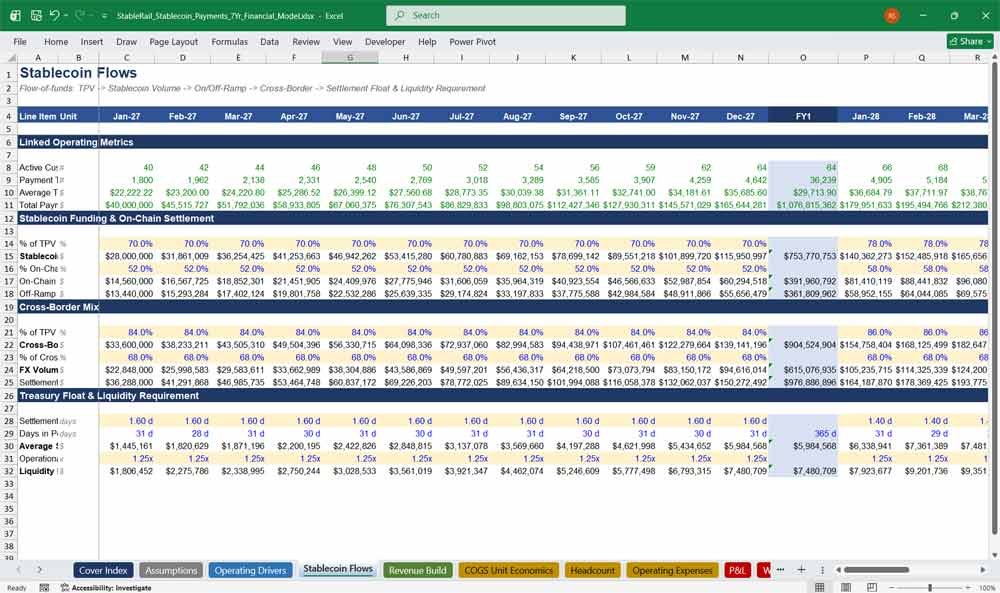
The Stablecoin Flows tab is the flow-of-funds backbone that separates this model from a generic payments financial model — it traces every dollar of TPV through stablecoin funding, on-chain settlement, off-ramp conversion, and cross-border FX exposure, then sizes the treasury float and liquidity requirement a real stablecoin payments infrastructure company must hold to settle customer volume safely and efficiently.
- TPV broken into stablecoin-funded volume, on-chain settlement volume, and off-ramp (stablecoin-to-fiat) volume
- Cross-border volume and FX-conversion volume isolated for corridor-level analysis
- Average stablecoin treasury balance and settlement-days assumptions driving working-capital and liquidity needs
- Liquidity requirement calculation (treasury + FX pool buffer) that feeds directly into the balance sheet and COGS
5. Revenue Build
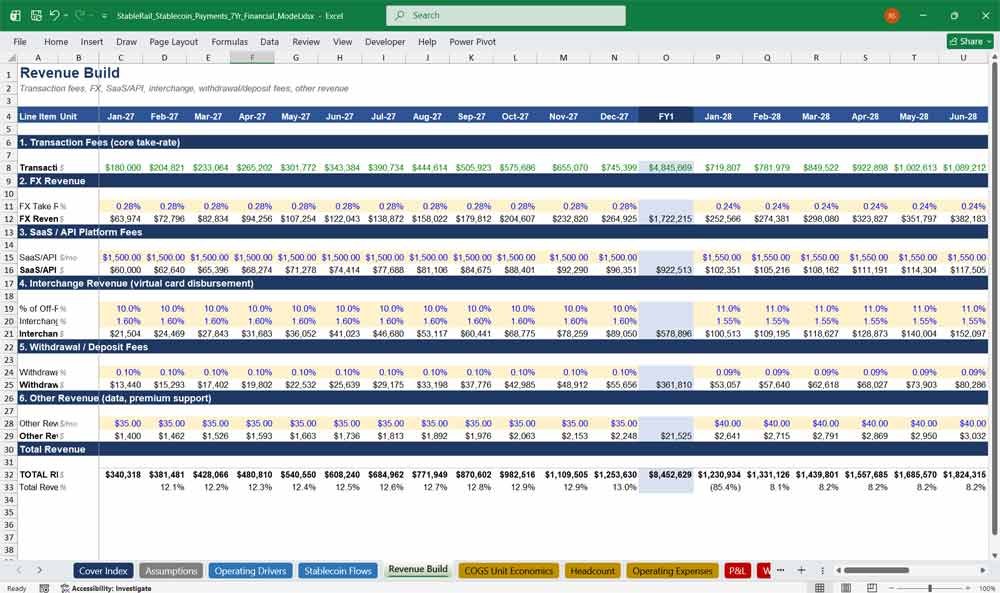
The Revenue Build tab assembles every monetization line a modern stablecoin payments platform can generate — transaction fees, FX spread, SaaS/API platform fees, interchange, and withdrawal/deposit fees — into a single, auditable total revenue build, giving finance teams and investors a clear view of revenue diversification beyond a single blended take rate.
- Six distinct revenue streams: transaction fees, FX revenue, SaaS/API fees, interchange, withdrawal/deposit fees, and other revenue
- FX take-rate schedule applied to FX-conversion volume from the Stablecoin Flows tab
- Per-customer SaaS/API platform fee modeling that captures recurring, volume-independent revenue
- Total revenue and revenue growth rate (MoM/YoY) summary rows for quick trend analysis
6. COGS Unit Economics
The COGS Unit Economics tab breaks down the true cost of moving money on a stablecoin rail — blockchain and gas costs, banking and payment-processing fees, liquidity costs, fraud and chargebacks, and compliance/KYC — giving operators a defensible, unit-cost view of gross margin that mirrors how payments and fintech infrastructure companies actually report cost of revenue.
- Blockchain/gas cost modeled per on-chain transaction, capturing efficiency gains from cheaper settlement rails at scale
- Banking and payment-processing costs applied to fiat-touching (off-ramp) volume
- Liquidity cost of capital applied to the treasury float sized in the Stablecoin Flows tab
- Fraud/chargeback and compliance/KYC cost lines rolling up to total COGS, gross profit, and gross margin %
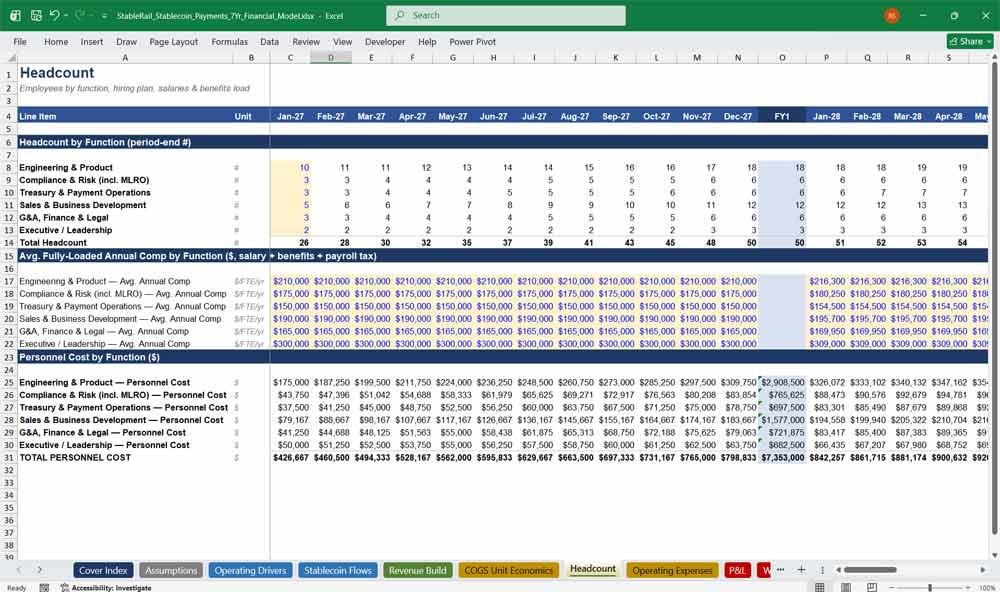
7. Headcount
The Headcount tab models the org-building plan behind the financial model, translating engineering, compliance, treasury operations, sales, G&A, and executive hiring into a fully loaded personnel cost schedule that ties directly into operating expenses and cash burn — essential for any stablecoin payments startup building a fundraising or budgeting financial model.
- Headcount by function: engineering & product, compliance & risk, treasury & payment operations, sales & BD, G&A, and executive
- Monthly hiring ramp for years 1–3 and annual hiring plans for years 4–7
- Fully loaded average annual compensation by function, escalating with market comp growth
- Automatic roll-up to total headcount and total personnel cost by month and fiscal year
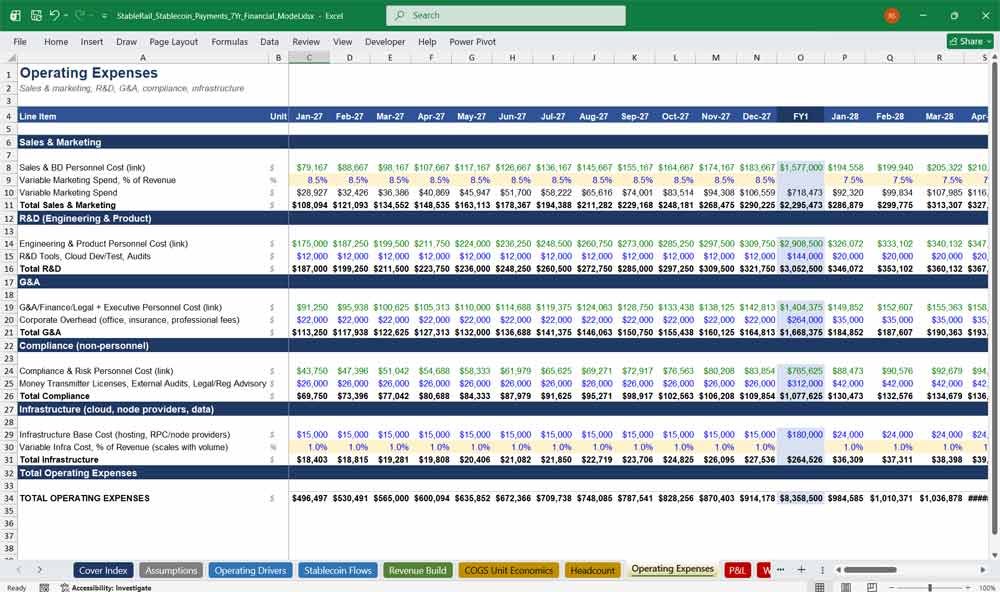
8. Operating Expenses
The Operating Expenses tab converts the hiring plan and non-personnel spending into the full opex structure of a scaling stablecoin payments business — sales & marketing, R&D, G&A, compliance, and infrastructure — showing how operating leverage improves as revenue outpaces fixed and semi-variable cost growth.
- Sales & marketing combining personnel cost with variable, revenue-linked marketing spend
- R&D spend tied to engineering/product headcount plus tooling and cloud dev/test costs
- Compliance costs covering money-transmitter licenses, external audits, and regulatory advisory
- Infrastructure costs blending fixed hosting/node-provider spend with volume-linked variable costs
Stablecoin Financial Statements
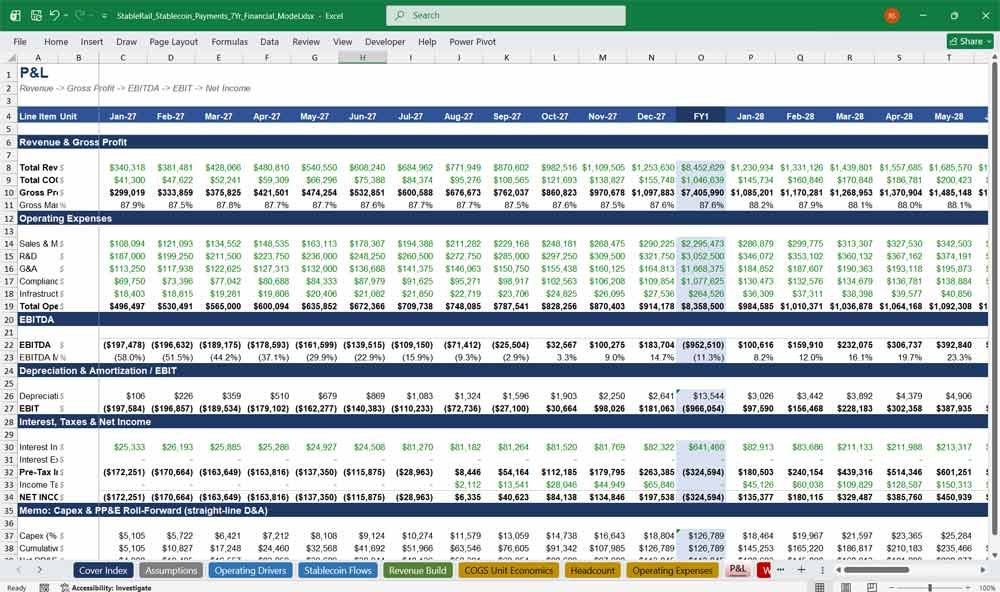
9. Profit & Loss (P&L)
The P&L tab is the income-statement core of the model, rolling revenue and COGS into gross profit, EBITDA, EBIT, and net income with a fully modeled depreciation, capex, interest income, and tax schedule — the standard view investors and lenders expect when evaluating a cross-border stablecoin payments company’s path to profitability.
- Full waterfall: revenue → gross profit → EBITDA → EBIT → pre-tax income → net income
- Capex and straight-line depreciation schedule with cumulative gross capex and net PP&E roll-forward
- Interest income on cash balances and interest expense on venture debt, both computed off beginning-of-period balances
- Gross margin, EBITDA margin, and profitability inflection point clearly visible by month and fiscal year
10. Working Capital
The Working Capital tab models the operational balances unique to a stablecoin payments business — receivables, payables, and the settlement float in transit between payors and payees — giving a precise view of the cash conversion cycle and change in net working capital that flows into the cash flow statement.
- Trade accounts receivable and accounts payable driven by DSO/DPO assumptions
- Settlement receivables and settlement payables modeling in-transit stablecoin payment flows
- Prepaid expenses and accrued liabilities scaled to operating expense levels
- Net working capital and period-over-period change in NWC feeding directly into free cash flow
11. Cash Flow
The Cash Flow tab consolidates operating, investing, and financing activity into a single cash bridge, tracking the stablecoin payments company’s cash runway from seed funding through Series D and into sustainable free cash flow generation — critical for any startup financial model used in fundraising or lender conversations.
- Cash flow from operations built from net income, D&A, and change in net working capital
- Cash flow from investing capturing capex tied to revenue growth
- Cash flow from financing tracking every equity raise, debt draw, and debt repayment
- Beginning and ending cash balances chained month-to-month and year-to-year with no circular references
12. Balance Sheet
The Balance Sheet tab completes the three-statement model with a fully reconciled, always-balancing balance sheet purpose-built for a stablecoin payments company — including custodial treasury holdings and matching customer funds payable, a structural feature most generic financial model templates omit entirely.
- Assets: cash, stablecoin treasury holdings, accounts receivable, settlement receivables, prepaid expenses, and net PP&E
- Liabilities: accounts payable, settlement payables, accrued liabilities, customer custodial funds payable, and venture debt
- Equity: cumulative paid-in capital and retained earnings, both fully formula-driven from the P&L and cap table
- Built-in balance check row confirming assets equal liabilities plus equity in every single period
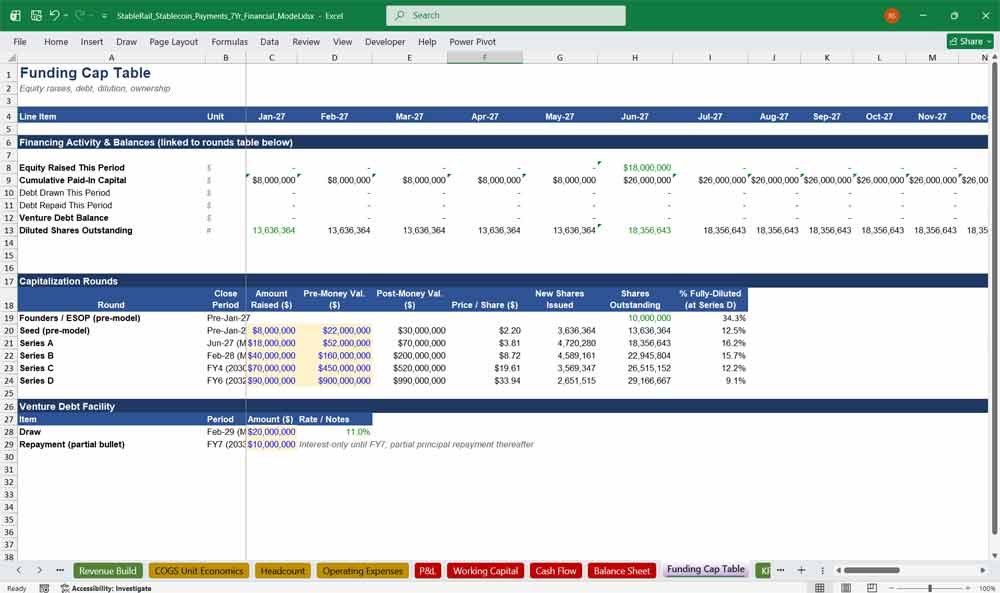
13. Funding Cap Table
The Funding Cap Table tab models the full capitalization history of the business — from founder/ESOP shares through Seed, Series A, B, C, and D, plus a venture debt facility — with price-per-share, dilution, and ownership percentage calculated dynamically, making it a ready-made cap table model for fundraising and board-deck use.
- Dynamic round-by-round cap table: pre-money valuation, post-money valuation, price per share, and new shares issued
- Automatic dilution and fully diluted ownership percentage calculation across every round
- Venture debt facility with draw amount, interest rate, and partial bullet repayment schedule
- Diluted share count and cumulative paid-in capital feeding directly into the DCF and balance sheet
14. KPIs Unit Economics
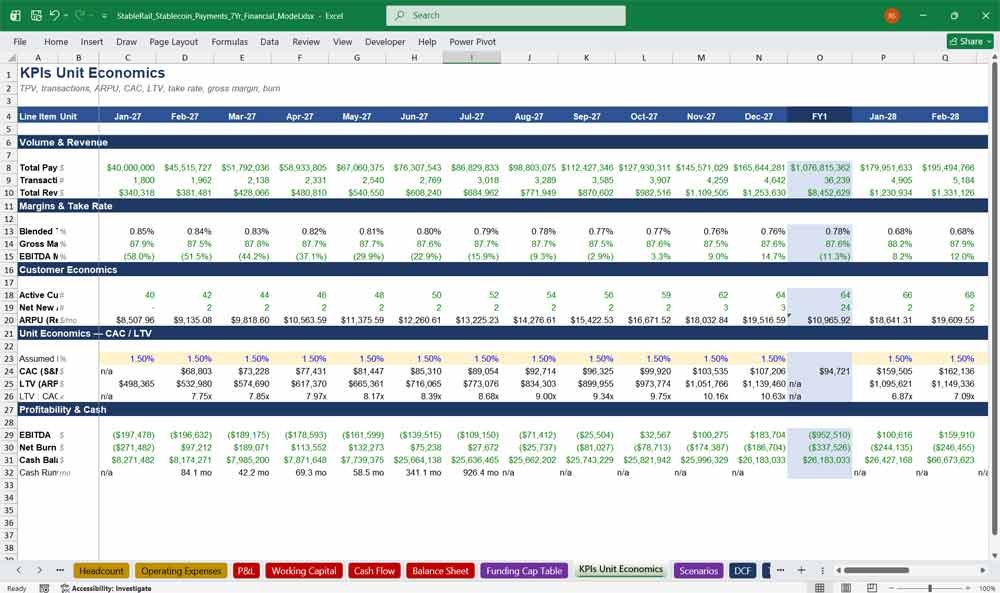
The KPIs Unit Economics tab distills the model into the metrics that matter most to stablecoin payments and fintech infrastructure investors — take rate, gross margin, ARPU, CAC, LTV, LTV:CAC ratio, EBITDA margin, and cash runway — giving a single tab for benchmarking unit economics against payments and stablecoin infrastructure peers.
- TPV, transaction count, revenue, and blended take rate (revenue/TPV) tracked by month and fiscal year
- ARPU, CAC, and LTV calculated with an explicit customer churn assumption for defensible unit economics
- LTV:CAC ratio as the headline efficiency metric investors screen for in payments and fintech infrastructure deals
- Net burn and cash runway (in months) calculated automatically off cash flow and cash balance
15. Scenarios
The Scenarios tab layers base, upside, and downside cases plus a two-variable sensitivity grid on top of the core model, letting founders and investors stress-test how TPV growth and take-rate compression assumptions move revenue and EBITDA outcomes for a stablecoin payments business without rebuilding the entire model.
- Base / Upside / Downside case selector with a dropdown scenario toggle
- Editable growth uplift, take-rate delta, and opex efficiency assumptions for each scenario
- Side-by-side FY7 revenue and EBITDA comparison across all three cases
- Two-variable sensitivity table showing implied FY7 revenue across a range of take-rate and TPV-growth assumptions
16. DCF
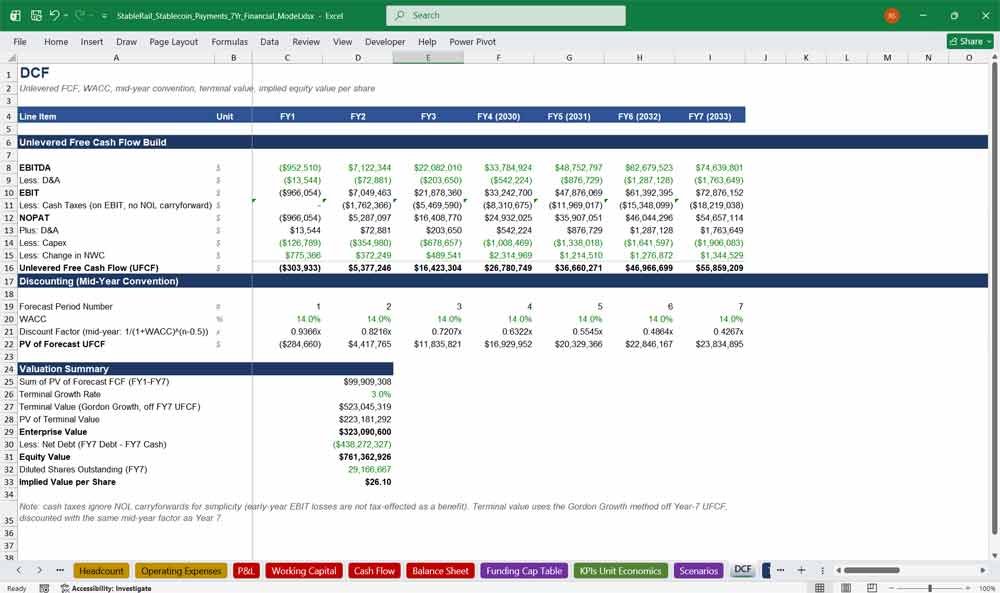
The DCF tab delivers a full unlevered discounted cash flow valuation for the stablecoin payments business, complete with mid-year convention discounting, Gordon Growth terminal value, and an implied equity value per share — the exact valuation methodology investors, bankers, and finance teams expect for a fintech infrastructure or payments company DCF model.
- Unlevered free cash flow build: EBITDA → EBIT → NOPAT → plus D&A, less capex, less change in NWC → UFCF
- Mid-year convention discount factors applied against a fully editable WACC assumption
- Terminal value via the Gordon Growth method, discounted and added to the sum of forecast free cash flow
- Enterprise value, net debt, equity value, diluted share count, and implied value per share all derived automatically
17. Trading Comps
The Trading Comps tab benchmarks the stablecoin payments business against public and private payments and stablecoin infrastructure peers on EV/Revenue, EV/Gross Profit, and EV/EBITDA multiples, translating market-based valuation signals into an implied enterprise value range that complements the DCF.
- Comparable company set spanning global payments platforms, card-issuing infrastructure, stablecoin issuers, and cross-border payments peers
- Median EV/Revenue, EV/Gross Profit, and EV/EBITDA multiples applied to the model’s own FY7 financials
- Implied enterprise value range blending all three valuation methods for a defensible comps-based valuation
- Multi-year revenue growth, gross margin, and TPV/revenue trend data for peer benchmarking over time
18. Dashboard
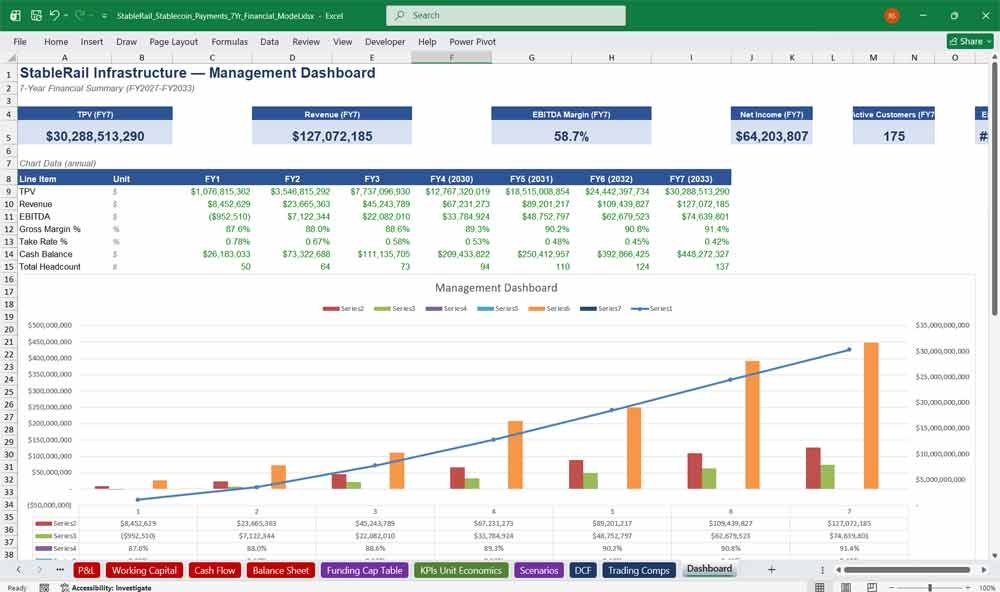
The Dashboard tab is the investor- and management-ready summary view of the entire stablecoin payments financial model, combining headline KPI cards with visual charts of TPV growth, revenue and EBITDA trajectory, take-rate and margin trends, and cash balance — built for board meetings, fundraising decks, and executive reporting.
- KPI summary cards for FY7 TPV, revenue, EBITDA margin, net income, active customers, and ending cash
- TPV growth chart visualizing volume scale across the full 7-year forecast
- Combined revenue and EBITDA chart showing the path from cash-burning growth to profitability
- Take-rate, gross-margin, and cash-balance trend charts summarizing unit economics and financial health at a glance
Why Buy This Stablecoin Infrastructure Financial Model?
A generic SaaS or startup financial model isn’t designed to capture the economics of cross-border payments or stablecoin settlement. This financial model is purpose-built around the mechanics that make a B2B stablecoin payments infrastructure business different: TPV-driven revenue, stablecoin flows, FX, on/off-ramps, blockchain costs, banking fees, liquidity, treasury requirements, customer funds, compliance, and settlement balances. Instead of spending weeks building these interconnected schedules from scratch, you get a ready-to-use Excel financial model for stablecoin payments that connects operating assumptions to the P&L, balance sheet, cash flow, funding, KPIs, DCF, and valuation. It gives founders and finance teams a professional foundation for fundraising and planning, while giving investors and analysts a transparent framework for testing the growth, unit economics, cash requirements, and valuation of a modern cross-border stablecoin payments company.
Stablecoin Frequently Asked Questions
Is this financial model actually built around stablecoin economics, or is it a generic payments template with stablecoin labels?
Every driver chain in the workbook is purpose-built for a stablecoin settlement business rather than retrofitted from a generic SaaS or payments template. TPV doesn’t flow straight to revenue — it’s routed through a dedicated Stablecoin Flows tab that splits volume into stablecoin-funded transactions, on-chain settlement, off-ramp conversion, and cross-border FX exposure, and sizes the treasury float and liquidity buffer a real stablecoin infrastructure company needs to hold. That same treasury float shows up on the balance sheet as stablecoin treasury holdings matched by customer custodial funds payable, and it feeds a dedicated liquidity cost of capital line in COGS — mechanics a generic payments or fintech template simply doesn’t have, because they only exist when stablecoins are the settlement rail.
Can I actually change the assumptions, or is this a static set of numbers dressed up as a model?
The entire workbook is formula-driven with every editable input color-coded in blue and consolidated on the Assumptions tab, so changing a growth rate, take rate, cost assumption, or funding round doesn’t require touching formulas anywhere else — it recalculates through all 18 tabs automatically. Customer growth, transaction take rate, FX spread, blockchain/gas cost, banking cost, fraud rate, compliance cost, hiring plan, and financing assumptions are all live inputs, not hardcoded outputs. Buyers evaluating a template for their own fundraise or planning cycle can substitute their own TPV ramp, pricing, and cost structure and trust that the P&L, balance sheet, cash flow, KPIs, DCF, and dashboard all update in lockstep, with a built-in balance-sheet check confirming assets equal liabilities plus equity in every period after the edit.
Will this work for my company’s stage and TPV scale, or is it calibrated to one specific size of business?
The model ships with an illustrative ramp (starting around $40M in monthly TPV and scaling toward $150–175M by month twelve, then compounding through year seven) purely to demonstrate the mechanics end-to-end, but because every dollar figure downstream of Assumptions and Operating Drivers is formula-derived from growth rates and unit economics rather than typed in directly, a buyer can rescale the starting TPV, customer count, or growth curve to fit an earlier-stage or later-stage business without rebuilding any tab. The same applies to headcount and opex, which are built as a function of stage-appropriate hiring ramps rather than fixed dollar amounts, so a leaner pre-seed cost structure or a larger scaled-up cost base can both be modeled by adjusting the Headcount and Operating Expenses tabs.
What file format does this come in, and do I need special software to open it?
The deliverable is a single native Excel (.xlsx) workbook with no add-ins, macros, or external plugins required — it opens in any current version of Excel on Windows or Mac, as well as in Google Sheets and LibreOffice Calc with formulas intact. All 18 tabs, formulas, and formatting are self-contained in the one file, so there’s nothing else to install or license separately, and every cell can be inspected, audited, and edited the same way any standard Excel financial model would be.
Does the model include a valuation, or is it just an operating forecast?
Both. Beyond the full three-statement operating model (P&L, balance sheet, cash flow), the workbook includes a dedicated DCF tab with unlevered free cash flow, mid-year discounting convention, a Gordon Growth terminal value, and an implied enterprise value and value per share, plus a Trading Comps tab that benchmarks the business against illustrative public and private payments and stablecoin infrastructure peer multiples on EV/Revenue, EV/Gross Profit, and EV/EBITDA. A buyer preparing a fundraising deck, board update, or internal valuation exercise gets both the operating detail and the two standard valuation methodologies investors and bankers expect, cross-checked against each other in the same file.
Further Reading
Tokenomics & Web3 Token Launch Model: Launch a Web3 token with greater financial clarity using this Tokenomics & Web3 Token Launch Financial Model in Excel. 10-year, 120-month tokenomics model, it helps founders, token designers, Web3 finance teams, and DAO operators.
- Bitcoin Financial Model: 7-Year, 3-Statement Bitcoin Mining Financial Model Template in MS Excel is designed for operators, sponsors, lenders, and consultants who need more than a back-of-envelope hash-rate calculator.