
Robotics Manufacturer Financial Model Template
This Robotics Manufacturer Financial Model Template is a fully integrated Excel financial model built for robotics start-ups, automation companies and hardware manufacturers. You get a five-year monthly forecast with annual roll-ups that links every driver to a connected Income Statement, Balance Sheet and Cash Flow Statement. The drivers run from marketing leads, pricing and the bill of materials through to production capacity, headcount and funding. Whether you build industrial robotic arms, autonomous mobile robots (AMRs), humanoid robots or turnkey automation cells, this robotics business plan template turns your assumptions into investor-ready financial projections.
Financial Model for a Robotics Manufacturer
Unlike generic startup templates, this model reflects how a robotics company really makes money: hardware sales, software licences, recurring subscriptions, maintenance contracts, spare parts, installation, integration and training. It covers a 46-component bill of materials per robot, production yield and scrap, assembly hours, capacity utilisation, inventory, warranty provisions and the installed base that drives recurring revenue. All 26 tabs work as one live model, so changing a price, a conversion rate or a component cost updates margins, cash flow and valuation instantly.
Built for founders, CFOs, investors, lenders and consultants, the model includes a Base / Upside / Downside scenario switch, break-even analysis, unit economics, a sensitivity analysis and a full DCF valuation with WACC. Change one Model Start Date and every month, year label and escalation re-dates automatically. Professional colour coding, built-in model checks and clean formatting make it ready for fundraising decks, bank loan applications, budgeting and strategic planning, in US dollars.
What’s Inside: Tab-by-Tab Overview
01. Cover & Contents
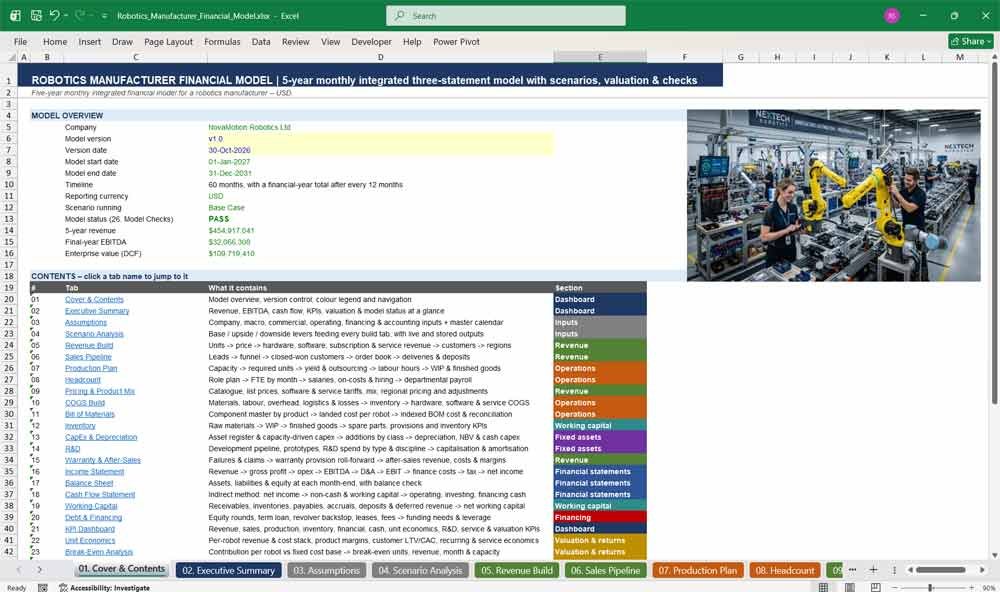
The cover page gives a clear overview of the robotics financial model: company name, version, model dates, scenario running and live model status. A clickable contents table links to all 26 tabs, and a colour legend and step-by-step guide help any user navigate the Excel template confidently from the first minute.
- Live headline figures: 5-year revenue, final-year EBITDA and enterprise value
- One-click hyperlinks to every tab
- Colour legend for inputs, calculations and links
- Six-step “How to use” guide
02. Executive Summary
The Executive Summary presents the robotics company’s key financial projections on one page: revenue, gross margin, EBITDA, net income, operating cash flow, free cash flow and closing cash. Headline KPIs, DCF valuation and model integrity status sit alongside charts, making it ideal for investor presentations and board packs.
- Revenue split into hardware, software & subscription, and service
- Robots delivered, customers, installed base and ARR
- Revenue & EBITDA and cash flow charts
- Break-even month, scenario running and check status
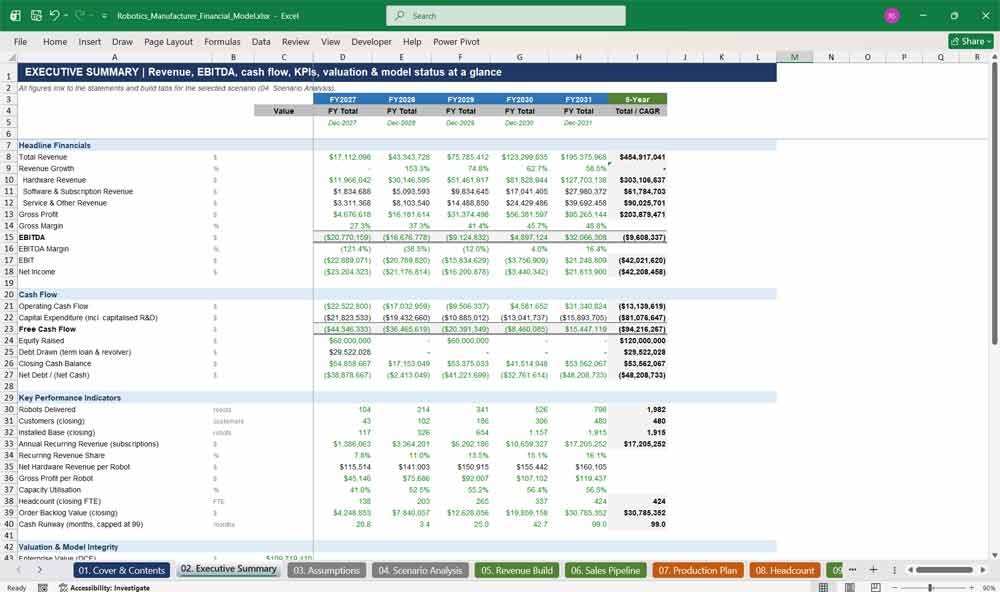
Robotics Manufacturer Revenues & COGS
03. Assumptions
The Assumptions tab is the control centre of the robotics manufacturing financial model. Every key input sits here: company information, inflation, commercial and sales assumptions, production, costs, working capital, headcount, CapEx, R&D, financing and accounting policies. The Model Start Date drives the entire five-year monthly timeline across the workbook.
- Over 100 clearly labelled inputs with explanatory notes
- Master calendar: change one date and the whole model re-dates
- Separate inflation rates for prices, salaries, materials, energy and logistics
- Tax rate, VAT, payment terms and inventory days in one place
04. Scenario Analysis
Scenario Analysis lets you stress-test your robotics business plan with a single switch between Base, Upside and Downside cases. Sixty levers flex revenue, sales, production, costs, headcount, CapEx, R&D, working capital and financing, and live outputs instantly show the effect on revenue, EBITDA, cash and valuation.
- 60 scenario levers across nine categories
- Live outputs including funding requirement and break-even month
- Stored side-by-side Base vs Upside vs Downside comparison
- Fixed scenario logic: multipliers, rate adjustments and timing shifts
05. Revenue Build
The Revenue Build models every revenue stream of a robotics manufacturer: robot hardware by product, software licences, subscriptions, AI software, maintenance contracts, repairs, installation, integration, training, spare parts and consulting. Customer counts, installed base, geographic revenue and revenue adjustments complete a detailed, bottom-up robotics revenue forecast.
- Four product lines: robotic arms, AMRs, humanoids and automation systems
- Monthly and annual recurring revenue (MRR/ARR) with churn and expansion
- Installed-base-driven service and spare parts revenue
- Revenue by UK, Europe, North America, Asia Pacific and Rest of World
06. Sales Pipeline
The Sales Pipeline tab converts marketing leads into paying customers through a realistic B2B robotics sales funnel: qualified leads, demonstrations, technical evaluations, pilots, proposals and negotiations. Orders flow into an order book and backlog, which is delivered over time, while customer deposits and sales performance metrics are tracked monthly.
- Full funnel with stage-by-stage conversion rates and a sales-cycle lag
- Order book, backlog units, backlog value and cancellations
- Customer deposit roll-forward
- Customer acquisition cost, commission and revenue per sales rep
07. Production Plan
The Production Plan turns sales forecasts into a manufacturing schedule. It models production capacity growth, utilisation, yield, defects, rework and scrap, while assembly hours drive labour requirements. Demand above in-house capacity overflows automatically to contract manufacturing, so this robotics production model always reflects real factory constraints.
- Capacity, utilisation and bottleneck tracking
- Production by product with finished goods stock targets
- Yield, first pass yield, rework and scrap rates
- Hours by manufacturing stage, from component prep to dispatch
08. Headcount
The Headcount tab plans more than 40 roles across executive, engineering and R&D, manufacturing, sales and marketing, operations and customer support. Annual hiring targets ramp monthly, assembly technicians scale with production hours, and field engineers scale with the installed base, giving accurate payroll forecasts for a growing robotics company.
- Role-by-role salary and FTE plan for five years
- Bonuses, employer taxes, pension and benefits
- Turnover, backfills and recruitment costs with lead time
- Fully loaded payroll allocated by department
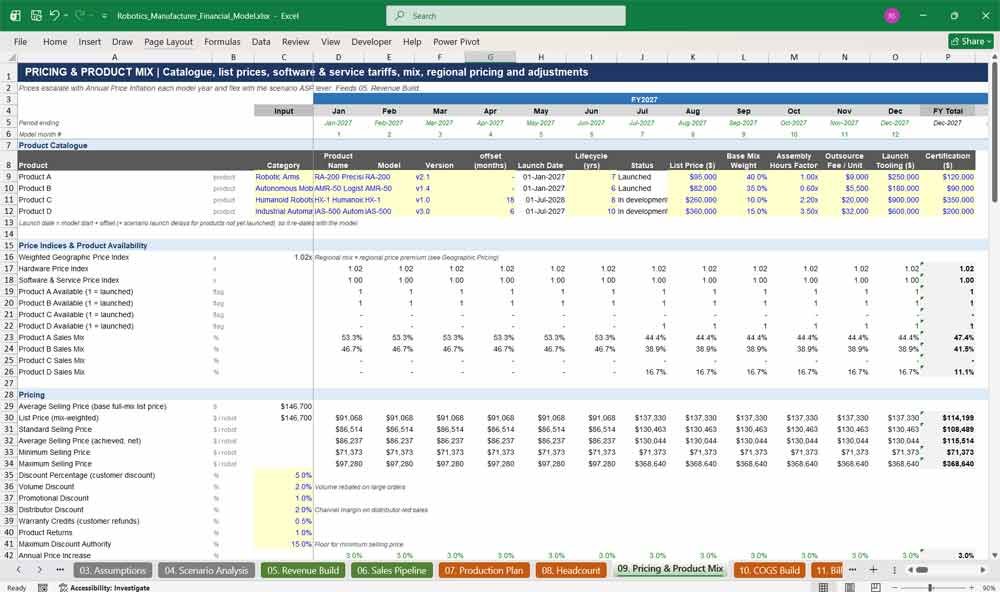
09. Pricing & Product Mix
Pricing & Product Mix holds the product catalogue, list prices and launch dates, plus software, subscription and service tariffs. Prices escalate annually, the sales mix updates as new robots launch, and discounts, rebates, returns and regional price premiums produce an accurate net selling price for every robot.
- Product catalogue with launch dates tied to the start date
- Hardware, software and service price lists
- Discounts, distributor margins, rebates and returns
- Geographic pricing including GBP-denominated UK prices
10. COGS Build
The COGS Build calculates the true cost of manufacturing robots: direct materials by component group, direct labour, factory overhead, inbound and outbound logistics, quality losses, software costs and service costs. Production costs are capitalised into inventory and released on sale, giving accurate gross margin and gross profit per robot.
- 15 material groups, from motors and sensors to fasteners
- Factory rent, utilities, electricity, maintenance and outsourcing
- Scrap, rework, testing, yield losses and inventory write-offs
- Cost per unit manufactured and sold, variable vs fixed costs
11. Bill of Materials
The Bill of Materials lists 46 robot components across mechanical, electrical, sensors and vision, computing, software and consumables. Each component has a supplier, location, lead time, MOQ, price, quantity per product, freight, import duty and scrap allowance, creating a detailed, editable robotics BOM cost model.
- Component quantities for four robot products
- Landed cost per robot: materials, freight and duty
- Cost index for inflation, design savings, substitutions and FX
- BOM reconciliation from opening to closing cost per robot
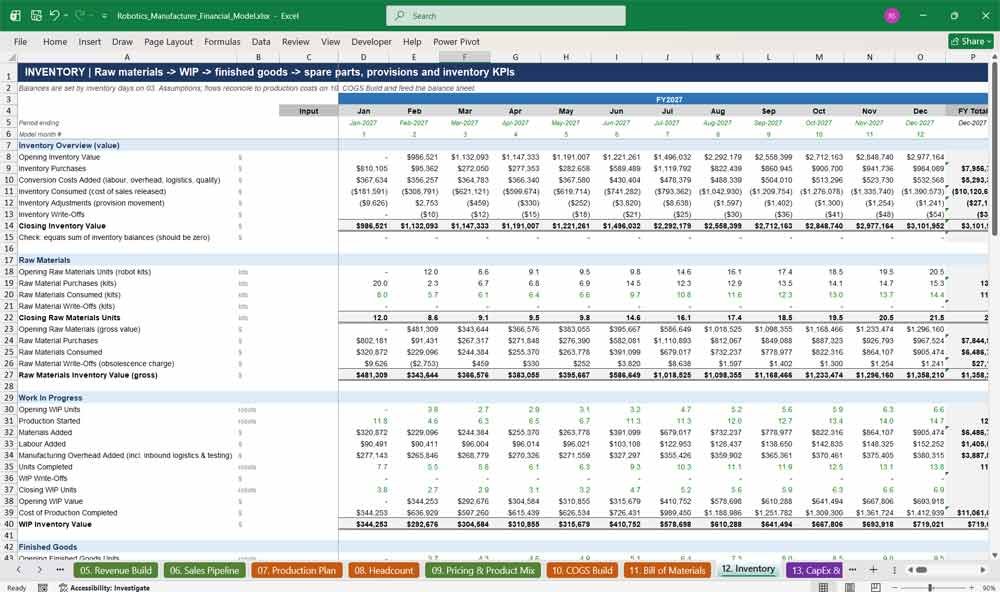
12. Inventory
The Inventory tab tracks raw materials, work in progress, finished goods and spare parts in units and value. Balances follow your inventory days, with safety stock, minimum and maximum stock levels. Obsolescence provisions, write-downs and procurement metrics complete a manufacturing inventory model that ties directly to the balance sheet.
- Full roll-forward from raw materials to cost of sales
- Safety, minimum and maximum stock controls
- Obsolescence provision and one-off write-down inputs
- Inventory turnover and inventory days
13. CapEx & Depreciation
CapEx & Depreciation schedules factory fit-out and expansion, manufacturing equipment, tooling, IT, software and R&D assets. Equipment spend scales automatically with new production capacity, and maintenance CapEx follows your asset base. Straight-line depreciation by asset class flows to the income statement, balance sheet and cash flow.
- Dated asset register with repeat purchase cycles
- Capacity-driven machinery, testing and tooling CapEx
- Useful lives and residual values by asset class
- Net book value schedule and cash CapEx mapping
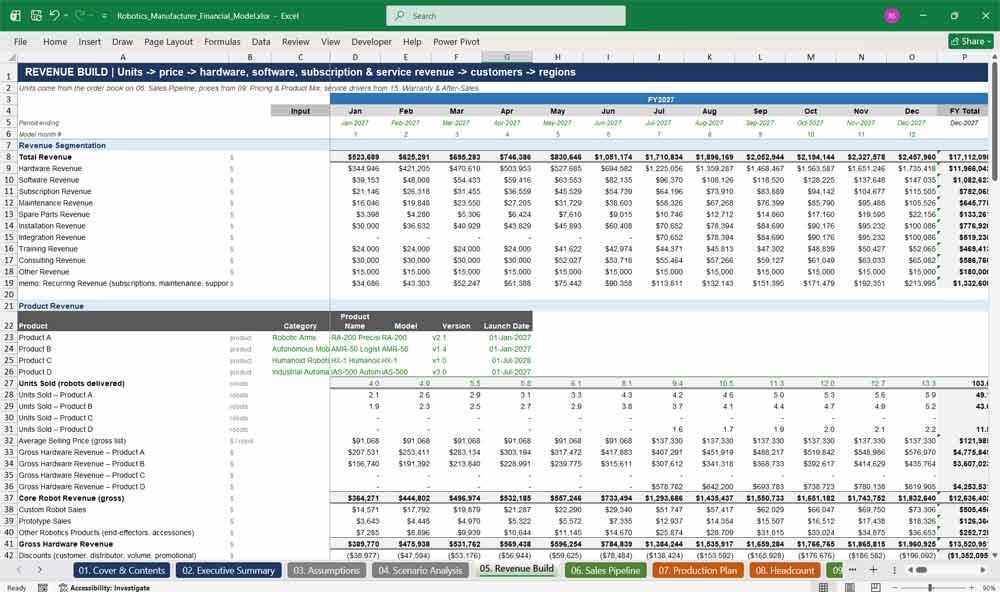
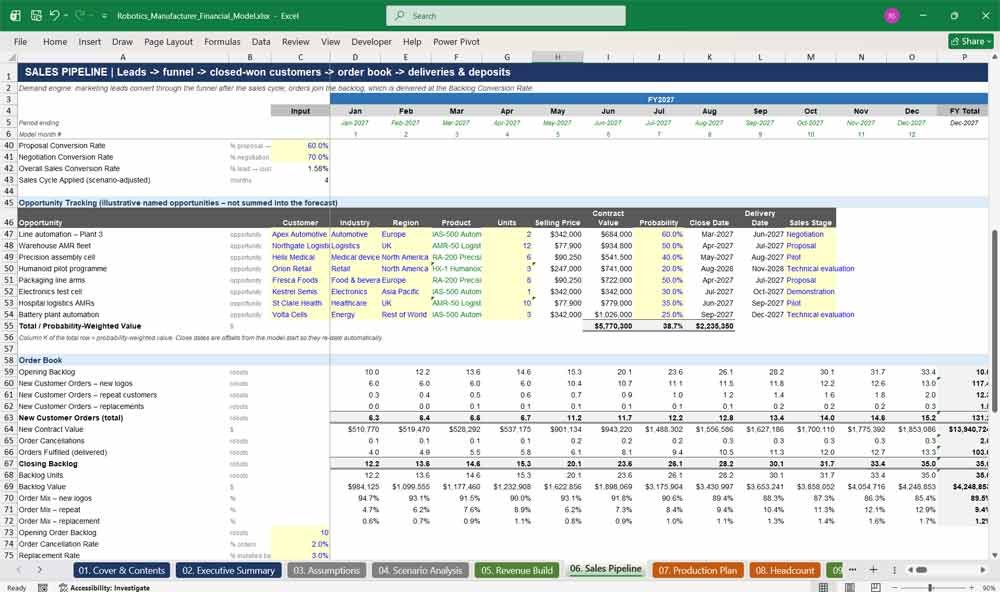
Robotics Manufacturer Financial Statements
14. R&D
The R&D tab models the product development pipeline, prototype builds, engineering payroll, consultants, testing, certification and software development. A share of R&D spend is capitalised under IAS 38 and amortised, giving robotics companies a realistic view of their research investment and its effect on profit and assets.
- Four development projects with budgets, timelines and milestones
- Prototype costs split into seven categories
- R&D spend by engineering discipline and software area
- Capitalised R&D roll-forward and amortisation
15. Warranty & After-Sales
Warranty & After-Sales forecasts failure rates, warranty claims, repairs and replacements, with a warranty provision that builds and releases over time. It also models maintenance contracts, renewals, technical support and spare parts, showing the recurring after-sales revenue and service margins that make robotics businesses valuable.
- Units under warranty, claims, repairs and replacements
- Warranty provision roll-forward with releases
- Service revenue, service costs and service gross margin
- Contract attachment, renewal and churn assumptions
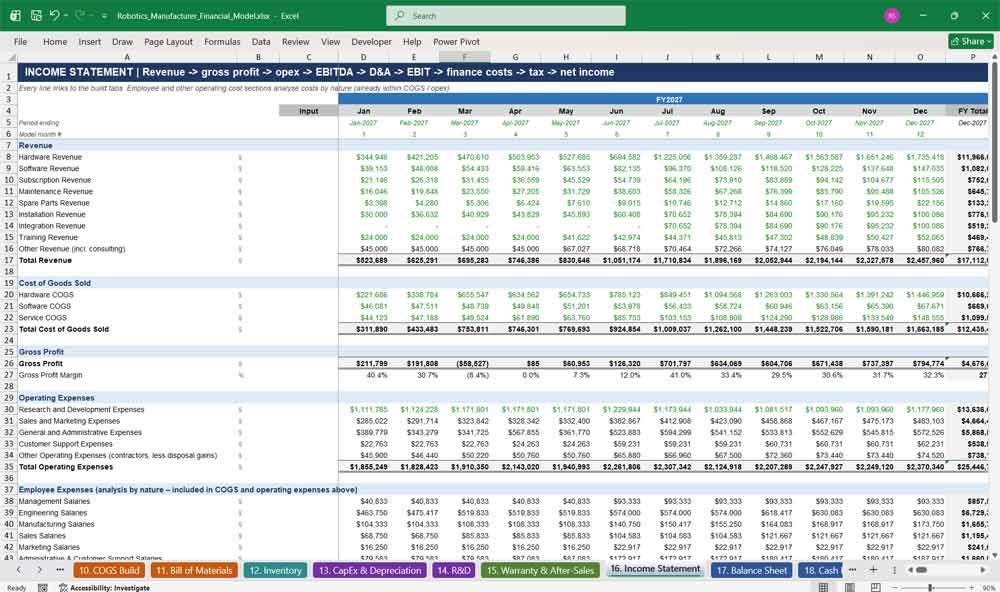
16. Income Statement
The monthly Income Statement presents revenue by stream, cost of goods sold, gross profit, operating expenses, EBITDA, depreciation, EBIT, finance costs, tax and net income. Employee and overhead costs are also analysed by nature, and growth metrics and earnings per share are calculated for every year.
- Nine revenue lines and three COGS lines
- R&D, sales & marketing, G&A and customer support expenses
- Tax losses carried forward automatically
- Margins, growth rates and EPS
17. Balance Sheet
The Balance Sheet shows assets, liabilities and equity at every month-end, including receivables, contract assets, four inventory types, fixed assets, capitalised R&D, deposits, deferred revenue, warranty provisions, debt, leases and equity. A built-in balance check confirms the robotics financial model balances in every period.
- Fully linked to every supporting schedule
- Current and long-term debt, leases and warranty provisions
- Share capital, premium, retained and current-year earnings
- Balance check every month
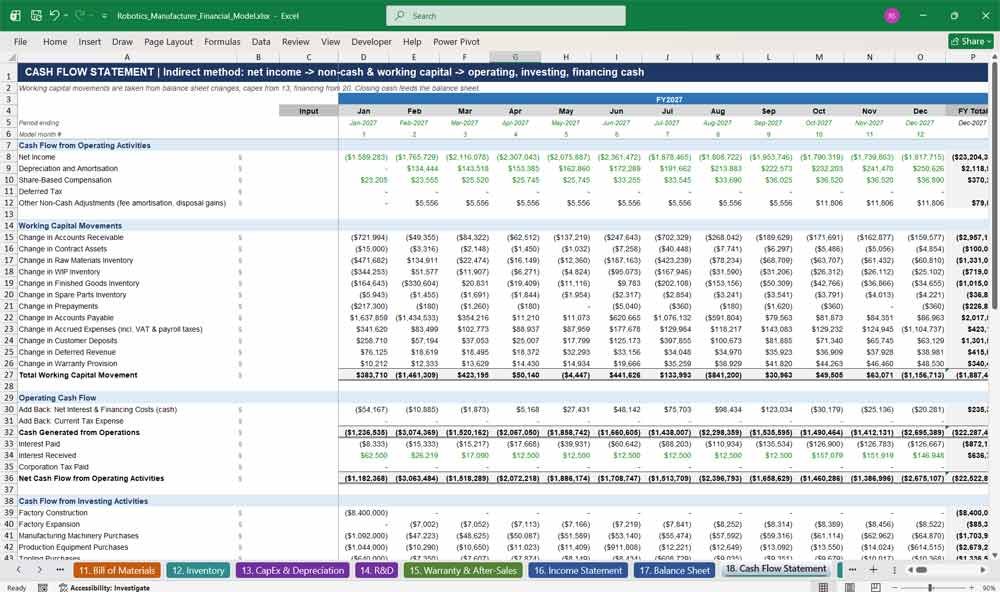
18. Cash Flow Statement
The indirect-method Cash Flow Statement reconciles net income to cash through non-cash items and twelve working capital movements. It then shows investing and financing cash flows. Cash burn, free cash flow, cash runway and funding requirement show exactly how much capital the robotics business needs, and when.
- Operating, investing and financing cash flows
- Detailed working capital movements
- Free cash flow, monthly burn and cash runway
- Opening to closing cash reconciliation
19. Working Capital
The Working Capital tab models receivables, contract assets, inventories, payables, accruals, prepayments, VAT, payroll taxes, customer deposits and deferred revenue. Each balance follows your days assumptions, rolls forward monthly and feeds a net working capital summary and cash conversion cycle for robotics manufacturing.
- Receivables with bad debt and deposits applied
- Payables, bonus accruals and other accruals
- Deferred revenue on annual subscriptions
- AR, AP and inventory days plus cash conversion cycle
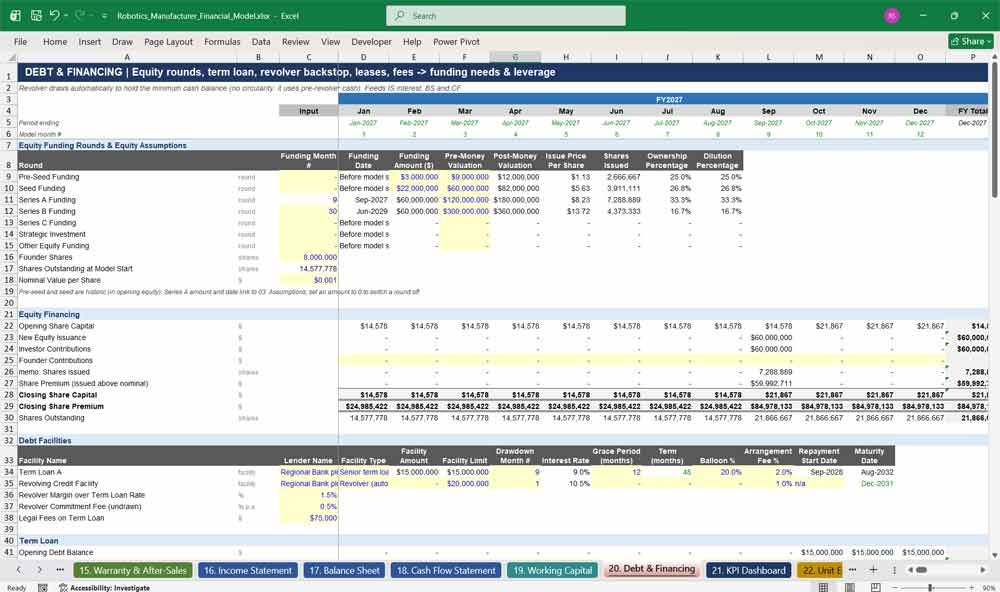
20. Debt & Financing
Debt & Financing covers equity funding rounds, a term loan with grace period and balloon, an automatic revolving credit facility, equipment leases and financing fees. The revolver draws to protect your minimum cash balance, while funding requirement outputs show the next funding date and capital needed.
- Pre-seed to Series C rounds with valuations, shares and dilution
- Term loan amortisation, interest and current portion
- Automatic revolver backstop without circular references
- Net debt, leverage and interest coverage ratios
Key Financial Metrics for a Robotics Manufacturer
21. KPI Dashboard
The KPI Dashboard brings together more than 80 annual robotics business KPIs: revenue, sales, production, inventory, financial, cash and financing, unit economics, R&D, service and valuation metrics. It is ideal for tracking performance, setting targets and answering investor due-diligence questions quickly.
- ARR, MRR, recurring revenue % and customer metrics
- Capacity utilisation, yield, defect and scrap rates
- LTV to CAC ratio, payback and contribution margin
- EV to revenue, EV to EBITDA and implied share price
22. Unit Economics
Unit Economics breaks down revenue, costs and profit per robot: selling price, discounts, BOM cost by category, labour, overhead, logistics, warranty and commission. It also shows customer lifetime value, CAC payback, recurring revenue per robot and product-by-product contribution margins with a profitability ranking.
- Net revenue and full cost stack per robot
- Contribution margin by product and weighted average
- Customer LTV, CAC and LTV to CAC ratio
- Service and recurring revenue economics per installed robot
23. Break-Even Analysis
The Break-Even Analysis classifies costs as variable or fixed, calculates contribution margin per robot and shows break-even units, break-even revenue and the first EBITDA-positive month. Product-level break-even, capacity analysis and price, material and volume stress tests show how resilient the robotics business is.
- Break-even units, revenue and month
- Fixed cost coverage and EBITDA headroom
- Break-even by product and capacity needed
- Stored base, upside and downside break-even dates
24. Sensitivity Analysis
Sensitivity Analysis flexes one driver at a time and shows the impact on revenue, EBITDA, margin, free cash flow and enterprise value. It covers prices, volumes, BOM and labour costs, production yield, working capital days, financing and valuation inputs. All tables are live, with no data tables or macros.
- Selling price −20% to +20% and volume −30% to +30%
- Cost, production and working capital shocks
- Discount rate, terminal growth and exit multiple sensitivities
- Summary of impacts including cash runway and break-even timing
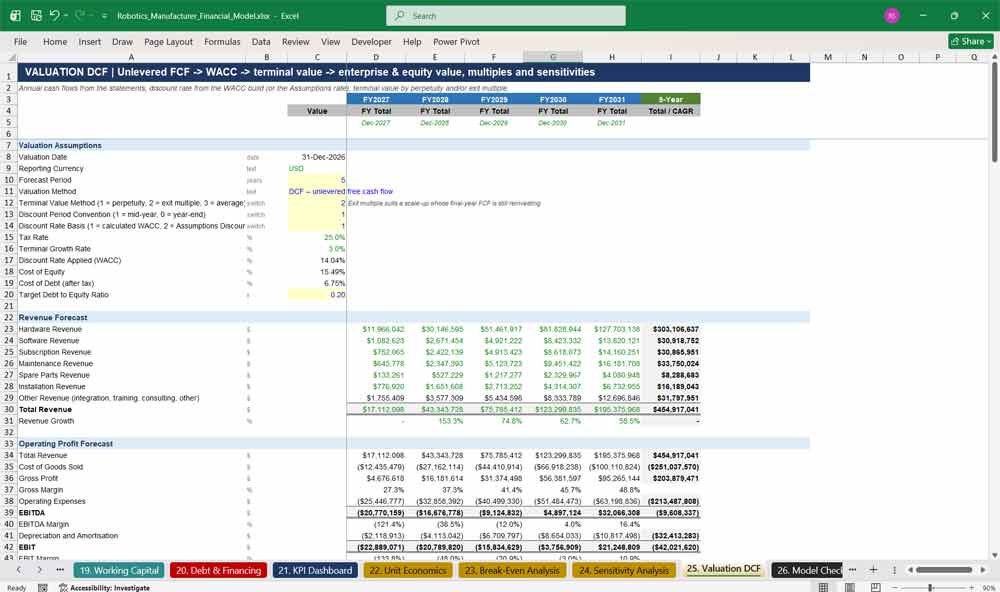
25. Valuation DCF
The Valuation DCF tab values the robotics company using unlevered free cash flow, a full WACC build with relevered beta, and terminal value by exit multiple, perpetuity growth or an average of both. An equity bridge, implied share price, valuation multiples and sensitivity grids complete an investor-grade valuation.
- NOPAT, reinvestment and unlevered free cash flow
- WACC from CAPM with size premium and target capital structure
- WACC × growth and WACC × exit multiple grids
- Enterprise value, equity value and valuation range
26. Model Checks
Model Checks gives confidence that the financial model is built correctly. It runs 22 critical checks every month, including balance sheet, cash, equity, revenue, COGS, inventory, fixed assets and payroll. Business warnings flag revolver use or capacity bottlenecks, and an overall status shows PASS or REVIEW.
- 22 critical integrity checks every month
- Separate business warnings, such as funding need
- Monthly PASS / REVIEW status
- Overall status shown on the cover and executive summary
Why Buy This Model
Building a robotics financial model from scratch takes weeks of specialist work and still risks broken links and missed details. This template gives you a professionally structured, fully integrated five-year monthly model built around how robotics manufacturers actually operate: bill of materials, production yield, capacity, installed base, recurring software and service revenue, warranty and capital-intensive growth. Every number is formula-driven, every statement balances and every assumption is clearly marked, so you can focus on your strategy rather than your spreadsheet. Use it to raise investment, apply for bank finance, set budgets, test pricing and production plans, or value your robotics business with confidence. It also costs a fraction of hiring a financial modelling consultant.
Robotics Manufaturing Frequently Asked Questions
Is this model suitable for my type of robotics business?
Yes. It comes set up for four product lines: robotic arms, autonomous mobile robots, humanoid robots and industrial automation systems. You can rename the products, change prices, launch dates and components, or set a product’s mix to zero, to fit industrial, logistics, service or medical robotics.
Do I need advanced Excel skills to use it?
No. Inputs are blue on yellow, calculations are black and links are green. The cover page includes a step-by-step guide and clickable navigation. Most users only change the Assumptions tab and the input tables at the top of each build tab.
Can I change the start date and forecast years?
Yes. Change the Model Start Date on the Assumptions tab and every month, year label, launch date, funding date and inflation step updates automatically across all 26 tabs.
Does it include monthly and annual figures?
Yes. It forecasts 60 months, with an FY Total column after every 12 months. Summary tabs such as the Executive Summary, KPI Dashboard, Unit Economics, Break-Even and DCF show annual figures plus five-year totals or CAGR.
Do the three financial statements really link and balance?
Yes. The Income Statement, Balance Sheet and Cash Flow Statement are fully integrated, and the Model Checks tab confirms the balance sheet balances and cash reconciles in every month.
Can I model my own bill of materials?
Yes. The BOM tab lists 46 components with editable prices, quantities per product, suppliers, lead times, freight, import duty and scrap allowance. Costs flow automatically into COGS, inventory, unit economics and break-even.
How does the model handle funding?
You can enter equity rounds from pre-seed to Series C, a term loan with grace period and balloon, equipment leases and a revolving credit facility. The revolver draws automatically to keep cash above your minimum, and the model shows your funding gap and next funding date.
Can I run different scenarios?
Yes. One switch moves the whole model between Base, Upside and Downside cases using 60 levers. A stored comparison table shows all three side by side, and the Sensitivity tab flexes single drivers live.
Does it include a valuation?
Yes. The DCF tab builds unlevered free cash flow, calculates WACC with a relevered beta, and values the business using an exit multiple, perpetuity growth or both. It then bridges to equity value and an implied share price, with sensitivity grids.
Will it work for a pre-revenue robotics start-up?
Yes. The model starts from zero with opening cash, pilot customers and a pre-launch sales pipeline. It shows the cash burn, funding needed and the month the business reaches break-even.
Does the model use macros?
No. It is built entirely with standard Excel formulas, with no macros, VBA or data tables, so it is transparent, auditable and safe to share with investors and lenders.
Can I present it to investors and banks?
Yes. The professional formatting, executive summary charts, KPI dashboard, valuation and integrity checks are designed for fundraising, lender reviews and board reporting.
Which version of Excel do I need?
Excel 2016 or later (including Microsoft 365) on Windows or Mac is recommended. The model avoids newer dynamic-array functions for wide compatibility.
Final Notes on the Financial Model
Financial model for a Robotics manufacturer
- Scenario Analysis: Create best-case, base-case, and worst-case projections.
- Break-even Analysis: Determine sales volume required to cover fixed & variable costs.
- Sensitivity Analysis: Assess how changes in raw material costs, pricing, or demand impact profitability.
This structured finance model helps a Robotics manufacturing business address a broad market spectrum, offering the right balance between cost, production capacity, support, and customization at each subscription level.